. 2025 Jul 29;122(30):e2424733122.
doi: 10.1073/pnas.2424733122. Epub 2025 Jul 22.

OGG1 augments the transcriptional activation of Foxp3 to promote iTreg differentiation for IBD alleviation

Affiliations

OGG1 augments the transcriptional activation of Foxp3 to promote iTreg differentiation for IBD alleviation

Miaomiao Tian et al. Proc Natl Acad Sci U S A. .

Abstract

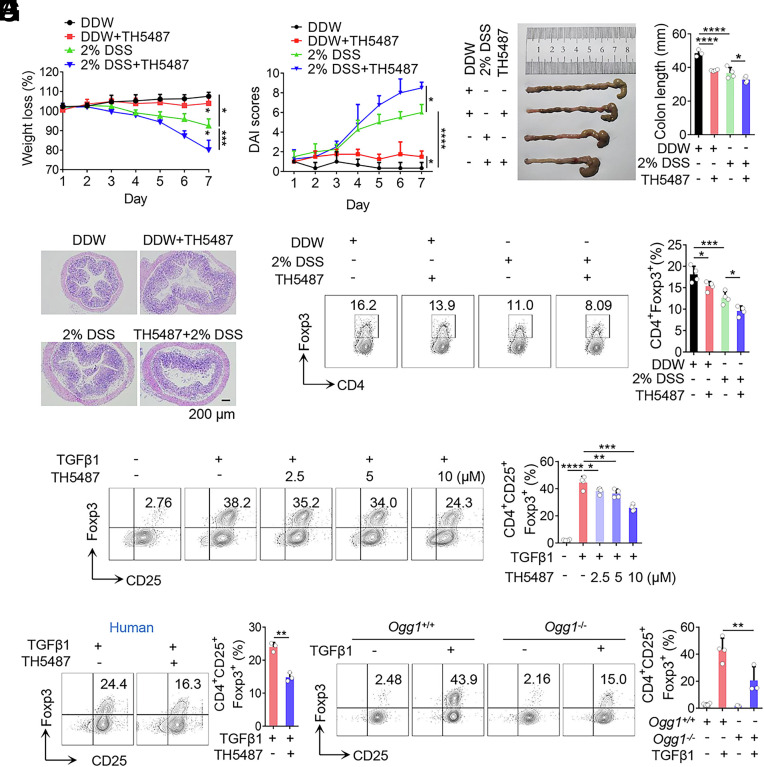
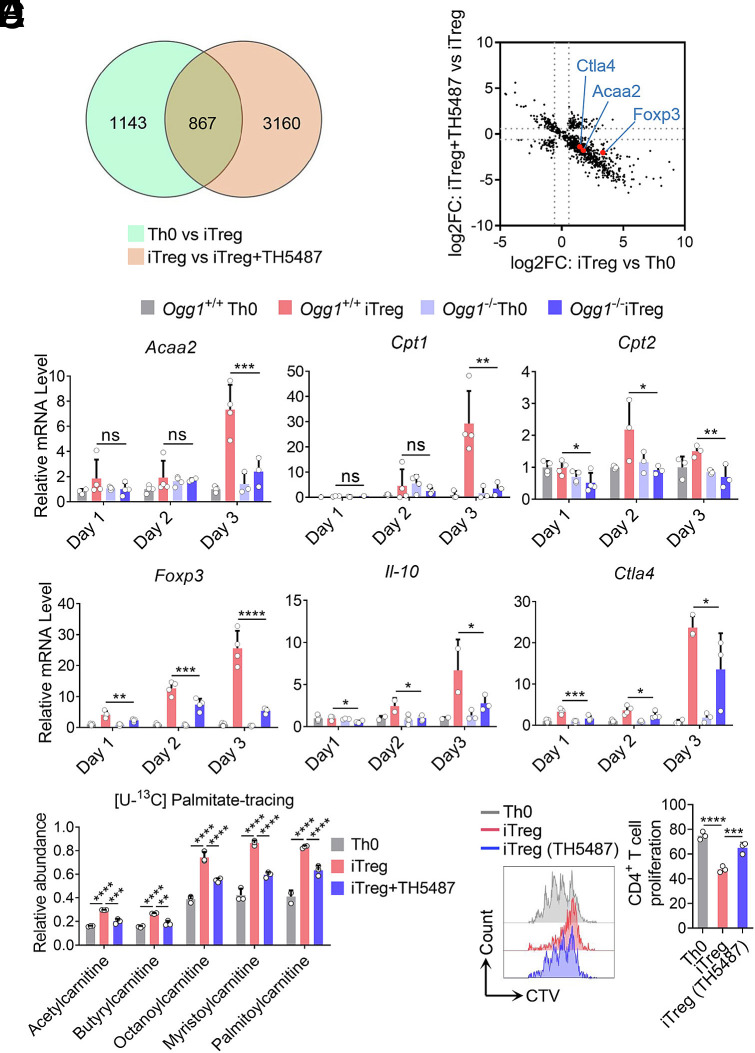
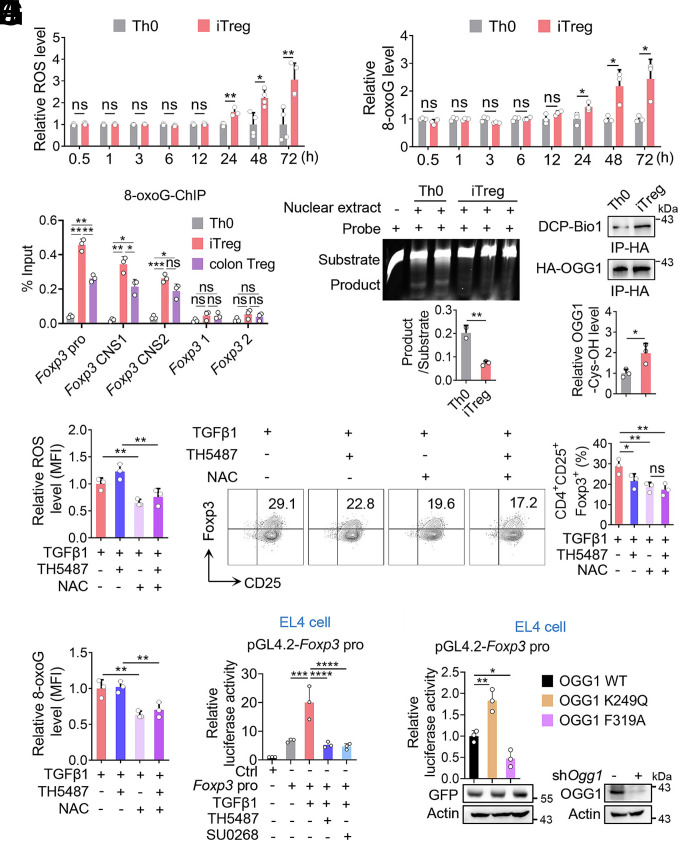
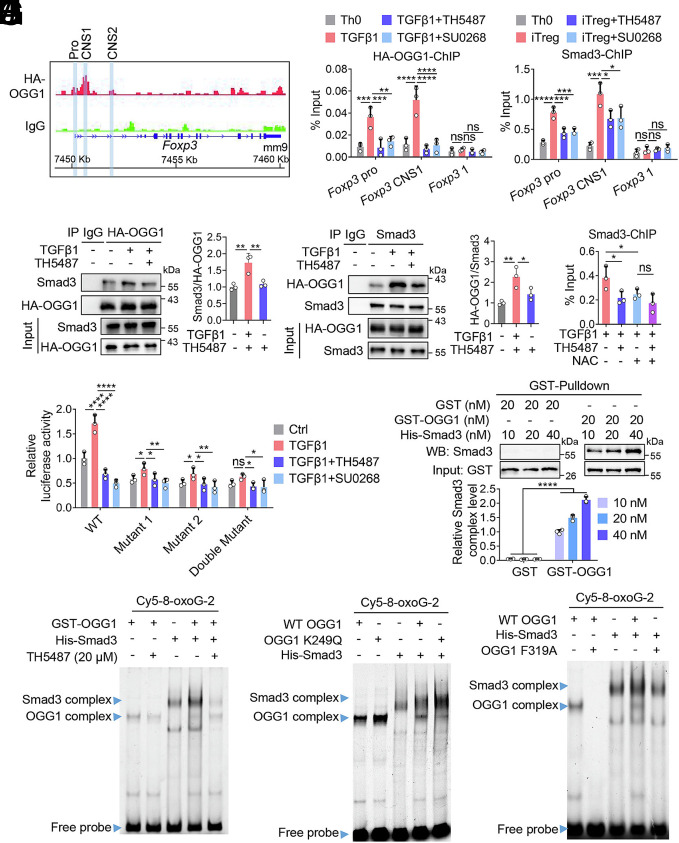
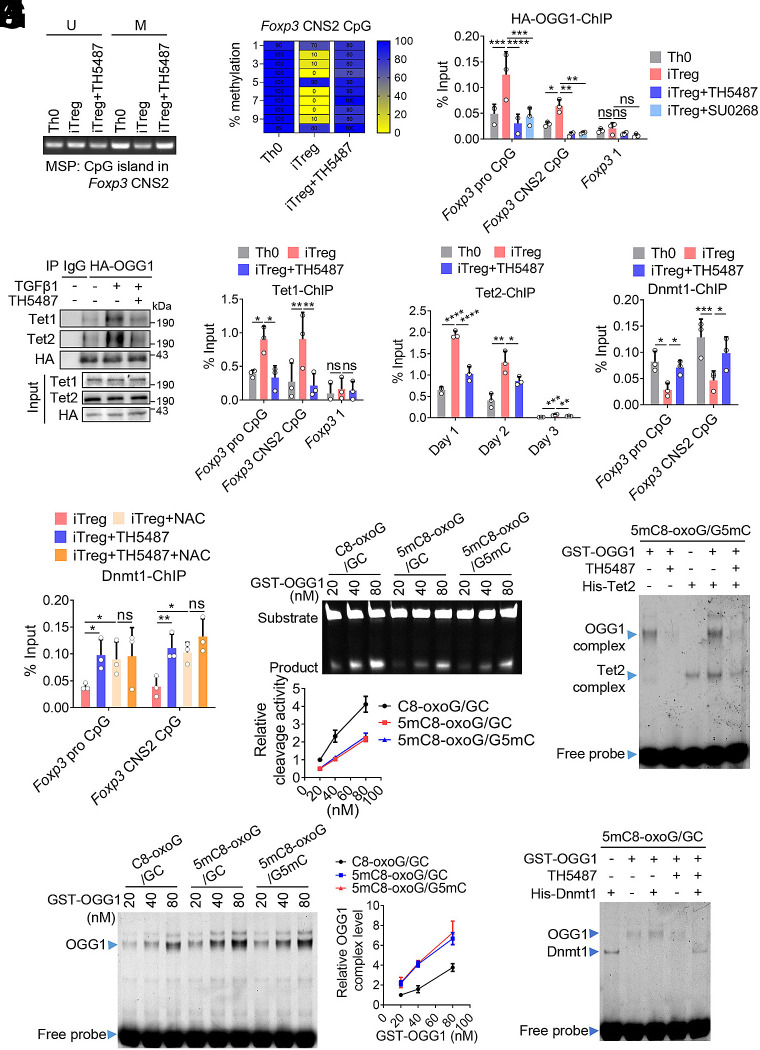
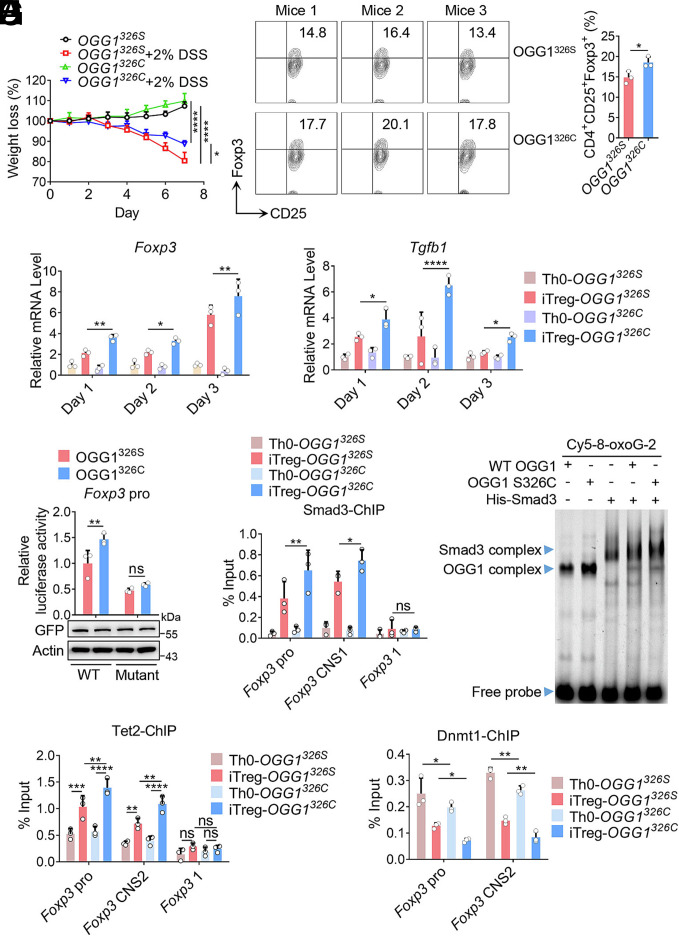
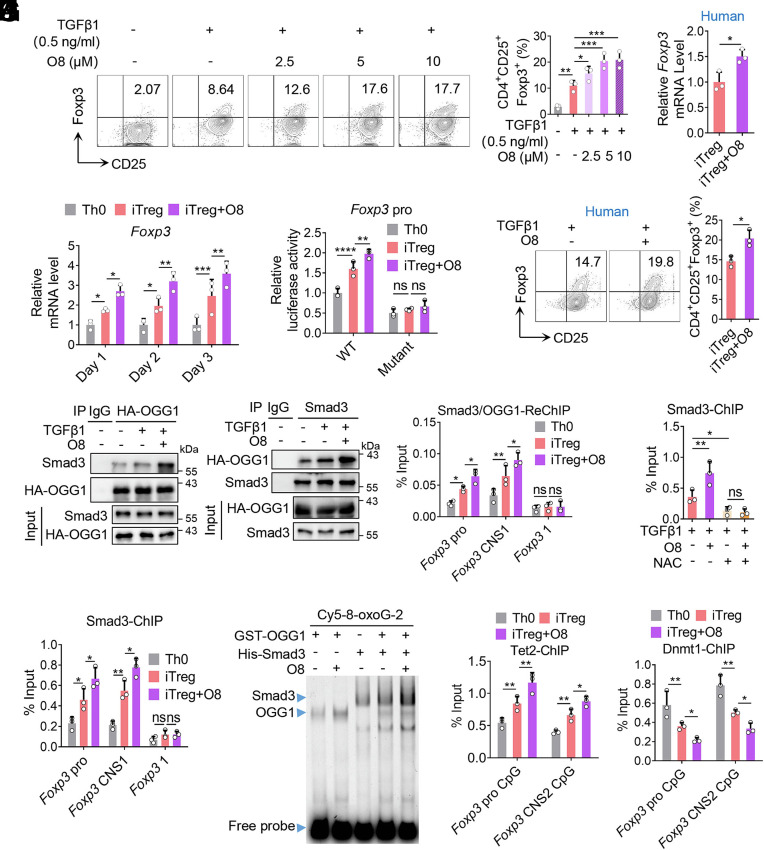
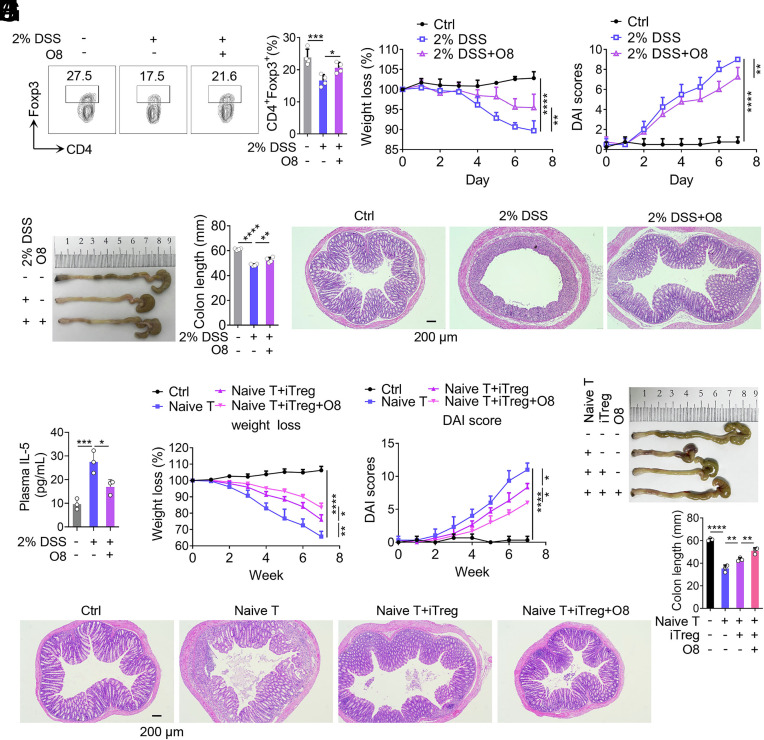
8-oxo-7,8-dihydroguanine (8-oxoG), the most frequent form of oxidative-DNA-base lesion caused by ROS, is recognized and repaired by 8-oxoguanine DNA glycosylase 1 (OGG1) through base excision repair (BER) pathway. Beyond its role in DNA repair, OGG1 has been shown to promote transcriptional activation of proinflammatory mediators and contribute to both acute and chronic lung inflammation. However, pioneering studies have shown an anti-inflammation role for OGG1 in inflammatory bowel disease (IBD), but its underlying molecular mechanism remains unclear. In the present study, we unveiled that OGG1 plays an important role in the differentiation of inducible regulatory T cells (iTregs). Binding of OGG1 to 8-oxoG facilitated the recruitment of Smad3 to the Foxp3 promoter, leading to the transcriptional activation. Moreover, OGG1 binding promoted demethylation of CpG sites in the conserved noncoding sequence 2 (CNS2) region of Foxp3 by decreasing Dnmt1 occupancy and enhancing recruitment of Tet1/2. Notably, the S326C variant-a naturally occurring polymorphism in humans-was more effective than the wild-type protein in promoting iTreg differentiation and showed a negative correlation with IBD incidence. Furthermore, treatment with O8, a selective OGG1 inhibitor that blocks base excision activity without affecting substrate binding, significantly alleviated IBD in a mouse model, suggesting a promising therapeutic strategy. Together, these findings extend the understanding of OGG1's epigenetic role in transcriptional regulation and highlight its protective function in inflammatory diseases, potentially shaped by aerobic evolution.

Keywords: Foxp3; IBD; OGG1; Smad3; iTreg differentiation.


Conflict of interest statement

Competing interests statement:The authors declare no competing interest.

Figures

Fig. 1.
Fig. 1.
Inhibition or depletion of OGG1 decreases iTreg differentiation and exacerbates IBD in the mouse model. (AE) Inhibition of OGG1 reduces Treg frequency in colon and aggravates mouse IBD. Mice were administered DSS (2%, w/v) in double-distilled water (DDW). Concurrently, the OGG1 inhibitor TH5487 was administered (30 mg/kg/d) intraperitoneally every other day. The solvent DMSO was used as the negative control. Colitis was systematically evaluated daily. Body weight (A) and disease activity index (DAI) scores (B)—based on body weight loss, stool consistency, and the presence of blood in the stool—were recorded daily. Seven days later, entire colons were harvested from differently treated mice for length assessment (C) and hematoxylin and eosin (H and E) staining to assess histopathological changes (D). (Scale bar, 200 μm.) iTreg frequency in colonic lamina propria were analyzed by flow cytometry (FCM) (E). (F) Inhibition of OGG1 reduces iTreg differentiation. Naïve CD4+ T cells were cultured under Th0 or iTreg polarization conditions with varying concentrations of TH5487 for 3 d and analyzed by FCM for CD4+CD25+Foxp3+ iTregs (Left) followed by quantification (Right). (G) OGG1 inhibition suppresses human iTreg differentiation. Naive CD4+ T cells isolated from human peripheral blood were cultured under iTreg polarization conditions, prior to analysis for CD4+CD25+Foxp3+ iTregs by FAM (Left) and quantification (Right). (H) OGG1 depletion significantly suppresses iTreg differentiation. Naïve CD4+ T cells derived from Ogg1+/+ or Ogg1−/− mice were cultured as described in the legend to panel (F) and stained for CD4+CD25+Foxp3+ iTreg were analyzed by FAM (Left) and quantified (Right). (AE) One representative experiment out of four biological replicas is shown. Data represent mean ± SD (n = 4), with significance determined by two-way ANOVA test (A and B) or one-way ANOVA test (C and E). (FH) Quantification shows mean ± SD from four (F and H) or three (G) independent experiments, with significance determined by one-way ANOVA test (F and H) or t test (G). *P < 0.05, **P < 0.01, ***P < 0.001, ****P < 0.0001.
Fig. 2.
Fig. 2.
OGG1 is implicated in transcriptional activation of genes for lineage differentiation, fatty acid oxidation, and suppressive function of iTregs. (A and B) RNA sequencing analysis identifies the gene expression profile regulated by OGG1. Naïve CD4+ T cells were cultured under Th0 or iTreg polarization conditions with or without TH5487 (10 μM) for three days. Total RNA was extracted followed by RNA-Sequencing. A Venn diagram shows the number of iTreg differentiation-related genes affected by OGG1 (A). Scatter plots show the distribution of differentially expressed genes in Th0 cells, iTregs, and TH5487-treated iTregs [adjusted P value < 0.05 (B)]. (C) OGG1 depletion inhibits the transcription of Foxp3 and other genes related to iTreg metabolism or function. Naïve CD4+ T cells derived from Ogg1+/+ or Ogg1−/− mice were cultured as described in the legend to (A and B). Total RNA was extracted, converted to cDNA, and analyzed by qPCR for gene expression. (D) Inhibition of OGG1 reduces FAO. Naïve CD4+ T cells were treated with TH5487 (10 μM) and cultured as in legend to (A and B) in the presence of [U-13C] palmitate (100 μM) for 48 h. Cells were collected and analyzed for FAO using ultra-high-performance liquid chromatography–high-resolution mass spectrometry (UHPLC-HRMS) analysis. n = 4, two-way ANOVA test, mean ± SD. (E) Inhibition of OGG1 impairs the suppressive function of iTregs. Naïve CD4+ T cells from Foxp3YFP mice were treated with TH5487 (10 μM) and cultured under Th0 or iTreg polarization conditions for three days. Pure iTregs were sorted by FCM and cocultured with CellTrace Violet (CTV)-stained naïve CD4+ T cells in the presence of Dynabeads® Mouse T-Activator CD3/CD28 for 72 h. CD4+ T cell proliferation was analyzed by FCM (Left) and quantified (Right). (C and E) Data represent mean ± SD from four (C) or three (E) independent experiments. Statistical significance was determined by two-way ANOVA (C) or one-way ANOVA test (E). *P < 0.05, **P < 0.01, ***P < 0.001, ****P < 0.0001. ns, not significant.
Fig. 3.
Fig. 3.
Nonproductive binding rather than catalytic activity of OGG1 is required for its promoting effect on Foxp3 transcription. (A and B) ROS and 8-oxoG levels increase during iTreg differentiation. Naïve CD4+ T cells were cultured under Th0 or iTreg polarization conditions for three days. Cells were harvested at the indicated time points, incubated with the cell-permeable ROS probe DCFH-DA and analyzed by FCM to quantify ROS level (A). Subsequently, cells were stained with an anti-8-oxoG antibody and analyzed by FCM (B). (C) 8-oxoG is enriched at the regulatory regions of Foxp3 in both iTregs and colonic Tregs. Th0 cells and iTregs were obtained as in legend to (A) and colonic Tregs were isolated from the colon of Foxp3YFP mice. The enrichment of 8-oxoG at the Foxp3 promoter, CNS1 and CNS2 regions was assessed by ChIP using anti-8-oxoG antibody. Primers targeting the Foxp3 coding region were used as a negative control. (D) The cleavage activity of OGG1 decreases in iTregs compared to Th0 cells. Nuclear extracts from cells cultured for 48 h as described to (A) were incubated with 100 fmol 8-oxoG-containing, Cy5-labeled DNA oligos derived from Foxp3 promoter and subjected to an oligonucleotide incision assay. (E) OGG1 is oxidized in iTregs. Naïve CD4+ T cells from 3 × HA-OGG1 mice were cultured as in the legend to (A) for 48 h, then lysed in the presence of DCP-Bio1. Levels of DCP-Bio1-tagged OGG1 were determined by immunoprecipitation followed by western blot analysis. (F and G) NAC treatment decreases ROS and 8-oxoG levels. Naïve CD4+ T cells were cultured as in legend to (A) with TH5487 (10 μM) and/or NAC (1 mM) and assessed by FCM for ROS (F) and 8-oxoG (G) levels. (H) Removal of ROS decreases iTreg differentiation. Cells cultured as in legend to (F) were analyzed for iTreg differentiation by FCM (Left) and quantified (Right). (I) Inhibition of OGG1-8-oxoG interaction suppresses Foxp3 promoter activity. EL4 cells electroporated with pGL-4.2 or pGL-4.2-Foxp3 pro plasmids were treated with TH5487 (10 μM) or SU0268 (10 μM) in the presence of TGFβ1 for 12 h. Foxp3 transcriptional activity was assessed using a dual luciferase reporter assay. (J) Enhanced OGG1 binding to 8-oxoG promotes Foxp3 transcriptional activity. EL4 cells were electrotransfected with pLKO.1-shOgg1 along with pEGFP-N1-OGG1, pEGFP-N1-OGG1K249Q, or pEGFP-N1-OGG1F319A plasmids to generate OGG1 mutant cells, followed by transfected with pGL-4.2-Foxp3 pro plasmids. Foxp3 transcriptional activity was evaluated by dual luciferase assay. (AI) Quantification shows mean ± SD from three (AG and I) or four (H) independent experiments, with significance determined by two-way ANOVA test (A and B) or one-way ANOVA test (CI). *P < 0.05, **P < 0.01, ***P < 0.001, ****P < 0.0001. ns, not significant. (C and D) One representative experiment out of three is shown.
Fig. 4.
Fig. 4.
OGG1 is essential for the recruitment of Smad3 to Foxp3. (A) CUT&RUN analysis showing OGG1 binding at the Foxp3 locus. Naïve CD4+ T cells derived from 3 × HA-OGG1 mice were cultured under iTreg polarization condition for 48 h. CUT&RUN was performed using anti-HA antibody, with IgG as a negative control. OGG1 binding peaks are shown at the Foxp3 promoter, CNS1 and CNS2 regions. Screenshots are from the Integrative Genomics Viewer. (B) OGG1 binds specifically to the promoter and CNS1 of Foxp3. Naïve CD4+ T cells derived from 3 × HA-OGG1 mice were treated with TH5487 (10 μM) or SU0268 (10 μM) and cultured under Th0 or iTreg polarization condition for 48 h. The binding of OGG1 to the promoter and CNS1 of Foxp3 was assessed by ChIP using anti-HA antibody. The primers targeting the Foxp3 coding region were used as a negative control. (C) Inhibition of OGG1 binding to 8-oxoG reduces its interaction with Smad3 in iTregs. Naïve CD4+ T cells from 3 × HA-OGG1 mice were cultured as in legend to (B) with or without TH5487 (10 μM). Co-IP was performed by immunoprecipitating either OGG1 (Left) or Smad3 (Right), followed by western blotting and quantified. IgG served as a negative control. (D) Inhibition of OGG1 binding to 8-oxoG suppresses the recruitment of Smad3 to the Foxp3 promoter and CNS1. Naïve CD4+ T cells were cultured as in legend to (B) and Smad3 binding was assessed by ChIP using an anti-Smad3 antibody. The primers targeting the Foxp3 coding region were used as a negative control. (E) Decreasing ROS levels impairs binding of Smad3 to Foxp3. Naïve CD4+ T cells were treated with TH5487 (10 μM) and/or NAC (1 mM) and cultured under iTreg polarization condition for 48 h. Smad3 binding to the CNS1 of Foxp3 was assessed by ChIP. (F) OGG1 enhances Foxp3 transcriptional activity by recruitment of Smad3. HEK293T cells transfected with pGL-4.2-Foxp3pro, pGL-4.2-Foxp3pro-Mutant 1, pGL-4.2-Foxp3pro-Mutant 2, or pGL-4.2-Foxp3pro-Double Mutant plasmids were treated with TH5487 (10 μM) or SU0268 (10 μM) in the presence of TGFβ1 for 12 h. Foxp3 transcriptional activity was evaluated by dual luciferase report assay. (G) OGG1 directly binds to Smad3. GST-OGG1 protein (20 nM) were incubated with His-Smad3 protein (10, 20, 40 nM) and the interaction was examined by GST-Pulldown and western blotting. (H) OGG1 promotes recruitment of Smad3 to the Foxp3 promoter. GST-OGG1 and/or His-Smad3 were incubated with 100 fmol 8-oxoG-containing, Cy5-labeled DNA oligos derived from the Foxp3 promoter with or without TH5487 (10 μM). Protein/DNA complex formation was analyzed by EMSA. (I and J) Modulation of OGG1 binding to 8-oxoG impacts the recruitment of Smad3 to Foxp3 promoter. GST-OGG1 K249Q (I) or GST-OGG1 F319A (J) and/or His-Smad3 were incubated with 100 fmol 8-oxoG-containing, Cy5-labeled DNA oligos derived from Foxp3 promoter, protein/DNA complexes were analyzed by EMSA. (B, and DG) Quantification shows mean ± SD from three independent experiments. Statistical significance was determined by two-way ANOVA (B, D, F, and G) or one-way ANOVA test (E). *P < 0.05, **P < 0.01, ***P < 0.001, ****P < 0.0001. ns, not significant. (C, and GJ) One representative experiment of three is shown.
Fig. 5.
Fig. 5.
Binding of OGG1 to 8-oxoG in the promoter and CNS2 region accelerates Foxp3 demethylation. (A and B) Inhibition of OGG1 increases the methylation of CpG island in Foxp3 CNS2. Naïve CD4+ T cells were cultured under Th0 or iTreg differentiation conditions with or without TH5487 for 48 h. Equivalent amounts of bisulfite-converted-DNA were analyzed for methylation by methylation-specific PCR (MSP). U: PCR with primers detecting unmethylated DNA; M: PCR with primers detecting methylated DNA (A). Bisulfite sequencing was performed across 10 CpG sites in the Foxp3 CNS2 region. Ten individual clones per sample were analyzed and methylation levels were calculated as the percentage of methylated CpG per clone (B). (C) OGG1 binds to the CpG island in the promoter and CNS2 regions of Foxp3. Naïve CD4+ T cells from 3 × HA-OGG1 mice were treated with TH5487 (10 uM) or SU0268 (10 uM) and cultured as described in (A). OGG1 binding was evaluated by ChIP assays. The primers targeting the Foxp3 coding region were used as a negative control. (D) Inhibition of OGG1 binding to 8-oxoG impairs its interaction with Tet1/Tet2. Naïve CD4+ T cells from 3 × HA-OGG1 mice were cultured as in the legend to (A), and 3 × HA-OGG1 were immunoprecipitated followed by western blotting analysis. IgG served as a negative control. (EG) Inhibition of OGG1 binding to 8-oxoG reduces the recruitment of Tet1/2 and enhances the occupation of Dnmt1 to Foxp3. Cells were prepared as described in (A). Tet1 binding to the Foxp3 promoter and CNS2 region was evaluated by ChIP (E). The primers targeting the Foxp3 coding region were used as a negative control. The binding of Tet2 to the promoter of Foxp3 was evaluated by ChIP (F). The binding of Dnmt1 to the promoter and CNS2 of Foxp3 was analyzed by ChIP (G). (H) Decreasing ROS levels improves the recruitment of Dnmt1 to Foxp3. Naive CD4+ T cells were treated with NAC (1 mM) and/or TH5487 (10 μM) and cultured as in legend to (A). Dnmt1 binding to the promoter and CNS2 of Foxp3 was analyzed by ChIP assays. (I and J) 5mC on the same strand of 8-oxoG increases OGG1 occupancy on Foxp3 and suppresses its cleavage activity. GST-OGG1 was incubated with 100 fmol 8-oxoG-containing, Cy5-labeled oligos derived from Foxp3 promoter, including C8-oxoG/GC, 5mC8-oxoG/GC, or 5mC8-oxoG/G5mC. Protein/DNA complexes were visualized by EMSA (I). Cleavage activity was analyzed by oligonucleotide incision assay (J). (K and L) The binding of OGG1 to 8-oxoG improves recruitment of Tet2 and inhibits Dnmt1 occupancy at Foxp3. GST-OGG1 and/or His-Tet2 (K) or His-Dnmt1(L) were incubated with 100 fmol 8-oxoG and 5mC containing DNA oligos derived from Foxp3 promoter (5mC8-oxoG/G5mC) (K) or (5mC8-oxoG/GC) (L) in the absence or presence of TH5487 (10 μM). Formation of protein/DNA complexes was assessed by EMSA. (A, C, and EJ) Quantification shows mean ± SD from three independent experiments. Statistical significance was determined by one-way ANOVA (A) or two-way ANOVA test (C, and EJ). *P < 0.05, **P < 0.01, ***P < 0.001, ****P < 0.0001. ns, not significant. (A, B, D, and IL) One representative experiment of three is shown.
Fig. 6.
Fig. 6.
OGG1 S326C variant is more potent to activate Foxp3 transcription and enhance iTreg differentiation. (A) The OGG1 S326C variant plays a protective role in mouse models of IBD. OGG1326S or OGG1326C mice were treated with or without 2% DSS in DW, and the body weight loss was recorded daily. (B and C) The OGG1 S326C variant promotes iTreg differentiation and enhances the transcription of Foxp3 and Tgfb1. Naïve CD4+ T cells from OGG1326S or OGG1326C mice were cultured under Th0 or iTreg polarization conditions for three days. CD4+CD25+Foxp3+ iTregs were analyzed by FCM (Left) and quantified (Right) (B). Total RNA was isolated at the indicated point for qPCR analysis of Foxp3 and Tgfb1 mRNA levels (C). (D) The OGG1 S326C variant enhances the transcriptional activity of the Foxp3 promoter. HEK293T cells transfected with pLKO.1-shOgg1 along with pEGFP-N1-OGG1 326S or pEGFP-N1-OGG1 326C plasmids to generate cells expressing the OGG1 variant. Cells were then transfected with pGL-4.2-Foxp3 pro or pGL-4.2-Foxp3 pro-Double Mutant plasmids. Foxp3 transcriptional activity was evaluated by dual luciferase report assay. (E and F) The S326C mutant enhances OGG1-mediated recruitment of Smad3. Cells cultured as described in (B) for 48 h and Smad3 binding to the Foxp3 promoter and CNS1 was analyzed by ChIP (E). The primers targeting the Foxp3 coding region were used as a negative control. GST-OGG1, GST-OGG1 S326C, and/or His-Smad3 were incubated with 100 fmol 8-oxoG-containing, Cy5-labeled DNA oligos derived from Foxp3 promoter. Protein–DNA complex formation was analyzed by EMSA (F). (G and H) The OGG1 S326C variant increases Tet2 recruitment and decreases Dnmt1 occupancy at Foxp3. Cells were cultured as described in (B) for 48 h and the binding of Tet2 (G) and Dmnt1 (H) to Foxp3 promoter and CNS2 was evaluated by ChIP. The primers targeting the Foxp3 coding region were used as a negative control. (A) Data represent mean ± SD (n = 4), with significance determined by two-way ANOVA test. Quantification shows mean ± SD from three independent experiments. Statistical significance was determined by the t test (B) or two-way ANOVA test (CE, G, and H). *P < 0.05, **P < 0.01, ***P < 0.001, ****P < 0.0001. ns, not significant. (F) One representative experiment out of three is shown.
Fig. 7.
Fig. 7.
OGG1 inhibitor O8 enhances Foxp3 transcription and promotes iTreg differentiation. (A) O8 promotes iTreg differentiation. Naïve CD4+ T cells were cultured in Th0 or iTreg (with 0.5 ng/mL TGFβ1) polarization conditions with increasing concentrations of O8. CD4+CD25+Foxp3+ iTregs were analyzed by FCM (Left) and quantified (Right). (B) O8 upregulates the transcription of Foxp3. Cells treated with O8 (10 μM) were cultured as described in (A), and cDNA was analyzed for Foxp3 mRNA expression. (C) O8 increases the transcriptional activity of the Foxp3 promoter. HEK293T cells transfected with pGL-4.2-Foxp3 pro or pGL-4.2-Foxp3 pro-Double Mutant plasmids were treated with or without O8 (10 μM). Foxp3 transcriptional activity was evaluated by dual luciferase reporter assay. (D and E) O8 augments the transcription of Foxp3 and increases human iTreg differentiation. Naive CD4+ T cells isolated from human peripheral blood were cultured under iTreg polarization condition (with 0.5 ng/mL TGFβ1). CD4+CD25+Foxp3+ iTregs were analyzed by FCM (Left) and quantified (Right) (D). Foxp3 mRNA levels were analyzed by qPCR (E). (F) O8 increases the interaction between OGG1 and Smad3. Naïve CD4+ T cells derived from 3 × HA-OGG1 mice were treated with O8 and cultured as described in (B) for 48 h. Cells were lysed and OGG1 (Left) or Smad3 (Right) were immunoprecipitated and analyzed by western blotting. IgG served as a negative control. (G) O8 enhances Smad3 binding to the Foxp3 promoter and CNS1. Naïve CD4+ T cells treated with O8 were cultured as described in (B) for 48 h and Smad3 binding was evaluated by ChIP using anti-Smad3 antibody. The primers targeting the Foxp3 coding region were used as a negative control. (H) O8 promotes colocalization of OGG1 and Smad3 at the promoter and CNS1 of Foxp3. Cells prepared as described in (F) were analyzed by Re-ChIP using anti-HA and anti-Smad3 antibodies. The primers targeting the Foxp3 coding region were used as a negative control. (I) Decrease in ROS levels abolish the effect of O8 on recruitment of Smad3 to Foxp3. Cells treated with O8 (10 uM) and/or NAC (1 mM) were cultured as described in (B) for 48 h and ChIP was performed using an anti-Smad3 antibody. (J) O8 enhances the ability of OGG1 in recruiting Smad3 to Foxp3. GST-OGG1 and/or His-Smad3 were incubated with 100 fmol 8-oxoG-containing Cy5-labeled DNA oligos derived from Foxp3 promoter in the absence/presence of O8 (10 µM). Protein- DNA complex formation was analyzed by EMSA. (K and L) O8 increases Tet2 recruitment and reduces Dnmt1 binding to Foxp3. Cells were cultured as described in (B) for 48 h and the binding of Tet2 (K) or Dnmt1 (L) to the promoter and CNS2 of Foxp3 were analyzed by ChIP. (AE, GI, K, and L) Quantification shows mean ± SD from three independent experiments, Statistical significance was determined by one-way ANOVA (A and I), two-way ANOVA (B, C, G, H, K, and L), or unpaired t test (D and E). *P < 0.05, **P < 0.01, ***P < 0.001, ****P < 0.0001. ns, not significant. (F and J) One representative experiment out of three is shown.
Fig. 8.
Fig. 8.
OGG1 inhibitor O8 alleviates colitis in the mouse model of IBD. (AE) O8 alleviates DSS-induced mouse IBD. Mice were administered DSS (2%, w/v) in DDW. Simultaneously, OGG1 inhibitor (O8, 20 mg/kg) was administered via intraperitoneal injection every other day; solvent (DMSO) served as the negative control. After 7 d, Tregs in colonic lamina propria were analyzed by FCM (A). Body weight (B) and DAI scores (C)—based on body weight loss, stool consistency, and blood in the stool—were recorded daily. On day 7, colons were harvested for length assessment (D) and histopathological analysis after hematoxylin and eosin (H and E) staining (E). (Scale bar, 200 μm.) (F) Injection of O8 reduces plasma IL-5 levels. IL-5 levels in plasma were assayed using an ELISA kit. (GJ) Evaluation of colitis in mice, adoptively transferred with different cells. Body weight (G) and DAI scores (H) were recorded weekly. After 7 wk, colons were collected for length assessment (I) and histologically analyzed after H&E staining (J). (Scale bar, 200 mm.) (E and J) One representative experiment from four biological replicas is shown. (AD, and FI) Data are represented as mean ± SD (n = 4), with significance determined by one-way ANOVA test (A, D, F, and H) or two-way ANOVA test (B, C, G, and H). *P < 0.05, **P < 0.01, ***P < 0.001, ****P < 0.0001.

Similar articles

References

    1. Kasai H., et al. , Formation of 8-hydroxyguanine moiety in cellular DNA by agents producing oxygen radicals and evidence for its repair. Carcinogenesis 7, 1849–1851 (1986). - PubMed
    1. Neeley W. L., Essigmann J. M., Mechanisms of formation, genotoxicity, and mutation of guanine oxidation products. Chem. Res. Toxicol. 19, 491–505 (2006). - PubMed
    1. Svilar D., Goellner E. M., Almeida K. H., Sobol R. W., Base excision repair and lesion-dependent subpathways for repair of oxidative DNA damage. Antioxid. Redox Signal. 14, 2491–2507 (2011). - PMC - PubMed
    1. Audebert M., Radicella J. P., Dizdaroglu M., Effect of single mutations in the OGG1 gene found in human tumors on the substrate specificity of the Ogg1 protein. Nucleic Acids Res. 28, 2672–2678 (2000). - PMC - PubMed
    1. Hao W., et al. , Enzymatically inactive OGG1 binds to DNA and steers base excision repair toward gene transcription. FASEB J. 34, 7427–7441 (2020). - PMC - PubMed

MeSH terms

LinkOut - more resources