. 2025 Jul 29;122(30):e2501167122.
doi: 10.1073/pnas.2501167122. Epub 2025 Jul 22.

Central memory T cells with key TCR repertoires and gene expression profiles dominate influenza CD8+ T cell pools across the human lifespan

Affiliations

Central memory T cells with key TCR repertoires and gene expression profiles dominate influenza CD8+ T cell pools across the human lifespan

Tejas Menon et al. Proc Natl Acad Sci U S A. .

Abstract

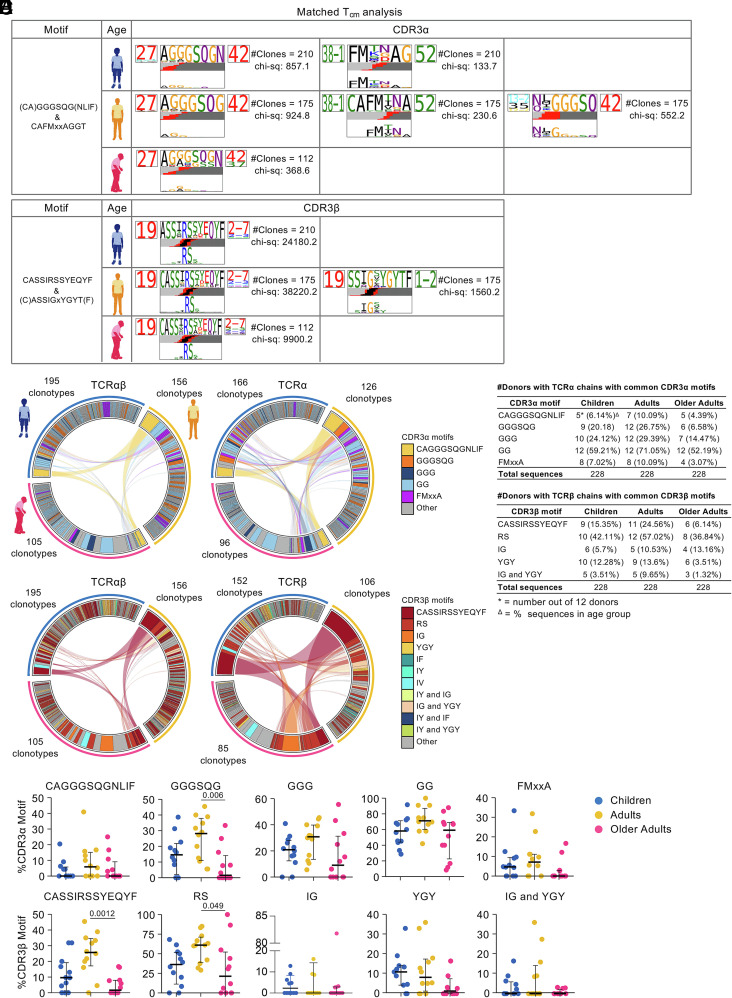
Central memory CD8+ T cells (Tcm) represent the prominent memory T cell subset in human blood, yet the persistence of T cell receptor (TCR) clonotypic and transcriptional features of epitope-specific Tcm pools across the human lifespan remains unknown. We analyzed Tcm CD8+ T cells specific for HLA-A*02:01-M158-66 (A2/M158; a prominent influenza epitope) in newborns, children, adults, and older adults directly ex vivo. Our data provide evidence that epitope-specific Tcm CD8+ pools dominate influenza-specific memory A2/M158+CD8+ T cell responses from the early childhood until old age. Tcm gene signatures were largely maintained across the age groups, although self-renewal genes defined Tcm pools in children, while older adult Tcm A2/M158+CD8+ T cells displayed detoxication and stress profiles. TCRαβ diversity within Tcm A2/M158+CD8+ T cell pools was greater in children and older adults, when compared to adults. The key public-associated TCRαβ clonotypes largely persisted across the human lifespan, although their highest frequency was detected in adults, reflecting lower TCRαβ diversity in this group. Older adults displayed increased TCRαβ heterogeneity, underpinned by large TCRαβ clonotype expansions of private TCRαβ clonotypes. Our study highlights the importance of largely preserved virus-specific Tcm pools across the human lifespan and advocates for boosting persistent TCRαβ clonotypes within this key peripheral blood subset.

Keywords: T cell receptors; central memory; human lifespan; influenza-specific T cells; memory T cells.


Conflict of interest statement

Competing interests statement:H.A.M. consults for Ena Respiratory.

Figures

Fig. 1.
Fig. 1.
Central memory T cells dominate influenza-specific CD8+ T cells across the human lifespan. (A) Age of HLA-A*02:01-expressing newborns, children, adults, and older adults. (B) Representative FACS plots of enriched tetramer-specific A2/M158+CD8+ T cells and frequencies of total A2/M158+CD8+ T cells. (C) Representative FACS plots of A2/M158+CD8+ Tcm-like (CD27+CD45RA) cells, Tem-like (CD27CD45RA), Temra-like (CD27-CD45RA+), Tnaive-like (CD27+CD45RA+CD95), Tscm-like (CD27+CD45RA+CD95+) cells. Gray dots represent total CD8+ T cells in unenriched samples, red dots A2/M158+CD8+ T cells in enriched samples. Gating across age groups shown in SI Appendix, Fig. S1B. (D) Stacked bar plots of memory phenotype proportion across age groups. Statistical significance was determined with two-way ANOVA with a two-sided Tukey’s test for multiple comparisons. (E) Frequency of Tcm A2/M158+CD8+ T cells across age. (F) Correlation of the frequency of total A2/M158+CD8+ T cells and frequency of A2/M158+CD8+ Tcm-like cells using Spearman’s rank correlation (Rs) (n = 10; Newborns, n = 12; Children, n = 30; Adults, n = 22; Older Adults). (G) Principal Component Analysis of scRNASeq data of donors. Each dot represents a donor and is colored by age group. (H) Bubble plot of differentially expressed genes (DEG) from A2/M158+CD8+ Tcm from children, adults, and older adults. DEGs were identified by pairwise comparison with a two-side hurdle model (MAST) without correction for multiple comparison (P < 0.05). (I) Pairwise volcano plots of DEGs in A2/M158+CD8+ Tcm in children, adults, and older adults. Significant genes were those with |Log2(fold change)| >0.3 and P-value <0.05. (A and C) A2/M158+CD8+ Tcm frequencies of 0 are plotted as 10−7. Donors with <10 total A2/M158+CD8+ T cell counts were excluded from phenotypic analysis.
Fig. 2.
Fig. 2.
TCRαβ repertoire of Tcm A2/M158+CD8+ T cells in children, adults, and older adults. (A) TCR diversity of matched paired TCRαβ-chains, TCRα, and TCRβ measured by TCRdiv. (B) Neighbor distance distribution smoothed density profiles of for each age group. More clustered A2/M158+CD8+ Tcm TCRαβ, TCRα, or TCRβ repertoire are indicated by lower distribution peaks, average distance values are depicted within the plot for each age group. PDF, probability density function. (C) 2D-kernel principal component analysis (PCA) projection of the paired A2/M158+CD8+ Tcm TCR landscape split by age group. Clone size indicated by symbol size; TRAV and TRBV gene usage indicated by color. Numbers of paired TCRαβ sequences in each plot is displayed on the Top Left. Red circles were manually drawn to indicate regions of interest. (D) Circos plots of TRAV and TRBV clonotype pairing per age group. Outer arch segment colored by TRAV and TRBV usage. TRAV–TRBV gene pairing indicated by connecting lines which are colored based on their TRAV usage and segmented based on their CRD3α and CDR3β sequence. The thickness is proportional to TCR clone number with the respective pair. The number at the right bottom of the circos plot indicated the number of sequences considered. (E) Proportion of sequences expressing TRAV27-TRRBV19, TRAV27, TRBV19, TRAV38-1, or TRBV27. Bars represent median and interquartile range. A two-sided Kruskal–Wallis with Dunn’s test for multiple comparisons was used to determine statistical significance. (F) Gene segment landscapes, V- and J-segments usage indicated by vertical stacks, colored by frequency within the TCR repertoire. Curved paths indicate gene–gene pairing and the thickness is proportional to the number of paired TCR clone. Arrows indicate enrichment of gene segments relative to background frequencies; each arrowhead indicates twofold enrichment.
Fig. 3.
Fig. 3.
CDR3αβ motifs of Tcm A2/M158+CD8+ Tcm across age groups. (A) Top-scoring logo representations of matched paired A2/M158+CD8+ Tcm CDR3α and CDR3β sequence motifs across age groups. Each logo shows the V (Left side) and J (Right side) gene frequencies with CDR3 amino acid sequences in the middle with the full height (Top). To highlight motif positions under selection, CDR3 amino acid sequences are scaled by per-residue reparative entropy to background frequencies derived from TCRs with matching gene-segment composition at the Bottom. The inferred rearrangement structure by source region (light gray for V-region, dark gray for J, black for D, and red for N insertions) of grouped receptors is shown in the middle. (B) Frequency of common CDR3αβ motifs within paired A2/M158+CD8+ Tcm TCR repertoires across age. Connecting lines represent paired TCRαβ (Left), TCRα (Top Right), or TCRβ-chains (Bottom Right) shared between age groups. Plots are colored by CDR3α motif (Top row) or CDR3β (Bottom row). (C) Proportion of common CDR3α motifs or (D) CDR3β motifs across children, adults, older adults. A two-sided Kruskal–Wallis with Dunn’s test was used to establish statistical significance for multiple comparisons. (E) Number of donors across age group expressing common CDR3αβ motifs. The percentage of sequences expressing these motifs in each age group is in parentheses.
Fig. 4.
Fig. 4.
Sharing of public and private clonotypes between memory subsets across age groups. (A) Proportion of TCRs shared with another phenotype subset across groups. Statistical significance was established using a two-sided Kruskal–Wallis with Dunn’s test for multiple comparisons. (B) Frequency of high-prevalent (>1 similar TCR within a single individual) public (shared) and private (not shared) clonotypes across different phenotypes per age groups. Connecting lines represent paired TCRαβ-chains shared between phenotype subset. Public clonotypes are colored in red, orange, and yellow, private clonotypes in blue. The high-prevalent public TCR (TRAV27, TRAJ42, CDR3α-GAGGGSQGNLIF, TRBV19, TRBV2–7, and CDR3β CASSIRSSYEQYF) is depicted in dark red, whereas clonotypes expressing the full public TCRβ chain (TRBV19, TRBV2–7, and CDR3β-CASSIRSSYEQYF) with an unidentified TCRα-chain are depicted in light red. Each plot represents an age group. The fraction of public (red) or private (blue) TCRαβ clonotypes shared across phenotypes out of the total number of public or private TCRαβ clonotypes are shown on the Bottom Right. (C) Frequency of common CDR3αβ motifs across different phenotypes per age group. Connecting lines represent paired TCRαβ-chains shared between each memory subset. Plots are colored by CDR3α (Top) or CDR3β (Bottom) motifs. Each plot represents an age group. (D) SDI of paired TCRαβ-chains comparing memory subsets within each age group. Statistical significance was established using a two-sided Kruskal–Wallis with Dunn’s test for multiple comparisons.

Similar articles

References

    1. Wang Z., et al. , Recovery from severe H7N9 disease is associated with diverse response mechanisms dominated by CD8+ T cells. Nat. Commun. 6, 6833 (2015). - PMC - PubMed
    1. Sridhar S., et al. , Cellular immune correlates of protection against symptomatic pandemic influenza. Nat. Med. 19, 1305–1312 (2013). - PubMed
    1. Tan A. T., et al. , Early induction of functional SARS-CoV-2-specific T cells associates with rapid viral clearance and mild disease in COVID-19 patients. Cell Rep. 34, 108728 (2021). - PMC - PubMed
    1. Bresser K., et al. , Replicative history marks transcriptional and functional disparity in the CD8+ T cell memory pool. Nat. Immunol. 23, 791–801 (2022). - PMC - PubMed
    1. Hamann D., et al. , Phenotypic and functional separation of memory and effector human CD8+ T cells. J. Exp. Med. 186, 1407–1418 (1997). - PMC - PubMed

MeSH terms

Substances

LinkOut - more resources