. 2025 Jul 22:13:RP98662.
doi: 10.7554/eLife.98662.

Photoreceptor loss does not recruit neutrophils despite strong microglial activation

Affiliations

Photoreceptor loss does not recruit neutrophils despite strong microglial activation

Derek Power et al. Elife. .

Abstract

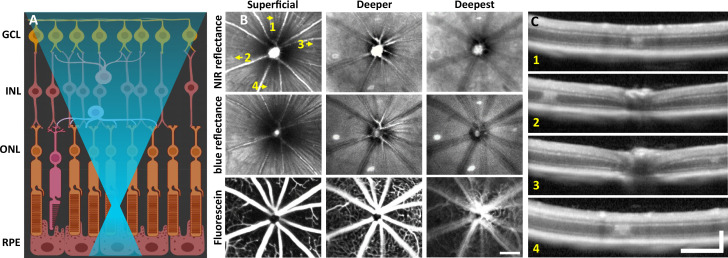
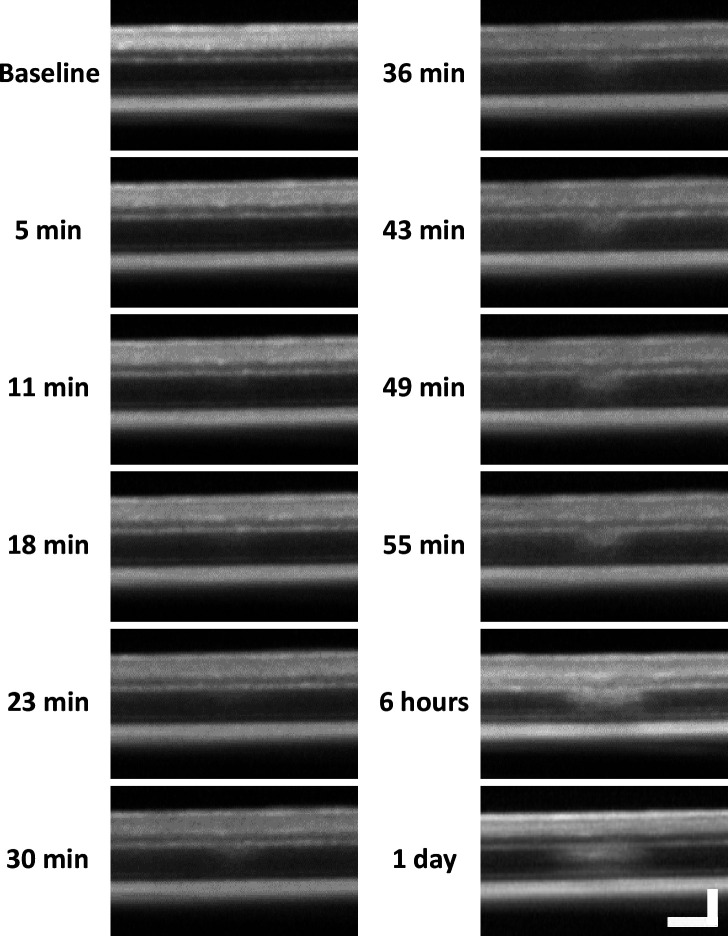
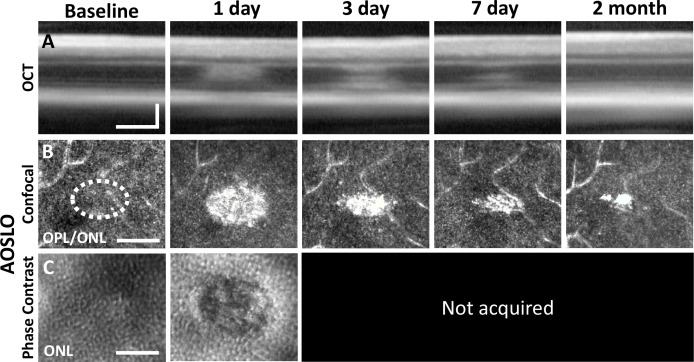
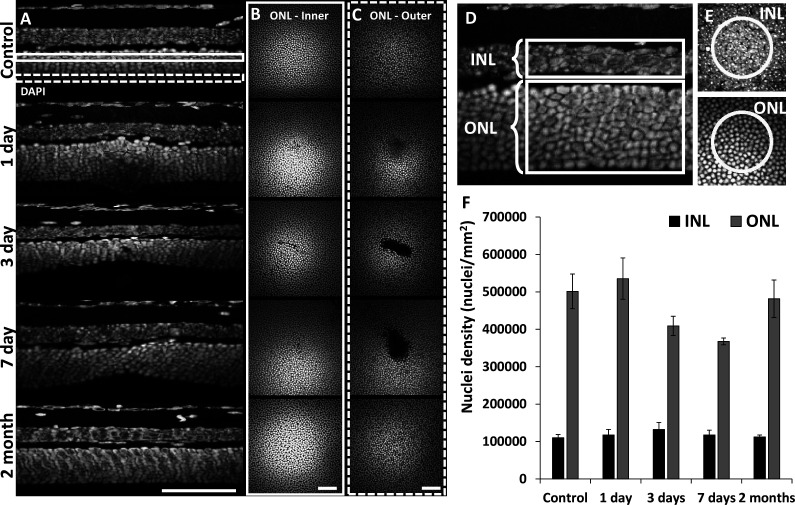
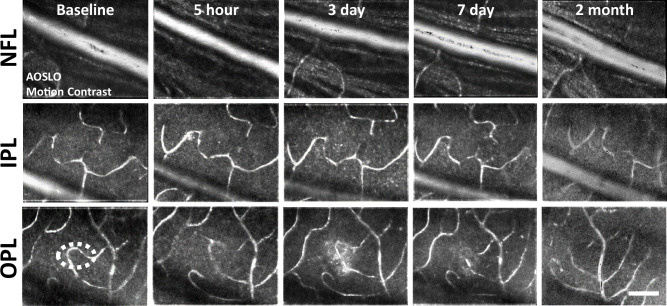
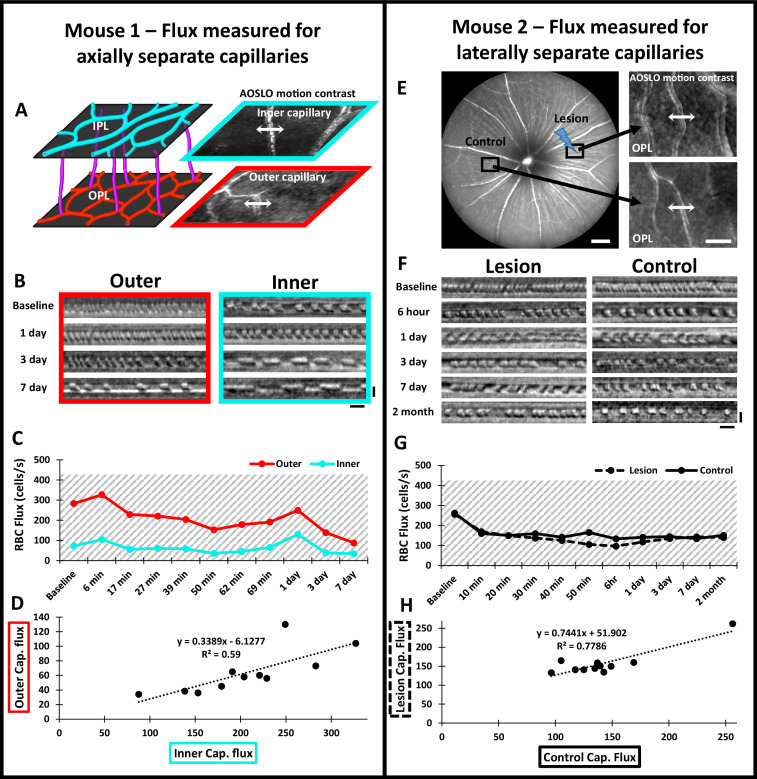
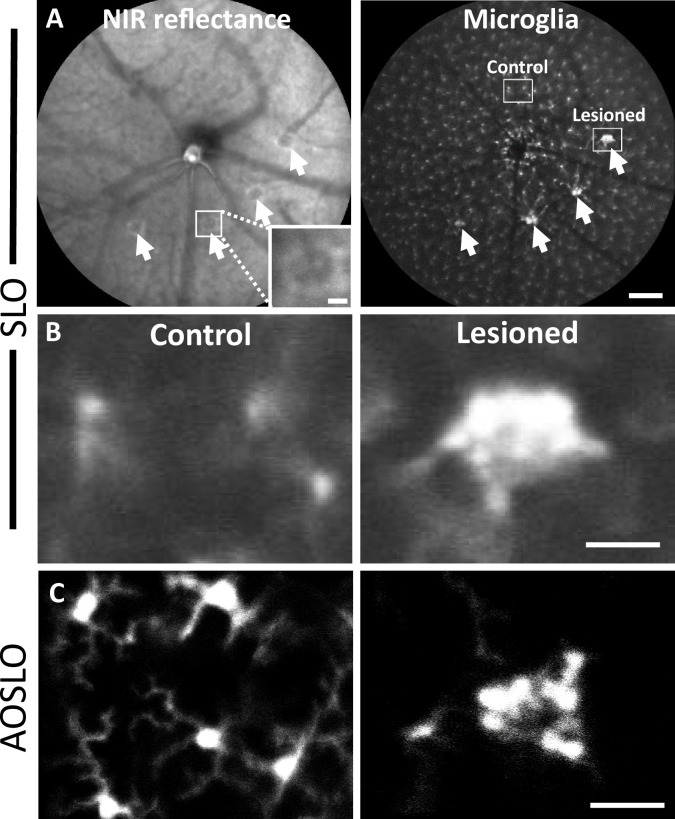
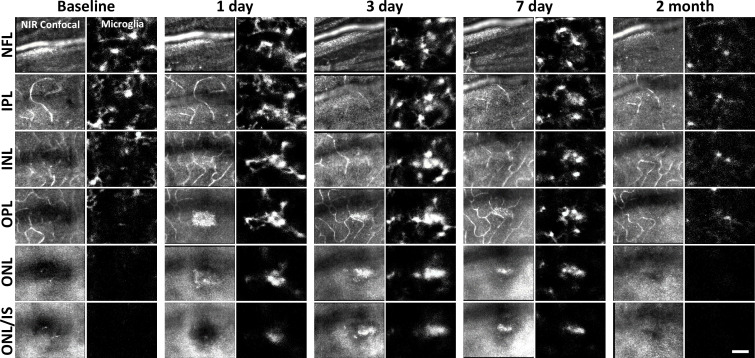
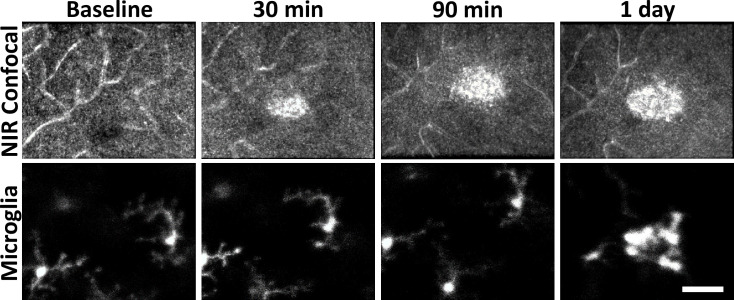
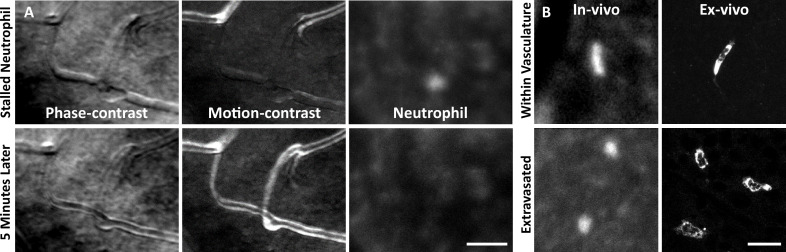
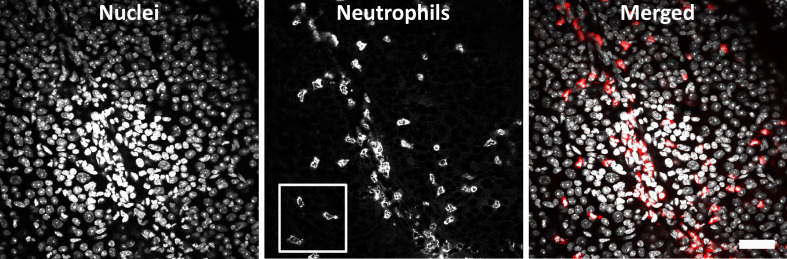
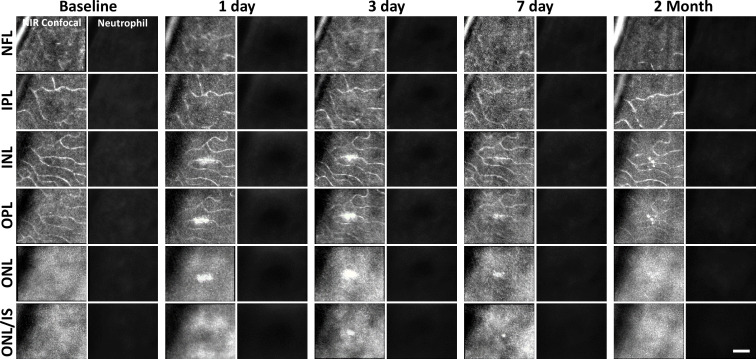
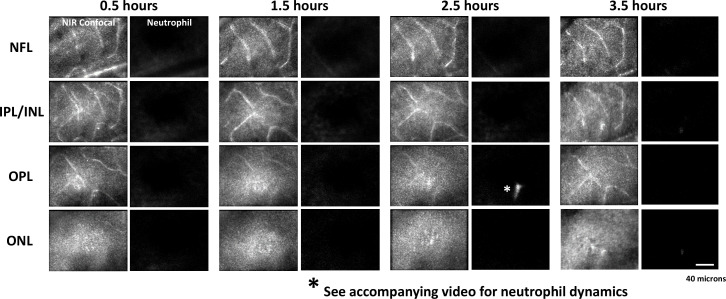
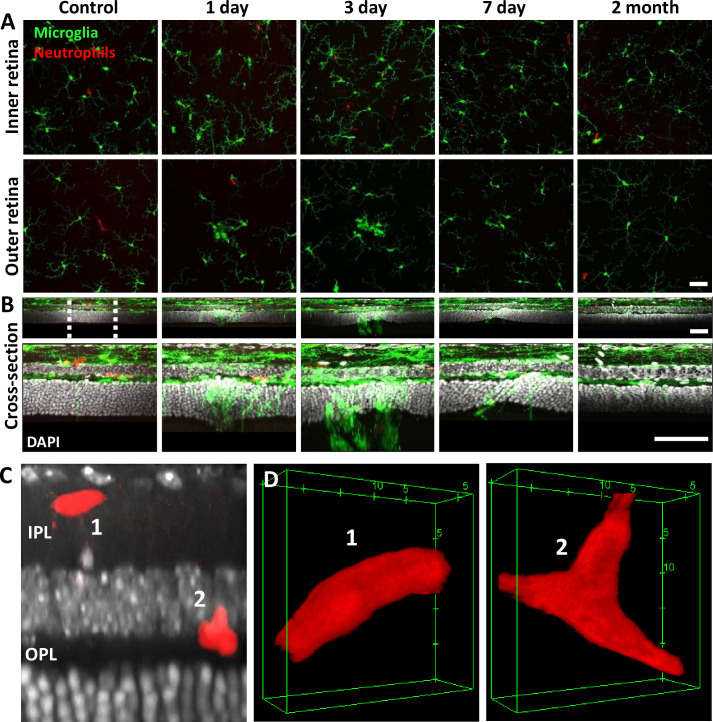
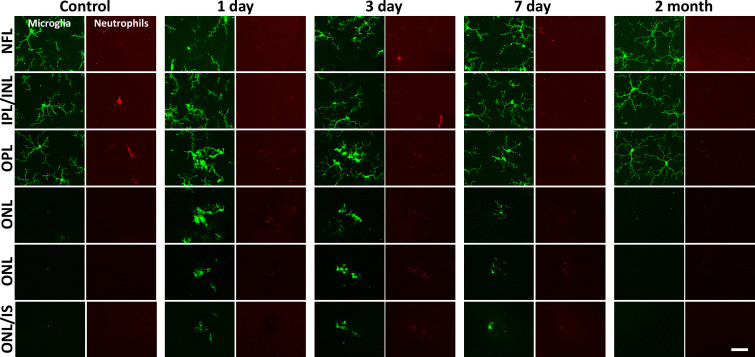
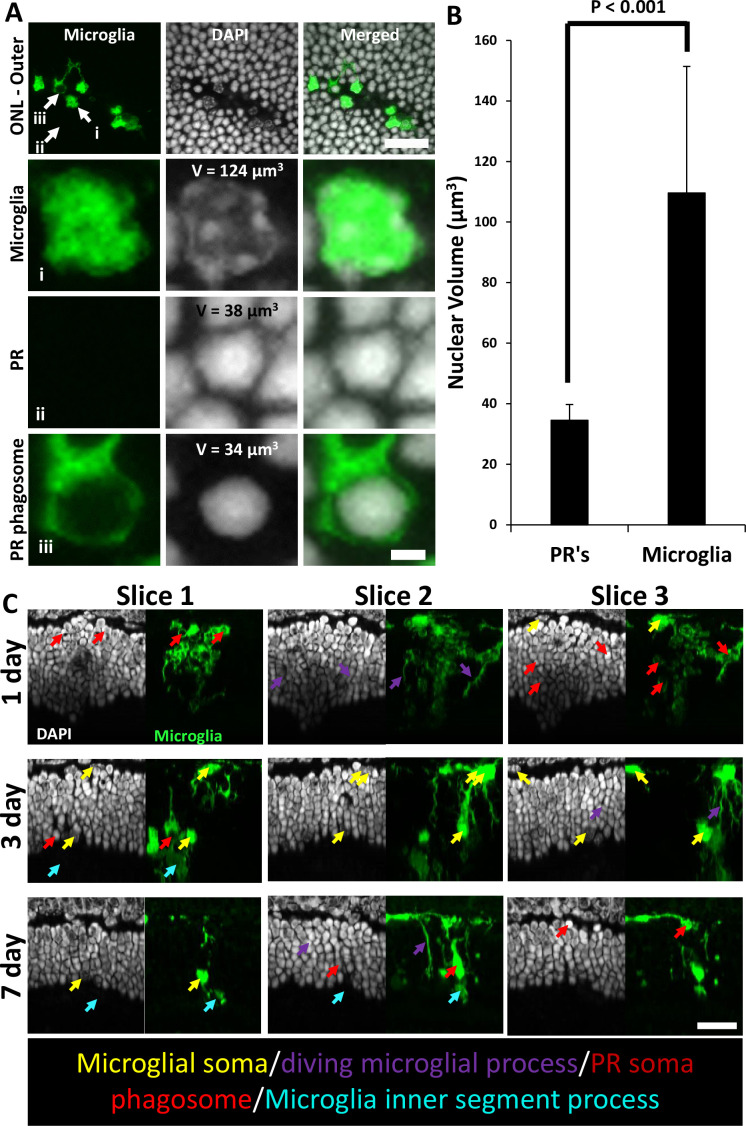
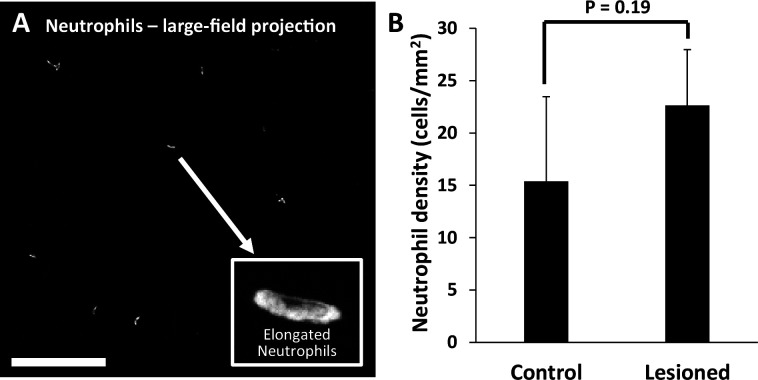
In response to central nervous system (CNS) injury, tissue-resident immune cells such as microglia and circulating systemic neutrophils are often first responders. The degree to which these cells interact in response to CNS damage is poorly understood, and even less so, in the neural retina, which poses a challenge for high-resolution imaging in vivo. In this study, we deploy fluorescence adaptive optics scanning light ophthalmoscopy (AOSLO) to study microglia and neutrophils in mice. We simultaneously track immune cell dynamics using label-free phase-contrast AOSLO at micron-level resolution. Retinal lesions were induced with 488 nm light focused onto photoreceptor (PR) outer segments. These lesions focally ablated PRs, with minimal collateral damage to cells above and below the plane of focus. We used in vivo AOSLO, and optical coherence tomography (OCT) imaging to reveal the natural history of the microglial and neutrophil response from minutes to months after injury. While microglia showed dynamic and progressive immune response with cells migrating into the injury locus within 1 day after injury, neutrophils were not recruited despite close proximity to vessels carrying neutrophils only microns away. Post-mortem confocal microscopy confirmed in vivo findings. This work illustrates that microglial activation does not recruit neutrophils in response to acute, focal loss of PRs, a condition encountered in many retinal diseases.

Keywords: adaptive optics; adaptive optics scanning laser ophthalmoscope; age-related macular degeneration; immunology; inflammation; leukocytes; mouse; neuroscience; scanning laser ophthalmoscopy; uveitis.


Conflict of interest statement

DP, JS financial support from Genentech, Inc, JE is affiliated with Genentech, Inc

Figures

Figure 1.
Figure 1.. Laser injury assessed with commercial scanning light ophthalmoscopy (SLO) and optical coherence tomography (OCT).
(A) 488 nm light is focused onto the photoreceptor outer segments using adaptive optics scanning light ophthalmoscopy (AOSLO). Created with BioRender.com. (B) 30° SLO images of near-infrared (NIR) reflectance, blue reflectance, and fluorescein angiography of a mouse retina 1 day after laser exposure. Three focal planes are shown. NIR and blue reflectance reveal small hyperreflective regions below the superficial plane. Fluorescein reveals intact vasculature with no sign of leakage. Arrows indicate regions with imparted laser damage (1–4). (C) OCT B-scans passing through laser-exposed regions indicated in (B). Exposures produced a focal hyperreflective band within the outer nuclear layer (ONL) with adjacent retina appearing healthy. OCT images were spatially averaged (~30 µm, three B-scans). Scale bars = 200 µm horizontal, 200 µm vertical.
Figure 1—figure supplement 1.
Figure 1—figure supplement 1.. Lesion location tracked from minutes to 1 day with optical coherence tomography (OCT).
After baseline OCT acquisition, OCT was performed every 5–7 minutes for 1 hour after 488 nm light exposure. 6-hour and 1-day time points were subsequently acquired. A band of hyperreflectivity forms near the outer plexiform layer (OPL)/outer nuclear layer (ONL) interface within 30 minutes of 488 nm light exposure. Hyperreflective band spreads deeper into the ONL within ~1 hour. OCT images were spatially averaged (~30 µm, eight B-scans). Scale bar = 40 µm horizontal, 100 µm vertical.
Figure 2.
Figure 2.. Laser damage temporally tracked with adaptive optics scanning light ophthalmoscopy (AOSLO) and optical coherence tomography (OCT).
Laser-exposed retina was tracked with OCT (A), confocal (B), and phase-contrast (C) AOSLO for baseline, 1-, 3-, 7-day, and 2-month time points. OCT and confocal AOSLO display a hyperreflective phenotype that was largest/brightest at 1 day and became nearly invisible by 2 months. Dashed oval indicates region targeted for laser injury. Phase-contrast AOSLO revealed disrupted photoreceptor soma 1 day after laser injury. Phase-contrast data was not acquired for remaining time points due to the development of cataract, which obscured the phase-contrast signal. OCT images were spatially averaged (~30 µm, eight B-scans). Scale bars = 40 µm horizontal, 100 µm vertical.
Figure 3.
Figure 3.. Retinal histology confirms photoreceptor ablation and preservation of inner retinal cells.
Cross-sectional view (A) and en-face (B, C) images of DAPI-stained whole-mount retinas at laser injury locations over time. By 1 day, outer nuclear layer (ONL) becomes thicker at the lesion location, but thinner by 3 and 7 days. By 2 months, the ONL appeared similar to that of control. The inner (B, solid rectangle) and outer (C, dashed rectangle) stratum of ONL show axial differences in ONL loss. Most cell loss was seen in the outer aspect of the ONL (C). Scale bars = 40 µm. (D) Cross-section of DAPI-stained retina displaying inner nuclear layer (INL) and ONL regions for quantification. Each analysis region was 50 µm across and encompassed the entire depth of the INL or ONL. (E) En-face images show 50 µm diameter circles used for analysis. (F) Nuclei density for post-injury time points. ONL nuclei were reduced at 3 and 7 days (p=0.17 and 0.07, respectively) while INL density remained stable (n=10 mice, three unique regions per time point). Error bars display mean ± 1 SD.
Figure 4.
Figure 4.. Motion-contrast images reveal vascular perfusion status in response to laser damage.
A single location was tracked over time at three vascular plexuses using adaptive optics scanning light ophthalmoscopy (AOSLO). Retinal vasculature remained perfused for all time points tracked and at all depths. White oval indicates damage location. Scale bar = 40 µm.
Figure 4—figure supplement 1.
Figure 4—figure supplement 1.. Measurement of single-cell blood flux after laser damage using phase-contrast adaptive optics scanning light ophthalmoscopy (AOSLO).
Mouse 1: (A) the vascular plexus corresponding to inner plexiform layer (IPL) (cyan) and outer plexiform layers (OPL) (red) was targeted for flux determination. Blood cell flux was measured for two capillaries within the same field, at different depths. Arrows show the location for repeated line scan acquisitions. Created with BioRender.com. (B) RBC flux images acquired up to 7 days post-damage. Scale bars = 10 ms horizontal, 5 µm vertical. (C) Capillary flux quantified over 7 days. Despite the outer capillary displaying higher flux, both inner and outer capillaries changed synchronously for each time point. (D) Correlation of inner and outer capillary flux. Linear regression model displays a weak positive correlation (black dotted line). Mouse 2: (E) Left: representative 55° scanning light ophthalmoscopy (SLO) image showing regions targeted for capillary flux measurement. One region was subject to 488 nm laser damage and the other was left unlasered (Control). Scale bar = 200 µm. Right: capillaries targeted for blood cell flux measurement. Arrows show the location for repeated line scan acquisitions. Scale bar = 40 µm. (F) RBC flux images acquired up to 2 months post-damage. Scale bars = 10 ms horizontal, 5 µm vertical. (G) Capillary flux quantified over 2 months. Flux remained similar at lesion and control locations for all time points assessed. Gray shaded regions indicate the range for normal capillary flux in the healthy C57BL/6J mouse (Dholakia et al., 2022). (H) Correlation of flux in lesion and control locations. Linear regression model displays a positive correlation (black dotted line).
Figure 5.
Figure 5.. Microglial response 1 day after laser injury imaged in vivo with fluorescence scanning light ophthalmoscopy (SLO) and adaptive optics scanning light ophthalmoscopy (AOSLO).
(A) Left: deep-focus near-infrared (NIR) SLO fundus image (55° FOV) of laser-injured retina. White arrowheads point to damaged locations showing hyperreflective regions. Inset scale bar = 40 µm. Right: fluorescence fundus image from same location. Fluorescent CX3CR1-GFP microglia are distributed across the retina and show congregations at laser-damaged locations. Scale bar = 200 µm. (B) Magnified SLO images of microglia at laser-damaged and control locations (indicated in A, right, white boxes). Control location displays distributed microglial, whereas microglia at the lesion location are bright and focally aggregated. (C) Fluorescence AOSLO images show greater detail of cell morphology at the same scale. In control locations, microglia showed ramified morphology and distributed concentration, whereas damage locations revealed dense aggregation of many microglia that display less ramification. Scale bars = 40 µm.
Figure 6.
Figure 6.. Microglial response to laser injury tracked with adaptive optics scanning light ophthalmoscopy (AOSLO).
Simultaneously acquired near-infrared (NIR) confocal and fluorescence AOSLO images across different retinal depths. Data are from one CX3CR1-GFP mouse tracked for 2 months. Microglia swarm to hyperreflective locations within 1 day. Microglia maintain an aggregated density for days and resolve by 2 months after damage. Scale bar = 40 µm.
Figure 6—figure supplement 1.
Figure 6—figure supplement 1.. Hyperreflective appearance emerges before microglia swarm to damage location.
Adaptive optics scanning light ophthalmoscopy (AOSLO) confocal and fluorescence images were acquired for baseline, 30, 90 minutes and 1 day post-laser exposure. The hyperreflective phenotype appeared within 30 minutes but microglia were not found to aggregate until 1 day post-damage. Scale bar = 40 µm.
Figure 7.
Figure 7.. Neutrophil morphology imaged in vivo using adaptive optics scanning light ophthalmoscopy (AOSLO).
(A) Phase-contrast, motion-contrast, and fluorescence AOSLO reveal the impact of passing neutrophils on single capillaries. A rare and exemplary event shows a neutrophil transiently impeding capillary blood flow for minutes in healthy retina. Scale bar = 40 µm. (B) In vivo AOSLO and ex vivo fluorescence microscopy show neutrophils in two states. Neutrophils within capillaries displayed elongated, tubular morphology. Extravasated neutrophils were more spherical. Bottom images show extravasated neutrophils in response to an endotoxin-induced uveitis (EIU) model for comparison (not laser damage model). Scale bar = 20 µm.
Figure 7—figure supplement 1.
Figure 7—figure supplement 1.. Positive control endotoxin-induced uveitis (EIU) model: wide-field image of ex-vivo neutrophils 1 day post-lipopolysaccharide (LPS) injection.
Retinal whole mount (C57BL/6J mouse) stained for DAPI (left), Ly-6G-647 (middle), and merged (right) shows a large neutrophil response, many of which have extravasated into the retinal parenchyma. White box indicates the region cropped and displayed in Figure 7B. Scale bar = 40 µm.
Figure 8.
Figure 8.. Neutrophil response to laser injury tracked with adaptive optics scanning light ophthalmoscopy (AOSLO).
A single retinal location was tracked in a Catchup mouse from baseline to 2 months after lesion. Location of the lesion is apparent at 1 and 3 days post-injury with diminishing visibility after 1 week. We did not observe stalled, aggregated, or an accumulation of neutrophils at any time point. This evaluation was confirmed at multiple depths ranging from the nerve fiber layer (NFL) to the outer nuclear layer (ONL). Scale bar = 40 µm.
Figure 8—figure supplement 1.
Figure 8—figure supplement 1.. Acute neutrophil response to laser injury tracked with adaptive optics scanning light ophthalmoscopy (AOSLO).
A single mouse was tracked for 0.5–3.5 hours after a deep retinal lesion was placed at the center of the imaged field, adjacent to a large venule. Neutrophils did not extravasate within this early post-lesion window (*also see Figure 8—video 3).
Figure 9.
Figure 9.. Neutrophil and microglial behavior after laser injury, as observed through ex vivo confocal microscopy.
(A) En-face max intensity projection images of inner and outer (separated by approximate inner nuclear layer [INL] center) retinal microglia/neutrophils in Ly-6G-647-stained CX3CR1-GFP retinas. Microglia display focal aggregation in the outer retina for 1-, 3-, and 7-day time points that is resolved by 2 months. Neutrophils do not aggregate or colocalize to the injury location at any time point. Z-stacks were collected from five mice for the indicated time points. (B) Cross-sectional views of en-face z-stacks presented in (A), including DAPI nuclear label. White dotted line indicates 100 µm region expanded below. Microglia migrate into the outer nuclear layer (ONL) by 1, 3, and 7 days post-laser injury and return to an axial distribution similar to that of control by 2 months. The few neutrophils detected remained within the inner retina. Scale bars = 40 µm. (C) Orthogonal view of DAPI-stained retina with Ly-6G-647-labeled overlay 1 day post-laser-injury. In a rare example, two neutrophils are found within the inner plexiform layer (IPL)/outer plexiform layer (OPL) layers despite a nearby outer retinal laser lesion. Scale bar = 20 µm. (D) Magnified 3D cubes representing cells 1 and 2 in (C). Cell 1 displays pill-shaped morphology, and cell 2 is localized to a putative capillary branch point. Each is confined within vessels suggesting they do not extravasate in response to laser injury.
Figure 9—figure supplement 1.
Figure 9—figure supplement 1.. Neutrophil/microglial response to laser injury tracked with ex vivo confocal microscopy.
Simultaneously acquired GFP-positive microglia and Ly-6G-647-positive neutrophils were imaged with confocal microscopy in five CX3CR1-GFP mice. En-face images for several retinal depths are displayed. By 1, 3, and 7 days post-lesion, microglia have migrated into the outer retina, many appearing amoeboid and displaying fewer laterally branching projections. Despite the deep microglial response, neutrophils stay within the inner retina and are not found in the avascular outer retinal layers. Scale bar = 40 µm.
Figure 9—figure supplement 2.
Figure 9—figure supplement 2.. Microglial photoreceptor (PR) phagosomes in the outer retina assessed with ex vivo confocal imaging.
(A) En-face images of outer stratum of outer nuclear layer (ONL) in a DAPI-stained CX3CR1-GFP mouse 3 days post-laser-injury (top row). Microglia have infiltrated deep into the ONL and several PR phagosomes were identified. White arrows indicate locations for a single microglia (i), PR (ii), and PR phagosome (iii). These locations were expanded and displayed below. Microglia exhibited a heterogeneous nuclear staining pattern while PR nuclei exhibited homogenous DAPI fluorescence pattern. PRs displayed this pattern regardless of whether they were within a microglial phagosome or not. Top scale bar = 20 µm, bottom scale bar = 2 µm. (B) A finely sliced (0.1 µm step size) outer retinal z-stack of DAPI-stained CX3CR1-GFP retina was used to quantify the average nuclear volume for infiltrated microglia (n=14 nuclei) and PRs (n=20 nuclei) for the same lesion site presented in (A). On average, microglia had a statistically significant (p<0.001, student’s paired two-tailed t-test) nuclear volume that was >3× that of PRs. These measurements allowed us to discriminate microglial somas from PR phagosomes. Error bars display mean ± 1 SD. (C) Cross-sections of DAPI-stained outer retina in CX3CR1-GFP mice for 1, 3, and 7 days post-laser injury (n=3 mice). Three representative planes (X–Z) through the lesion are displayed for each time point. Microglia form PR phagosomes within the ONL, and microglial processes were seen extended into the PR inner/outer segment layer. Arrows label various morphological features seen at lesion sites: microglial somas (yellow), diving microglial process (violet), PR phagosome (red), and microglial inner/outer segment process (cyan). Scale bar = 20 µm.
Figure 10.
Figure 10.. Quantification of neutrophils in laser-damaged retinas assessed with ex vivo confocal microscopy over a wide field.
(A) Representative image (maximum intensity projection) displays neutrophils quantified using large-field (796×796 µm) z-stacks for control or 1 day after injury time points. In both control and laser-injured retinas, neutrophils were sparse and confined to locations within capillaries, suggesting they were the native fraction of circulating neutrophils at time of death. Inset displays an expanded image of a single neutrophil. Scale bar = 200 µm. (B) Neutrophils quantified and displayed as the number of neutrophils per retinal area. The difference in the number of neutrophils in control (n=4 locations, 2 mice) vs lesioned (n=4 locations, 2 mice) retinas was not statistically significant (p=0.19, student’s paired two-tailed t-test). Error bars display mean ± 1 SD.

Update of

Similar articles

Cited by

References

    1. Allen C, Thornton P, Denes A, McColl BW, Pierozynski A, Monestier M, Pinteaux E, Rothwell NJ, Allan SM. Neutrophil cerebrovascular transmigration triggers rapid neurotoxicity through release of proteases associated with decondensed DNA. Journal of Immunology. 2012;189:381–392. doi: 10.4049/jimmunol.1200409. - DOI - PMC - PubMed
    1. American Academy of Ophthalmology Current ROP Therapies: How Laser and Anti-VEGF Compare. 2014. [February 1, 2014]. https://www.aao.org/eyenet/article/current-rop-therapies-how-laser-antiv...
    1. Babcock AA, Kuziel WA, Rivest S, Owens T. Chemokine expression by glial cells directs leukocytes to sites of axonal injury in the CNS. The Journal of Neuroscience. 2003;23:7922–7930. doi: 10.1523/JNEUROSCI.23-21-07922.2003. - DOI - PMC - PubMed
    1. Boyce M, Xin Y, Chowdhury O, Shang P, Liu H, Koontz V, Strizhakova A, Nemani M, Hose S, Zigler JS, Jr, Campbell M, Sinha D, Handa JT, Kaarniranta K, Qian J, Ghosh S. Microglia-neutrophil interactions drive dry AMD-like pathology in a mouse model. Cells. 2022;11:3535. doi: 10.3390/cells11223535. - DOI - PMC - PubMed
    1. Boycott BB, Hopkins JM. Microglia in the retina of monkey and other mammals: its distinction from other types of glia and horizontal cells. Neuroscience. 1981;6:679–688. doi: 10.1016/0306-4522(81)90151-2. - DOI - PubMed