

Datavzrd: Rapid programming- and maintenance-free interactive visualization and communication of tabular data
- PMID: 40694543
- PMCID: PMC12282858
- DOI: 10.1371/journal.pone.0323079
Datavzrd: Rapid programming- and maintenance-free interactive visualization and communication of tabular data
Abstract
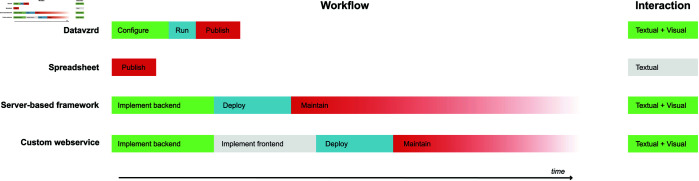
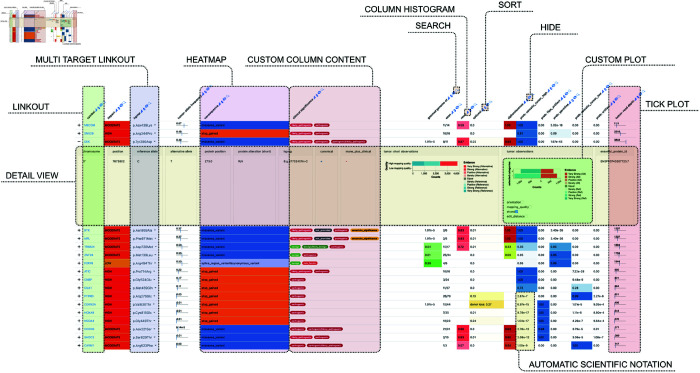
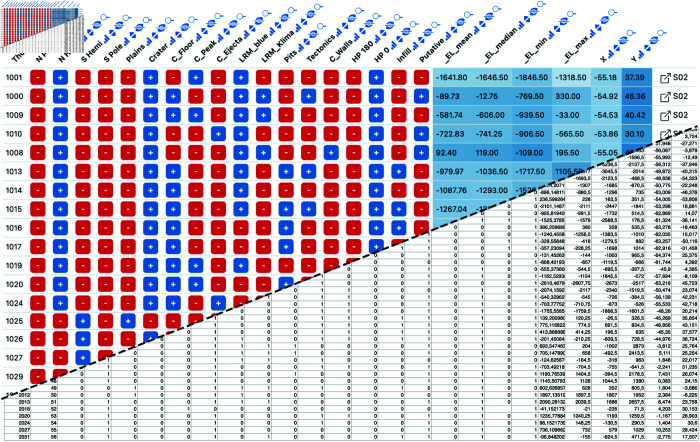
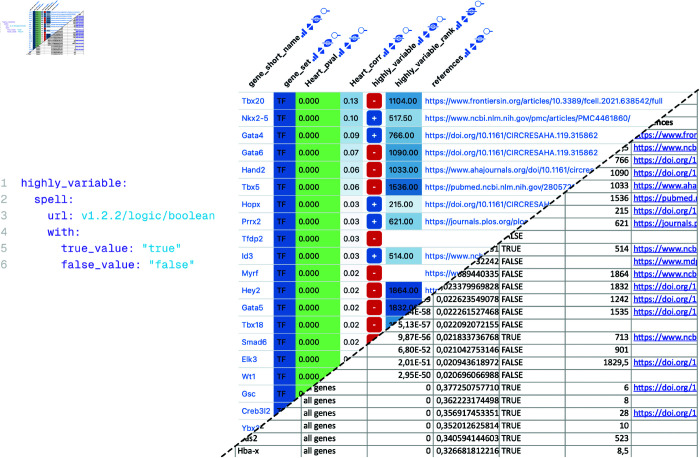
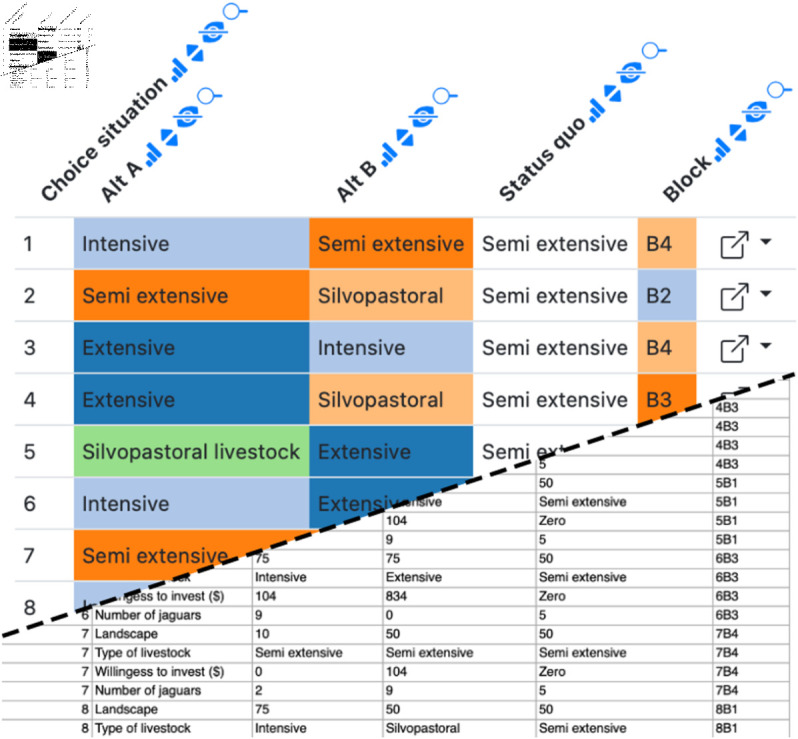
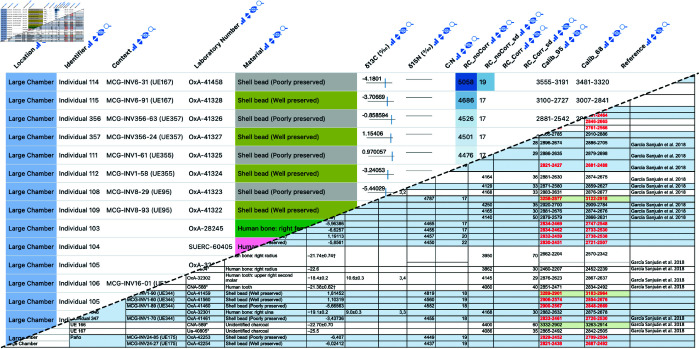
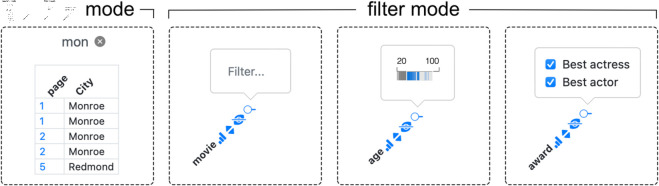
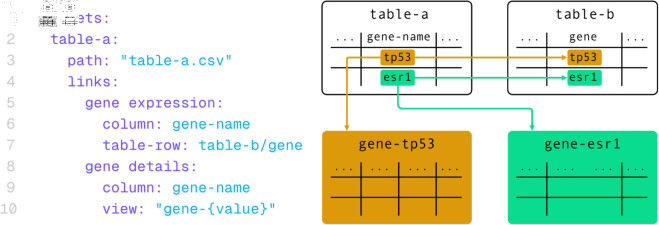
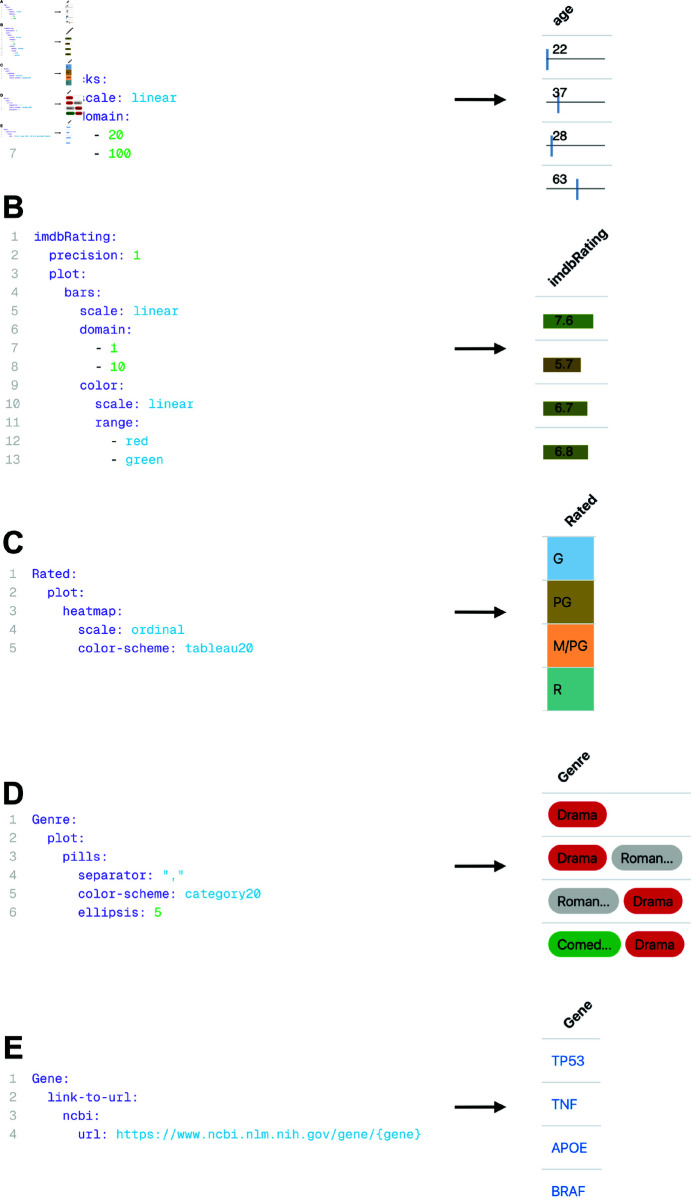
Tabular data, often scattered across multiple tables, is the primary output of data analyses in virtually all scientific fields. Exchange and communication of tabular data is therefore a central challenge. We present Datavzrd, a tool for creating portable, visually rich, interactive reports from tabular data in any kind of scientific discipline. Datavzrd unifies the strengths of currently common generic approaches for interactive visualization like R Shiny with the portability, ease of use and sustainability of plain spreadsheets. The generated reports do not require the maintenance of a web server nor the installation of specialized software for viewing and can simply be attached to emails, shared via cloud services, or serve as manuscript supplements. They can be specified without requiring imperative programming, thereby enabling rapid development and offering accessibility for non-computational scientists, unlocking the look and feel of dedicated manually crafted web applications without the maintenance and development burden. Datavzrd reports scale from small tables to thousands or millions of rows and offer the ability to link multiple related tables, allowing to jump between corresponding rows or hierarchically explore growing levels of detail.
Copyright: © 2025 Wiegand et al. This is an open access article distributed under the terms of the Creative Commons Attribution License, which permits unrestricted use, distribution, and reproduction in any medium, provided the original author and source are credited.
Conflict of interest statement
The authors have declared that no competing interests exist.
Figures
Similar articles
-
Technological aids for the rehabilitation of memory and executive functioning in children and adolescents with acquired brain injury.Cochrane Database Syst Rev. 2016 Jul 1;7(7):CD011020. doi: 10.1002/14651858.CD011020.pub2. Cochrane Database Syst Rev. 2016. PMID: 27364851 Free PMC article.
-
Sexual Harassment and Prevention Training.2024 Mar 29. In: StatPearls [Internet]. Treasure Island (FL): StatPearls Publishing; 2025 Jan–. 2024 Mar 29. In: StatPearls [Internet]. Treasure Island (FL): StatPearls Publishing; 2025 Jan–. PMID: 36508513 Free Books & Documents.
-
Signs and symptoms to determine if a patient presenting in primary care or hospital outpatient settings has COVID-19.Cochrane Database Syst Rev. 2022 May 20;5(5):CD013665. doi: 10.1002/14651858.CD013665.pub3. Cochrane Database Syst Rev. 2022. PMID: 35593186 Free PMC article.
-
A rapid and systematic review of the clinical effectiveness and cost-effectiveness of topotecan for ovarian cancer.Health Technol Assess. 2001;5(28):1-110. doi: 10.3310/hta5280. Health Technol Assess. 2001. PMID: 11701100
-
mindLAMPVis as a Co-Designed Clinician-Facing Data Visualization Portal to Integrate Clinical Observations From Digital Phenotyping in Schizophrenia: User-Centered Design Process and Pilot Implementation.JMIR Form Res. 2025 Jun 10;9:e70073. doi: 10.2196/70073. JMIR Form Res. 2025. PMID: 40493647 Free PMC article.
References
-
- European Organization for Nuclear Research, OpenAIRE. Zenodo. 2013. https://www.zenodo.org/
MeSH terms
LinkOut - more resources
Full Text Sources
