. 2025 Jul 22;23(7):e3003260.
doi: 10.1371/journal.pbio.3003260. eCollection 2025 Jul.

Systematic screen uncovers regulator contributions to chemical cues in Escherichia coli

Affiliations

Systematic screen uncovers regulator contributions to chemical cues in Escherichia coli

Christoph Binsfeld et al. PLoS Biol. .

Abstract

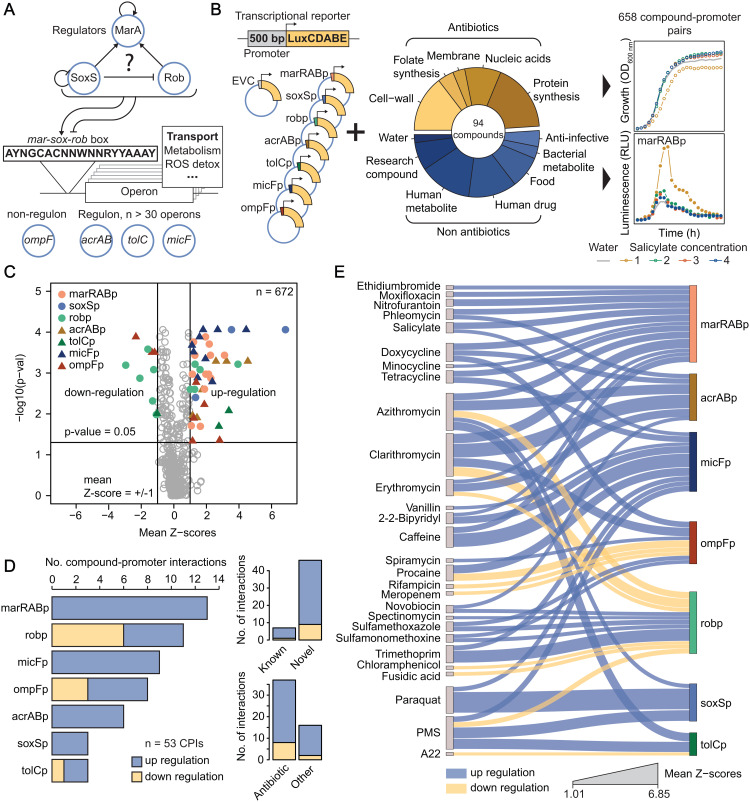
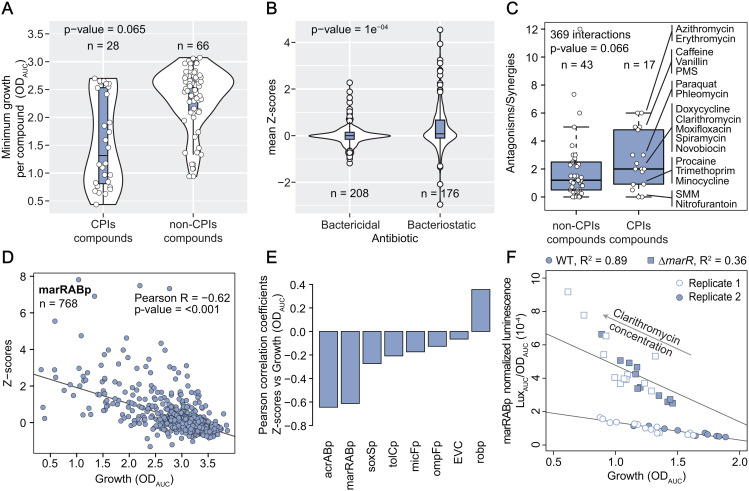
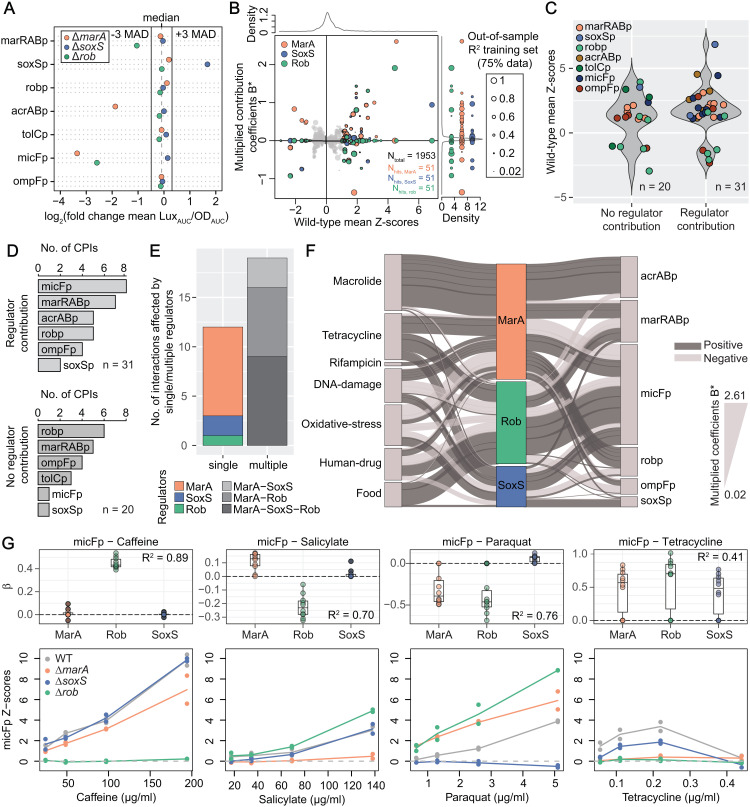
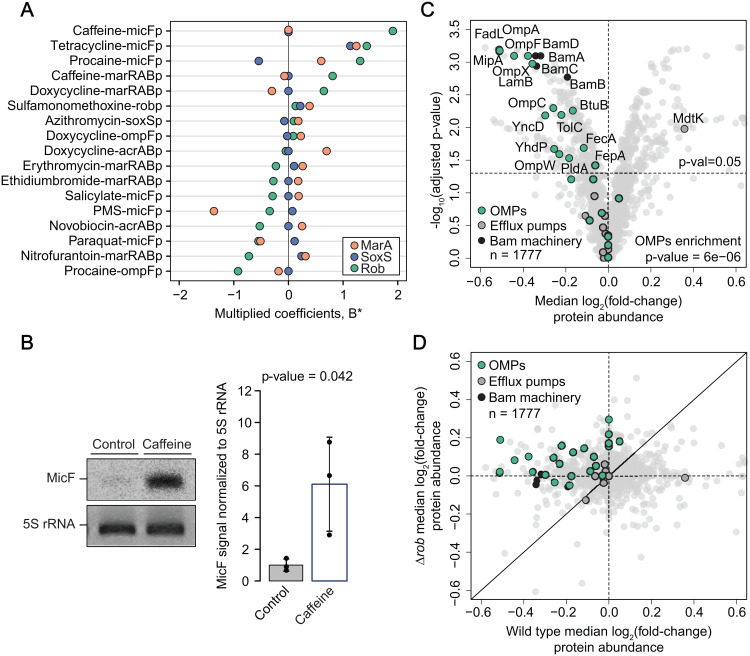
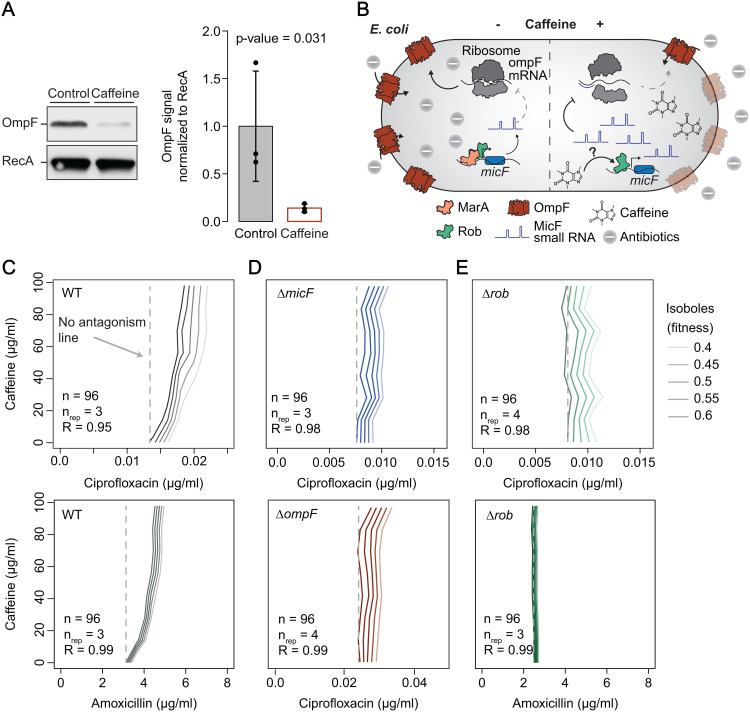
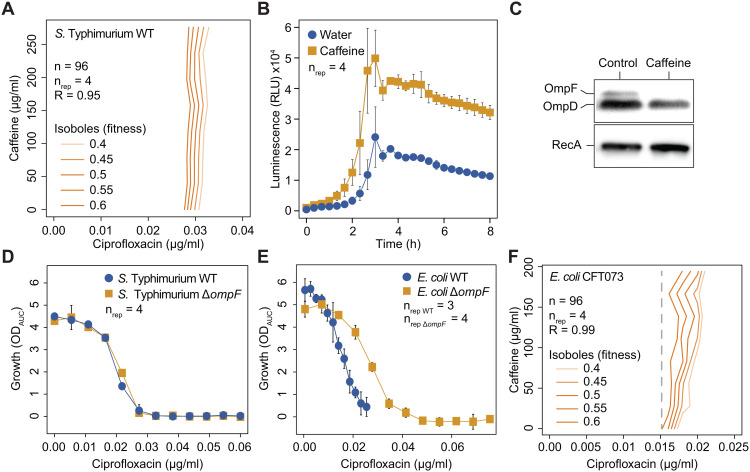
In Gram-negative bacteria, the uptake and export of a wide range of molecules, including antibiotics, is facilitated by porins and efflux pumps. Because of their role in regulating small molecule permeability of the outer and inner membrane, these transport machineries are tightly regulated at the transcriptional and post-transcriptional levels. However, regulation of transport by external chemical cues remains poorly understood. Here we investigated transcriptional regulation of three prominent transporter genes in Escherichia coli across 94 defined chemical cues, and simultaneously mapped the contributions of the key regulators MarA, SoxS and Rob to promoter activity. One third of all tested compounds triggered transcriptional changes, the majority of which were previously unknown. Importantly, we exposed main drivers of transport control in E. coli, e.g., bacteriostatic but not bactericidal antibiotics trigger the expression of efflux pumps, and Rob contributes to ~1/3 of all measured transcriptional changes, thereby emerging as a more prominent regulator of transport than previously thought. We showcase the potential of our resource by elucidating the molecular mechanism of antibiotic antagonisms with widely consumed caffeine in E. coli. Altogether, our analysis provides a quantitative overview of how different regulators orchestrate the transcriptional response of major transport determinants to environmental chemical cues.


Conflict of interest statement

The authors have declared that no competing interests exist.

Figures

Fig 1
Fig 1. Unravelling transcriptional regulation of drug transport-related genes in E. coli under chemical stress.
(A) Simplified schematic representation of the mar-sox-rob network, as well as placement of the 7 promoters selected for this study. Previously described auto- and cross-regulation between the three regulators [2,41], as well as their degenerate binding sequence (mar-sox-rob box [76]) are also represented. (B) Schematic overview of the screening approach. Lux-based transcriptional reporters of 7 key transport-related genes and the compound library used in this study to probe 658 compound-promoter interactions. Growth and luminescence were periodically measured over 12 h. (C) Compound-promoter interactions in E. coli. Volcano plot summarizing the screen results shows 53 significant CPIs (colored by promoter) amongst 658 tested (+water, n = 672 in total). X-axis: mean Z-scores (n = 4 concentrations x 2 biological replicates = 8). Y-axis: Benjamini Hochberg adjusted p-value of double-sided rank-sum statistical test between Z-scores of compound-promoter pairs (n = 8) and water (n = 16). (D) General features of compound-promoter interactions (CPIs). Number (No) of interactions per promoter (left), their classification according to novelty (upper right corner) and whether they involve an antibiotic (lower right corner) are shown. (E) CPI network. Fifty-three significant compound-promoter interactions are shown as edges in a Sankey diagram connecting the compounds (left, source nodes) to the promoters (right, target nodes). Edge thickness represents mean Z-scores (n = 8), while node size represents the total number of interactions. The underlying data for all panels can be found in S7 Table.
Fig 2
Fig 2. General principles driving transport compound-promoter interactions.
(A) Most compounds identified within CPIs have antimicrobial effect. Distribution of minimum growth (0.1 quantile of all ODAUC measurements for a given compound, 4 concentrations x 8 strains x 2 replicates = 64 values) of all compounds tested (ntotal = 94), classified according to whether they are (or not) involved in CPIs. P-value from a double-sided rank-sum statistical test between the two distribution depicted in the plot is shown (null-hypothesis is that both distributions are identical). Boxplots indicate 25th, 50th and 75th percentiles, and whiskers extend up to 1.5 times the interquartile range (IQR) from the 25th and 75th percentiles. (B) Bacteriostatic antibiotics are over-represented within strong CPIs. Mean Z-scores distributions of all tested compound-promoter pairs involving antibiotics (ntotal = 384), classified according to whether the antibiotic is bactericidal or bacteriostatic. P-value from a double-sided rank-sum statistical test between the two distributions depicted in the plot is shown (null-hypothesis is that both distributions are identical). Boxplots indicate 25th, 50th and 75th percentiles, and whiskers extend up to 1.5 x IQR from the 25th and 75th percentiles. (C) Compounds within CPIs are over-represented among antagonistic drug interactions. Boxplots of ratios antagonisms over synergies (total 369 interactions) for all tested compounds which overlap with our previous work [13] (ntotal = 60), classified according to whether they are (or not) involved in CPIs. p-value from a one-sided rank-sum statistical test shown. Center, upper and bottom lines represent 25th, 50th and 75th percentiles, whiskers extend to 1.5x IQR and points beyond whiskers are represented individually. (D) marRABp activity inversely correlates with growth. Z-scores of all compound-marRABp tested pairs including water across 4 concentrations and 2 biological replicates (n) are plotted against growth (ODAUC). A strong negative linear relationship is illustrated by the line of best fit (Huber robust model). Correlation p-value (double sided t test) shown. (E) Promoter activity is generally not correlated with growth. Pearson correlation coefficients of Z-scores vs. growth (ODAUC) for each individual promoter. A strong negative Pearson correlation (>0.6) is only observed for marRABp and acrABp, while robp tends to show the opposite behavior. Correlation p-value (double sided t test) < 0.005 for all promoters. (F) Induction of marRABp by clarithromycin, as well as its negative correlation with growth remain, irrespective of the presence of MarR. Luminescence profiles over growth were measured across a linear range of clarithromycin concentrations from 0 µg/ml to 119.6 µg/ml in wild-type and ∆marR background. Growth-normalized luminescence is plotted against growth for two independent biological replicates, and lines-of-best-fit are shown to highlight strong correlation between the two variables. The underlying data for all panels can be found in S7 Table.
Fig 3
Fig 3. Mapping regulator contributions to compound-promoter interactions.
(A) Deletion of marA, soxS and rob alter promoter basal activity. log2 fold-change of water-promoter mean normalized luminescence (LuxAUC/ODAUC) of each deletion background in relation to the wild-type is plotted. The dashed line represents the median of log2 fold-change of water-promoter mean LuxAUC/ODAUC across all promoters and deletion backgrounds. Full lines show + /-3 MAD (median absolute deviation). Water-promoter mean LuxAUC/ODAUC over 16 replicates per reporter (n = 8 x 2 biological replicates = 16). (B) Regulator contributions to CPIs are complex and multi-directional. Multiplied coefficients (B*) of MarA, SoxS and Rob of 651 compound-promoter pairs vs. wild type mean Z-scores are plotted (ntotal). Dot size reflects the out-of-sample R2 of the corresponding compound-promoter pair. Pairs without R2 are represented with the smallest size. Density distributions of total B* and wild-type mean Z-scores are represented on the top and right side of the main plot, respectively. B* corresponding to 51 significant CPIs are colored according to regulator and projected into the right axis to facilitate visualization. (C) Most CPIs feature contributions of at least one regulator. Mean Z-score distributions of 51 CPIs (colored by promoter) classified on whether (or not) they have at least one non-zero B*. (D) Almost all acrABp and micFp CPIs depend on MarA, SoxS or Rob. Number of CPIs with (B* ≠ 0, upper plot) and without (B* = 0, bottom plot) regulator contributions distributed by promoter. (E) Most CPIs depend on two or all three regulators. Number of CPIs depending on single of multiple regulators, colored according to which regulators have B* ≠ 0. (F) Regulator-CPI network. Regulator contributions to 31 CPIs are shown as edges in a Sankey diagram connecting the compounds (left nodes, grouped according to class or purpose) the promoters (right nodes) via the regulators (middle). Edge thickness and node size represent B*, and the total number of interactions, respectively. (G) Regulator contributions to specific promoters are compound dependent. β (top) and Z-scores (bottom) of micFp interactions with caffeine, salicylate, paraquat and tetracycline in wild-type and ∆marA, ∆soxS and ∆rob. β corresponds to the regression coefficients quantifying the contribution of each regulator to the observed effect. Boxplots with β from the 10-fold cross validation are shown - center, upper and bottom lines represent 25th, 50th and 75th percentiles, whiskers extend to 1.5x IQR and points beyond whiskers are represented individually. Lines are colored by strain and indicate mean Z-scores of two biological replicates (dots). Depending on the compound, micFp activity mostly depends on a single (caffeine), on two (salicylate), or on all three regulators (tetracycline and paraquat). The underlying data for all panels can be found in S7 Table.
Fig 4
Fig 4. Caffeine induces proteome-wide changes in a Rob-dependent manner.
(A) Caffeine-micFp interaction is primarily controlled by Rob. B* for all CPIs with non-zero Rob coefficients (n = 17), colored by regulator. (B) Caffeine increases MicF small RNA levels. Northern blot analysis confirming increased levels of small RNA MicF upon caffeine treatment (1 mM). One out of three biological replicates is shown. Quantification of the three replicates is shown as a barplot with the three replicates represented individually. Bar size and error bars reflect mean and standard deviation across the three replicates, respectively. P-value of a two-sided t test comparing the treated and untreated samples is shown. (C) Proteome-wide response to caffeine in E. coli. Volcano plot showing how -log10(p-value) relates to log2(fold-change) of caffeine treated compared to untreated cells. The p-values correspond to double-sided rank-sum test between fold-changes of a given protein and those of the entire set of proteins, after Benjamini-Hochberg correction for multiple testing. Median fold-changes across 6 caffeine concentrations at the two lower temperatures are shown (Materials and methods). Horizontal and vertical lines correspond to p-value = 0.05 and log2(fold-change) = 0, respectively. n refers to the total number of proteins detected. The double-sided Fisher’s exact test p-value for enrichment of OMPs among significantly decreased proteins is shown. (D) Comparison of proteome changes between wild type and Δrob upon caffeine treatment. Horizontal and vertical lines correspond to log2(fold-change) = 0. The black line represents the 1-to-1 diagonal. n refers to the total number of proteins detected. Median across three replicates treated with increasing caffeine concentrations are shown (Materials and methods). The underlying data for all panels can be found in S7 Table.
Fig 5
Fig 5. Rob-dependent caffeine-micFp interaction underlies species-specific antibiotic antagonisms in E. coli.
(A) Caffeine decreases OmpF protein levels. Immunoblot analysis using whole cell lysate and an E. coli OmpF specific antibody shows OmpF decreased levels upon caffeine treatment (1 mM). One out of three biological replicates is shown. Quantification of the three replicates is shown as a barplot with the three replicates represented individually. Bar size and error bars reflect mean and standard deviation across the three replicates, respectively. P-value of a one-sided t test comparing the treated and untreated samples is shown. (B) Proposed model for the molecular mechanism of caffeine-ciprofloxacin antagonism. Caffeine triggers expression of MicF small RNA in a Rob-dependent manner, which then binds to the 5′-UTR of ompF mRNA to inhibit and decrease OmpF protein levels. This ultimately prevents ciprofloxacin from entering the cell, resulting in caffeine-ciprofloxacin antagonism. (C-E) Caffeine-antibiotic antagonisms in E. coli are micF-, ompF- and rob-dependent. Isobolograms for caffeine-antibiotic interactions for E. coli wild-type (C), ΔmicF and ΔompF (D) and Δrob (E) are shown. Rightward oriented isoboles indicate antagonism, while upward oriented isoboles indicate no antagonism. A dashed line is plotted for no-antagonism reference for isobole 0.6 for all strains. One out of 3 or 4 biological replicates (nrep) is shown. R is the Pearson correlation between the biological replicates obtained with 96 (n) fitness values used to obtain each checkerboard. The underlying data for all panels can be found in S7 Table.
Fig 6
Fig 6. Caffeine-ciprofloxacin antagonism is absent in S. Typhimurium despite conserved regulatory mechanism.
(A) Absence of caffeine-ciprofloxacin antagonism in S. Typhimurium. Isobologram for caffeine-ciprofloxacin for S. Typhimurium. Details as in Fig 4E. (B) Caffeine induces micFp activity in S. Typhimurium. Luminescence profiles of S. Typhimurium micFp reporter strain over time + /- caffeine (2 mM). Mean luminescence (dots) and standard deviations (error bars) over 4 biological replicates. (C) Immunoblot analysis using total protein extractions and an OmpF polyclonal antibody shows OmpF decreased levels upon caffeine treatment (2 mM). One out of 3 biological replicates is shown. (D) Ciprofloxacin MIC is not altered upon ompF deletion in S. Typhimurium. Ciprofloxacin MIC curves (growth vs. antibiotic concentration) of S. Typhimurium wild-type and ΔompF. Mean growth (ODAUC, dots) and standard deviations (error bars) over 4 replicates. (E) Ciprofloxacin MIC increases upon ompF deletion in E. coli. Ciprofloxacin MIC curves (growth vs. antibiotic concentration) of E. coli wild-type and ΔompF. Mean growth (ODAUC, dots) and standard deviations (error bars) over 3 or 4 biological replicates. (F) Caffeine-ciprofloxacin antagonism against a pathogenic E. coli strain. Isobologram for caffeine-ciprofloxacin for E. coli CFT073. Details as in Fig 5C. The underlying data for all panels can be found in S7 Table.

Similar articles

References

    1. Nikaido H. Molecular basis of bacterial outer membrane permeability revisited. Microbiol Mol Biol Rev. 2003;67(4):593–656. doi: 10.1128/MMBR.67.4.593-656.2003 - DOI - PMC - PubMed
    1. Du D, Wang-Kan X, Neuberger A, van Veen HW, Pos KM, Piddock LJV, et al. Multidrug efflux pumps: structure, function and regulation. Nat Rev Microbiol. 2018;16(9):523–39. doi: 10.1038/s41579-018-0048-6 - DOI - PubMed
    1. Pagès J-M, James CE, Winterhalter M. The porin and the permeating antibiotic: a selective diffusion barrier in Gram-negative bacteria. Nat Rev Microbiol. 2008;6(12):893–903. doi: 10.1038/nrmicro1994 - DOI - PubMed
    1. Masi M, Réfregiers M, Pos KM, Pagès J-M. Mechanisms of envelope permeability and antibiotic influx and efflux in Gram-negative bacteria. Nat Microbiol. 2017;2:17001. doi: 10.1038/nmicrobiol.2017.1 - DOI - PubMed
    1. Vergalli J, Bodrenko IV, Masi M, Moynié L, Acosta-Gutiérrez S, Naismith JH, et al. Porins and small-molecule translocation across the outer membrane of Gram-negative bacteria. Nat Rev Microbiol. 2019;18(3):164–76. doi: 10.1038/s41579-019-0294-2 - DOI - PubMed

MeSH terms

LinkOut - more resources