

Assessing Aedes mosquito larval indicators, dengue virus infection rates, and risk factors in Khyber Pakhtunkhwa: Insights for improved vector control strategies
- PMID: 40694582
- PMCID: PMC12306792
- DOI: 10.1371/journal.pntd.0013252
Assessing Aedes mosquito larval indicators, dengue virus infection rates, and risk factors in Khyber Pakhtunkhwa: Insights for improved vector control strategies
Abstract
Background: Effective dengue management hinges on targeting key vector breeding sites and understanding transmission risks. Despite recurring outbreaks in Pakistan's Khyber Pakhtunkhwa (KP) Province since 2013, comprehensive entomological and virological data remain scarce. This study identified key larval-based indicators (habitats, Stegomyia indices), mosquito species composition, and dengue virus (DENV) infection rates in Aedes mosquitoes, evaluating their contributions to outbreak risk.
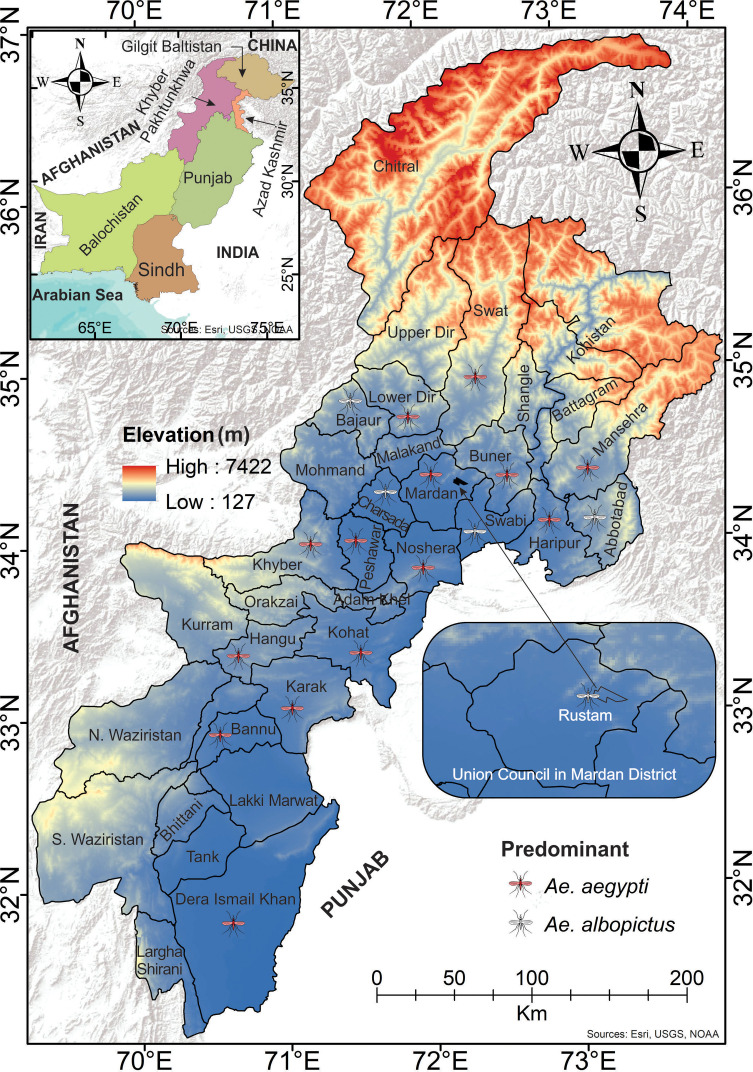
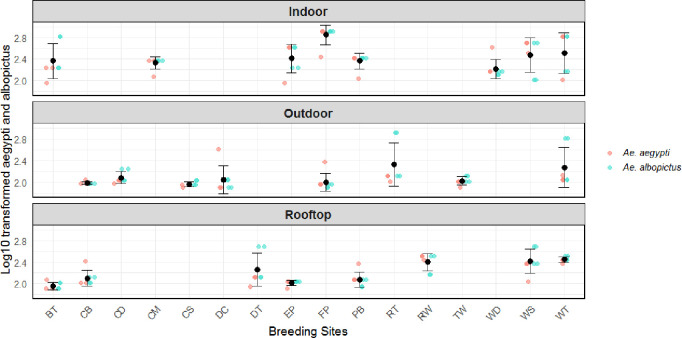
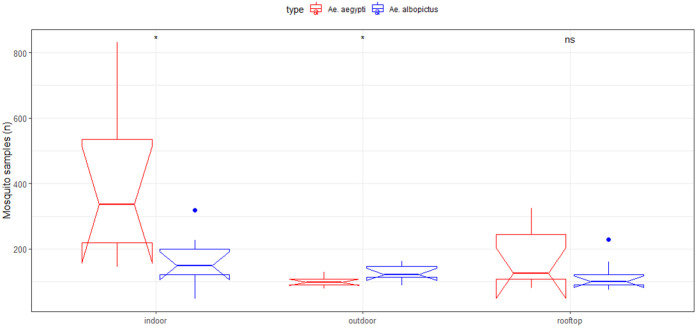
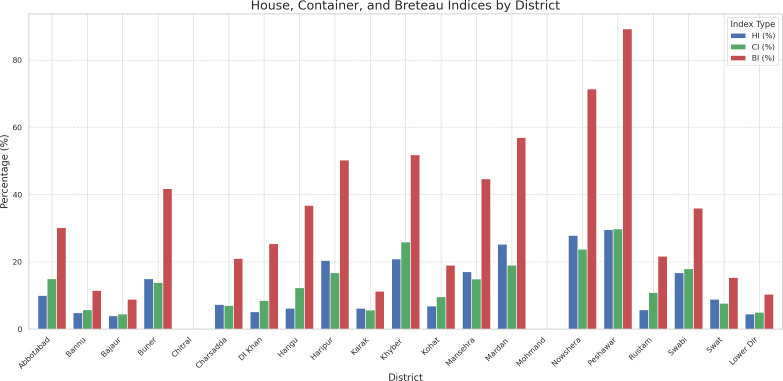
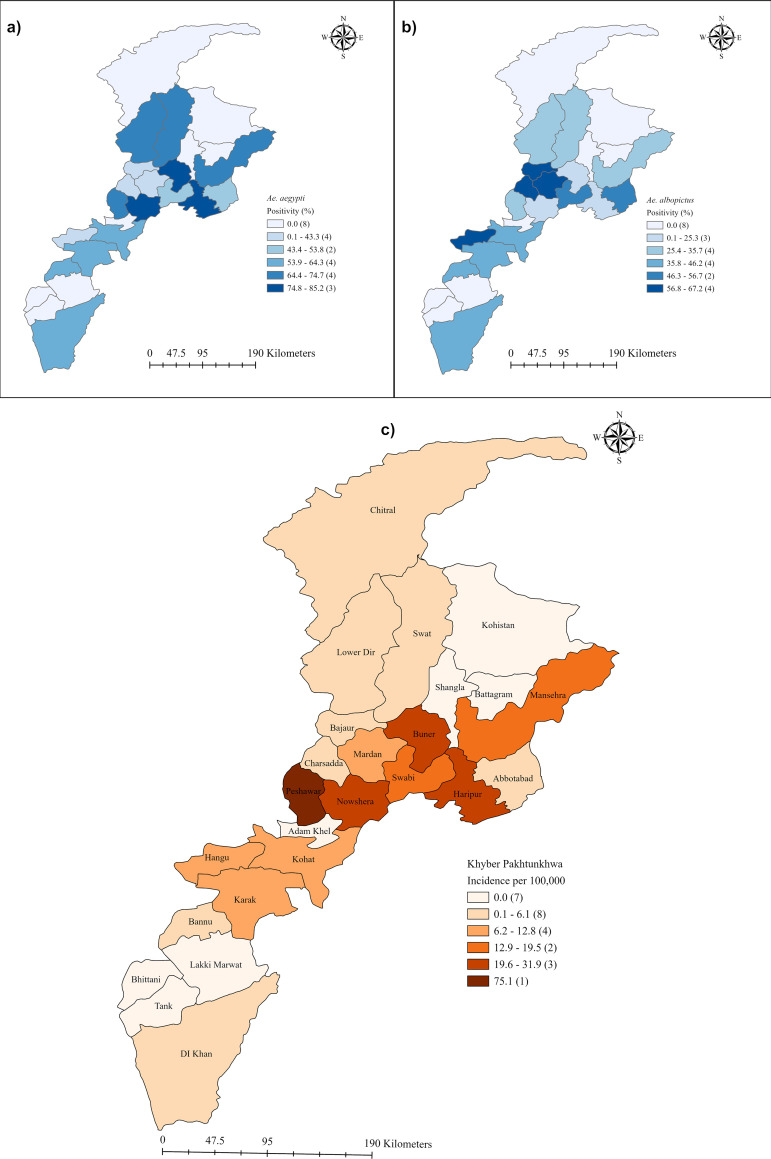
Methodology/principal findings: From July to December 2021, a cross-sectional larval survey of Aedes aegypti and Ae. albopictus was conducted across epidemiologically high-risk KP districts, inspecting water-holding containers located indoors, outdoors, and on rooftops. Additionally, adult mosquitoes were collected using aspirators and nets, with weekly dengue case data sourced from Peshawar's Directorate of Health Services. A subsample of 200 adult mosquito pools (20 per district) underwent RT-PCR to determine minimum infection rates (MIR). Larval indices revealed a House Index (HI) of 19.4%, a Container Index (CI) of 20.4%, and a Breteau Index (BI) of 89%. Aedes aegypti was the dominant species, accounting for 62% of larvae and 67.8% of adult mosquitoes. Peshawar (BI = 89.3), Nowshera (BI = 71.4), and Mardan (BI = 57) reported the highest Breteau indices and corresponding dengue case counts: 2,584 (48.8%), 404 (7.6%), and 327 (6.2%), respectively. The peak larval positivity was recorded in October (29.3%) and September (24.7%), aligning with dengue patient hospitalization rates of 52.8% and 46.8%, respectively. Common breeding sites included indoor flowerpots (25.4%), outdoor rubber tyres (16%), and roof tap water (23.7%). Container type and location significantly (P < 0.00) predicted larval abundance. Regression analysis revealed significant associations between dengue incidence, population density, and stegomyia indices. Of 38 positive pools (19%), DENV-2 and DENV-3 predominated (47.4% each), with peak MIRs recorded in Peshawar (30), Mardan (25), and Haripur (25).
Conclusions/significance: High larval indices and dual-serotype circulation in adaptable Aedes vectors signal substantial outbreak risk in KP. These findings underscore the need for targeted vector strategies, focusing on containers with the highest breeding potentials and epidemiological significance, particularly in high-transmission areas. Further molecular and entomological investigations are critical to corroborate these findings and inform more effective interventions.
Copyright: © 2025 Khan et al. This is an open access article distributed under the terms of the Creative Commons Attribution License, which permits unrestricted use, distribution, and reproduction in any medium, provided the original author and source are credited.
Conflict of interest statement
The authors have declared that no competing interests exist.
Figures
References
-
- Khan J, Adil M, Wang G, Tsheten T, Zhang D, Pan W, et al. A cross-sectional study to assess the epidemiological situation and associated risk factors of dengue fever; knowledge, attitudes, and practices about dengue prevention in Khyber Pakhtunkhwa Province, Pakistan. Front Public Health. 2022;10:923277. doi: 10.3389/fpubh.2022.923277 - DOI - PMC - PubMed
-
- Mukhtar M, Tahir Z, Baloch TM, Mansoor F, Kamran J. Entomological investigations of dengue vectors in epidemic-prone districts of Pakistan during 2006–2010. Deng Bull. 2011;35.
MeSH terms
LinkOut - more resources
Full Text Sources
Medical
Miscellaneous
