. 2025 Jul 19;53(14):gkaf679.
doi: 10.1093/nar/gkaf679.

Evidence that transient replication errors initiate nuclear genome mutations

Affiliations

Evidence that transient replication errors initiate nuclear genome mutations

Scott A Lujan et al. Nucleic Acids Res. .

Abstract

DNA synthesis during genomic replication generates mismatches that lead to mutations. Point mutations may be caused by base-base mismatches that yields base substitutions or by primer- or template-strand slippage, which yield insertions and deletions (indels), respectively. Evidence obtained 40 years ago with DNA polymerases in vitro indicated that transient DNA intermediates also initiate substitutions and indels. Here, we provide evidence in vivo that the rates of specific single-base mutations at or adjacent to the 3'-terminus of the primer strand of mononucleotide runs increase change with run length. We propose that four such TIM (transient initiator mutagenesis) pathways are active during replication of the yeast nuclear genome in vivo and may be a universal feature of DNA replication.

Plain language summary

Evidence is provided that the rates of specific single-base mutations at or adjacent to the 3'-terminus of the primer strand of runs of the same base pair change with run length. We propose that four such pathways are active during replication of the yeast nuclear genome in vivo, that they may be a universal feature of DNA replication in many different organisms, and that the mutations they cause may be associated with human diseases.


Conflict of interest statement

None declared.

Figures

Graphical Abstract
Graphical Abstract
Figure 1.
Figure 1.
Mutagenic replication pathways and data sets sufficient for their detection. DNA polymerase may introduce errors (bold green characters) that result in single-base point mutations (orange bold underlined) at or following the 3′-end of homopolymer tracts. They are hypothesized to do this via eight pathways. Note that degenerate positions (B, V, and N) are assumed to be complementary when depicted as paired. (A) All examples are illustrated as starting with three primer-strand As paired with a tract of four template Ts, which are flanked by degenerate nucleotides. (B) The primer is extended by one A base, to the end of the template run, in four of these pathways. (CJ) The eight pathways include four canonical pathways (C, E, G, I; gray arrows with colored borders) and four pathways that are initiated by intermediate errors, transient initiator mutagenesis (TIM; D, F, H, J; colored arrows). Note that non-iterated bases are herein considered 1-bp tracts. Contexts indicative of TIM pathways are highlighted in colors that match TIM arrows. Abbreviations for reaction steps, degenerate nucleotide nomenclature, and pathway names are stated in the figure. (K) Of 160 possible combinations of mutation accumulation data set, mutation type, and potential TIM pathway, 29 were subject to analysis (blue highlighted 1). The rest were rejected due to either impossible strand assignment or insufficient data. Strand assignment was stymied by either (2) frequent complementary mutations during opposite strand synthesis or (3) rates matching a strain with no mutator polymerases. Data insufficiency includes (4) too few run lengths with at least the minimum number of observed mutations and/or (5) insufficient data in short runs (<5 bp).
Figure 2.
Figure 2.
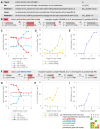
Evidence for TSIM. (A) Sequence contexts (targets), mutations (hits), and hypotheses (predictions) for detecting TSIM. Note that f(AnX) denotes the background fraction of X following all A homopolymers. (B) Exemplar substitution mutation, from the pol2-04 (het) pol3-5DV msh6Δ strain, that may have been generated via lagging strand TSIM. (C–E) Data from the pol2-04 (het) pol3-5DV msh6Δ strain. (C) The fraction of all A-tracts of given lengths (n; bp) followed by a G (f(AnG); open blue circles) versus the fraction of A-tracts terminating in A to G substitutions (A|G) followed by a G (f(An−1[A|G]G); closed blue circles). Where TSIM predominates, more flanking Gs are predicted (f(An−1[A|G]G) > f(AnG)). The fractions of all A-tracts and of A|G-terminated A-tracts followed by a T or C (f(An [36]) and f(An−1[A|G]{T,C}); open and closed red triangles, respectively) must follow the opposite trend. (D) TSIM rates are expected to increase in proportion to slippage rates, which increase exponentially with run length, to a point [20]. Given that the vast majority of mutations in the pol2-04 (het) pol3-5DV msh6Δ strain are made during lagging strand synthesis, lagging strand A|G rates (green diamonds) should increase exponentially with run length (r(An−1(A|G]) ∝ en) where the TSIM pathway predominates. (E) The fraction of A|G mutations created via the TSIM pathway (calculated from data in panel (C); see the “Materials and methods” section and Supplementary File S1). (F) As per panel (B), but for an A to T substitutions (A|T) in the pol2-M644G MMR− strains. (G–I) Data from the pol2-M644G MMR− strains. (G) As per panel (C), but for A|T and flanking T versus G or C bases. A|T substitutions in the pol2-M644G MMR− strains are an example of the caveat in panel (A), i.e. they have a known bias against next nucleotide T (see non-iterated As, i.e. n = 1 [15]). The data for 6-bp tracts are indicated by crosses, as the trend is significant even though the mutation count falls below the predetermined cutoff. (H) As per panel (D), but for A|T rates. Note that the pol2-M644G MMR− strains have a leading strand error bias [, 16]. (I) As per panel (E), but for A|T substitutions created via TSIM. The data for 6-bp tracts are indicated as per panel (G). Note how baseline subtraction (see the “Materials and methods” section) corrects for the next nucleotide bias to produce a TSIM fraction curve nearly superimposable with the one in panel (E) (R2 = 0.95 for 1–6-bp runs). (J) Combinations of mutation accumulation data set and mutation type where there is significant evidence for TSIM (green ✓), where deviation from baseline match collective trends (Supplementary Fig. S3) and thus suggests TSIM but does not meet significance cutoffs (yellow X; see the “Materials and methods” section for thresholds), or where no TSIM is indicated with the current data (red X).
Figure 3.
Figure 3.
Evidence for PSIM. (A) Sequence contexts (targets), mutations (hits), and hypotheses (predictions) for detecting PSIM. (B) Exemplar substitution mutation, from the pol3-L612M MMR− strains, which may have been generated via lagging strand PSIM. (C, D) Data from the pol3-L612M MMR− strains. (C) PSIM rates are expected to increase in proportion to slippage rates, which increase exponentially with run length, to a point [20]. Given that the vast majority of mutations in the pol3-L612M MMR− strain are made during lagging strand synthesis [, 16], lagging strand T to A rates (T|A; green diamonds) should increase exponentially with run length (r(An−1[T|A]) ∝ en) where the PSIM pathway predominates. (D) The fraction of T|A mutations created via the PSIM pathway (calculated from data in panel (C); see the “Materials and methods” section and Supplementary File S1). (E) Combinations of mutation accumulation data set and mutation type where there is significant evidence for PSIM (green ✓), or where no PSIM is indicated with the current data (red X).
Figure 4.
Figure 4.
Evidence for mispair-initiated strand slippage (MIPS and MITS). (A) Sequence contexts (targets), mutations (hits), and hypotheses (predictions) for detecting MIPS. (B) Exemplar insertion mutation, from the pol2-M644G MMR− strains, that may have been generated via leading strand MIPS. (C, D) Data from the pol2-M644G MMR− strains. (C) The fraction of all A-tracts of given lengths (n; bp) followed by G (f(AnG); open blue circles) versus the fraction of A-tracts with 1-bp insertions followed by a G (f(An+1G); closed blue circles). Pol2-M644G mispairs incoming dA bases with template C over 10 times as often as with template G and almost never with template A [, 16]. Where MIPS predominates, more flanking Gs, the complement to template Cs, are predicted (f(An+1G) > f(AnG)). The fractions of all A-tracts and of insertion-containing A-tracts followed by a T or C (f(An{T,C}) and f(An+1{T,C}); open and closed red triangles, respectively) must follow the opposite trend. (D )The fraction of A insertions created via the MIPS pathway (calculated from data in panel (C); see the “Materials and methods” section and Supplementary File S1). (E) Combinations of mutation accumulation data set and mutation type where there is significant evidence for MIPS (green ✓) or where deviations from baseline match collective trends (Supplementary Fig. S3) and thus suggest MIPS but does not meet significance cutoffs (yellow X; see the “Materials and methods” section for thresholds). (F) As per panel (A), but for detecting MITS. (G) Exemplar deletion mutation, from the pol3-L612M MMR− strains, that may have been generated via leading strand MITS. (H, I) Data from the pol3-L612M MMR− strains. (H) The fraction of all A-tracts of given lengths (n; bp) followed by G (f(AnG); open blue circles) versus the fraction of A-tracts with 1-bp deletions followed by a G (f(An−1G); closed blue circles). Pol3-L612M mispairs template T bases with incoming dG over 20 times as often as with incoming dC and almost never with incoming dT [15,16]. Where MITS predominates, more flanking Gs are predicted (f(An−1G) > f(AnG)). The fractions of all A-tracts and of insertion-containing A-tracts followed by a T or C (f(An{T,C}) and f(An+1{T,C}); open and closed red triangles, respectively) must follow the opposite trend. (I) The fraction of A deletions created via the MITS pathway (calculated from data in panel (H); see the “Materials and methods” section and Supplementary File S1). (J) As per panel (E), but for MITS. Combinations where current data indicate no MITS are indicated (red X; see the “Materials and methods” section for thresholds). (K) The rate at which mispairs lead to mutations. These rates were inferred from mutation rates (Supplementary Fig. S7) and strand biases [, 16] in the three MMR− strains.

Similar articles

References

    1. Johnson SJ, Beese LS Structures of mismatch replication errors observed in a DNA polymerase. Cell. 2004; 116:803–16. 10.1016/S0092-8674(04)00252-1. - DOI - PubMed
    1. Zhou ZX, Lujan SA, Burkholder AB et al. How asymmetric DNA replication achieves symmetrical fidelity. Nat Struct Mol Biol. 2021; 28:1020–8. 10.1038/s41594-021-00691-6. - DOI - PMC - PubMed
    1. Marks SA, Zhou ZX, Lujan SA et al. Evidence that DNA polymerase delta proofreads errors made by DNA polymerase alpha across the Saccharomyces cerevisiae nuclear genome. DNA Repair (Amst). 2024; 143:103768. 10.1016/j.dnarep.2024.103768. - DOI - PubMed
    1. Pavlov YI, Frahm C, Nick McElhinny SA et al. Evidence that errors made by DNA polymerase alpha are corrected by DNA polymerase delta. Curr Biol. 2006; 16:202–7. 10.1016/j.cub.2005.12.002. - DOI - PubMed
    1. Fresco JR, Alberts BM The accommodation of noncomplementary bases in helical polyribonucleotides and deoxyribonucleic acids. Proc Natl Acad Sci USA. 1960; 46:311–21. 10.1073/pnas.46.3.311. - DOI - PMC - PubMed

LinkOut - more resources