. 2025 Sep;12(5):e200451.
doi: 10.1212/NXI.0000000000200451. Epub 2025 Jul 22.

KFLC to Total CSF Protein Ratio Is an Alternative to KFLC Index to Diagnose Multiple Sclerosis: A Retrospective Study of 814 Cases

Affiliations

KFLC to Total CSF Protein Ratio Is an Alternative to KFLC Index to Diagnose Multiple Sclerosis: A Retrospective Study of 814 Cases

Estelle Moschetti et al. Neurol Neuroimmunol Neuroinflamm. 2025 Sep.

Abstract

Background and objectives: Biological analyses are crucial for diagnosing multiple sclerosis (MS), notably detection of oligoclonal bands (OCBs) of immunoglobulin G in CSF. Kappa free light chain (KFLC) quantification in serum and CSF has recently been proposed as an additional test. In a rational medicoeconomic approach, identifying algorithms or biomarkers is important. The objective of this study was, therefore, to evaluate the correlation between CSF kappa free light chain (KFLCCSF)/total CSF protein ratio (KFLCCSF/ProtCSF) and OCB status and its performance in diagnosing MS.

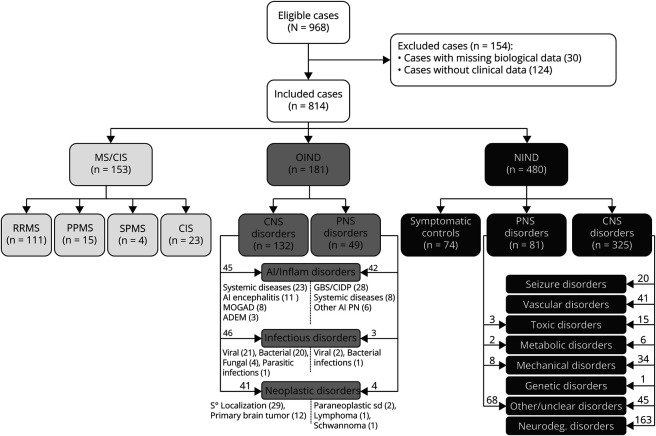
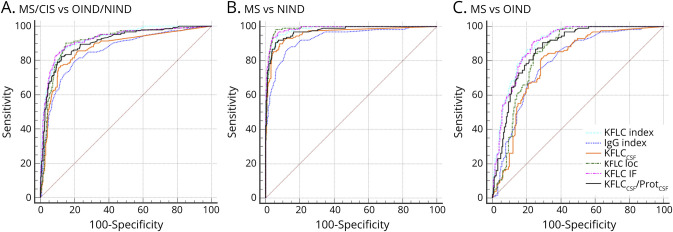
Methods: KFLC measurements were performed prospectively with each OCB analysis, and the data were interpreted retrospectively. A total of 814 clinical cases were included: 153 with MS or clinically isolated syndrome (CIS), 181 with other inflammatory neurologic diseases, and 480 with noninflammatory neurologic diseases. Performances of KFLCCSF/ProtCSF in predicting OCB status, diagnosing MS, and estimating evolution of CIS to MS were evaluated and compared with those of other KFLC parameters, i.e., KFLC index, and with OCB and IgG parameters.

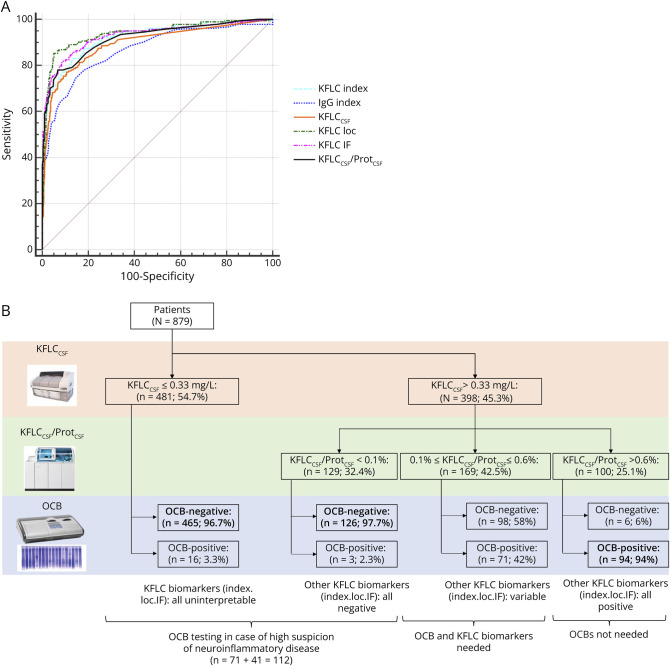
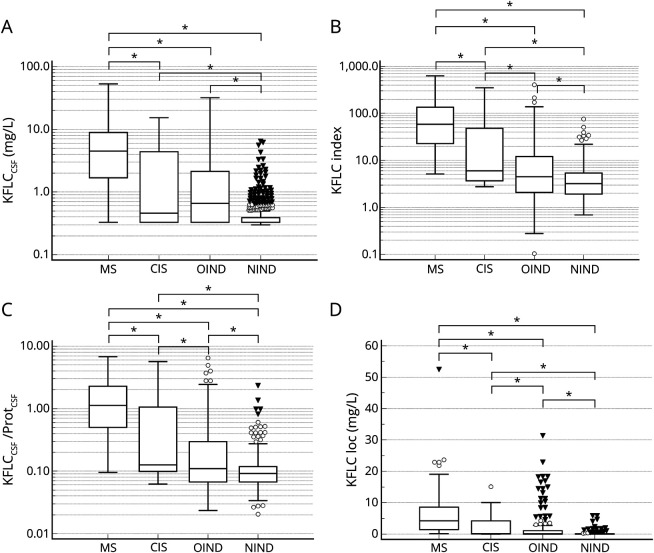
Results: KFLCCSF/ProtCSF and KFLC index performed similarly in predicting OCB status, with a sensitivity of 80.2% and a specificity of 93.4% at a threshold >0.21% for KFLCCSF/ProtCSF (area under the curve: 0.93). The percentage of agreement between OCB status and KFLCCSF/ProtCSF was 91.2%. Using KFLCCSF and KFLCCSF/ProtCSF initially could reduce OCB testing by 68% and quantitative tests by 48.4%. For diagnosing MS/CIS, KFLCCSF/ProtCSF performed similar to or slightly worse than the KFLC index but always outperformed IgG, OCB, and KFLCCSF. For this indication, the optimal threshold for KFLCCSF/ProtCSF was >0.24%. It is important to note that KFLCCSF/ProtCSF was the most predictive parameter for CIS progression to MS.

Discussion: To conclude, KFLCCSF/ProtCSF is as an easier and cost-effective alternative for predicting OCB status and CIS progression to MS and assisting in the diagnosis of MS.

Classification of evidence: This study provides Class II evidence that the KFLCCSF/ProteinCSF ratio accurately distinguishes patients with CSF OCBs from those without CSF OCBs and patients with MS from those with other neurologic disorders.


Conflict of interest statement

E. Moschetti, M. Venet, L. Thibaudin, and A. Moreau report no disclosures; P. Gonzalo declare no competing interests. Y. Tholance reports personal fees from The Binding Site and Alexion, outside of the submitted work. J.P. Camdessanché reports personal fees for lectures, consulting, writing of articles, or training courses from Akcea, Alnylam, Biogen, CSL Behring, Genzyme, Laboratoire Français des Biotechnologies, Merck, Novartis, Pfizer, Pharmalliance, Teva, Editions Scientifiques L&C, Edimark, Expression Santé, Natus, Scien, SNF-Floerger, outside of the submitted work, and is holding a patent on anti-fibroblast growth factor receptor 3 (FGFR3) and argonaute (AGO) autoantibodies. Go to Neurology.org/NN for full disclosures.

Figures

Figure 1
Figure 1. Inclusion of Patient Flowchart
ADEM = acute disseminated encephalomyelitis; AI/Inflam = autoimmune/inflammatory; CIDP = chronic inflammatory demyelinating polyradiculoneuropathy; CIS = isolated clinical syndrome; GBS = Guillain-Barré syndrome; MOGAD = myelin oligodendrocyte glycoprotein antibody–associated disease; MS = multiple sclerosis; Neurodeg. = neurodegenerative; NIND = noninflammatory neurologic disease; OIND = other inflammatory neurologic disease; PN = peripheral neuropathies; PNS = peripheral nervous system; PPMS = primary progressive MS; RRMS = relapsing-remitting MS; S = secondary; SPMS = secondary progressive MS.
Figure 2
Figure 2. KFLC Biomarker Box Plots Based on the OCB Status
The figure depicts the distribution of KFLCCSF values (A), KFLC index values (B), KFLCCSF/ProtCSF values (C), and KFLC loc values (D) in the form of box plots for the 3 patient groups depending on the OCB status (OCB-, OCB 1b, and OCB+). Significant differences (p < 0.05) between the different groups are indicated by the asterisk (*) above the brackets showing the groups. Values represented by circles, squares, or triangles correspond to data points outside the group's distribution (below/above the lower/upper quartile ±1.5 [circles] or 3 [triangles or squares] times the interquartile range). For better visibility, data for KFLCCSF, KFLC index, and the KFLCCSF/ProtCSF are shown using a logarithmic scale. KFLC = kappa free light chain; KFLC IF = proportion of KFLC synthesized in the CSF; KFLC loc = concentration of KFLC synthesized in the CSF; OCBs = oligoclonal bands; OCB- = negative OCB test (no oligoclonal IgG bands in the CSF); OCB 1b = presence of a single oligoclonal IgG band in the CSF; OCB+ = presence of at least 2 oligoclonal IgG bands in the CSF; Prot = proteins.
Figure 3
Figure 3. ROC Curves of KFLC Biomarkers and IgG Index in Predicting OCB Status (A) and Proposal of a Biological Algorithm Using KFLCCSF/ProtCSF to Highlight Intrathecal Synthesis (B)
The figure shows the ROC curves for KFLC parameters and the IgG index (A) and the results that would have been obtained using a biological algorithm with KFLCCSF and KFLCCSF/ProtCSF in this study. The first step of the algorithm displayed in panel B depends on the value of KFLCCSF, which must be higher than the limit of quantification (LOQ = 0.33 mg/L). Of the 879 samples included in the study, 54.7% had KFLCCSF value below LOQ. For all these samples, KFLC biomarkers were all uninterpretable and the OCBs were negative in the most of them (96.7%) but were positive in 16 patients. For the 45.3% of samples with KFLCCSF >0.33, KFLCCSF/ProtCSF was calculated. Most samples with ratio <0.1% (yielding the highest sensitivity while maintaining specificity >50%) had OCB-negative status (97.7%), but 3 of them had OCB-positive status. However, in these 3 patients, other KFLC biomarkers were also negative (no discrepancy). Most patients with ratio >0.6% (giving the highest specificity while maintaining sensitivity >50%) had OCB-positive status (94%), but 6 of them had OCB-negative status. The other KFLC biomarkers were all positive in these 6 patients (no discrepancy). The other patients with a ratio between 0.1 and 0.6 had variable OCB status (58% positive one and 42% negative one). In this subgroup, the interpretation of the other KFLC biomarkers could be different from that based on KFLCCSF/ProtCSF. Finally, it seems reasonable to recommend a complete biological panel (OCB and all blood and CSF measurements to calculate other KFLC biomarkers) only in the following cases: KFLCCSF <0.33 mg/L; KFLCCSF/ProtCSF value <0.1% combined with high suspicion of neuroinflammatory disease; and KFLCCSF/ProtCSF value between 0.1% and 0.6%. FP = false positive; IgG = immunoglobulin G; KFLC = kappa free light chain; KFLC IF = proportion of KFLC synthesized in the CSF; KFLC loc = concentration of KFLC synthesized in the CSF; OCB = oligoclonal band; OPA = overall percentage of agreement between OCB and the studied parameter; Prot = proteins.
Figure 4
Figure 4. Box Plots of KFLC and IgG Parameters by Clinical Classification
The figure illustrates the distribution of KFLCCSF (A), KFLC index (B), KFLCCSF/ProtCSF (C), and KFLC loc (D) values in the 4 groups of patients: MS, CIS, OIND, and NIND. Significant differences (p < 0.05) between the different groups are indicated by the asterisk (*) above the brackets showing the groups. Values represented by circles or triangles correspond to values outside the group's distribution (below/above the lower/upper quartile ±1.5 [circles] or 3 [triangles] times the interquartile range). For better visibility, the data for KFLCCSF, KFLC index, and KFLCCSF/ProtCSF are shown using a logarithmic scale. Abbreviations: CIS = clinically isolated syndrome; KFLC = kappa free light chain; KFLC loc = concentration of KFLC synthesized in the brain in CSF; MS = multiple sclerosis; NIND = noninflammatory neurologic disease; OIND = other inflammatory neurologic disease; Prot = total proteins.
Figure 5
Figure 5. ROC Curves of the Biological Biomarkers in Predicting the Diagnosis of Specific Clinical Groups
The figure displays ROC curves for KFLC and IgG index parameters to distinguish between MS/CIS groups and OIND and NIND groups (A), to differentiate the MS group from the NIND group (B), and to differentiate the MS group from the OIND group (C). Abbreviations: CIS = clinically isolated syndrome; IgG = Immunoglobulin G; KFLC = free kappa light chain; KFLC IF = proportion of KFLC synthesized in the CSF; KFLC loc = concentration of KFLC synthesized in the CSF; MS = multiple sclerosis; NIND = noninflammatory neurologic disease; OIND = other inflammatory neurologic disease.

Similar articles

References

    1. Association des Collèges des Enseignants d'Immunologie des Universités de Langue française. Item 125: Sclérose en plaques 2011 2012.
    1. Deisenhammer F, Zetterberg H, Fitzner B, Zettl UK. The cerebrospinal fluid in multiple sclerosis. Front Immunol. 2019;10:726. doi: 10.3389/fimmu.2019.00726 - DOI - PMC - PubMed
    1. Poser CM, Paty DW, Scheinberg L, et al. New diagnostic criteria for multiple sclerosis: guidelines for research protocols. Ann Neurol. 1983;13(3):227-231. doi: 10.1002/ana.410130302 - DOI - PubMed
    1. Mcdonald WI, Compston A, Edan G, et al. Recommended diagnostic criteria for multiple sclerosis: guidelines from the international panel on the diagnosis of multiple sclerosis. Ann Neurol. 2001;50(1):121-127. doi: 10.1002/ana.1032 - DOI - PubMed
    1. Polman CH, Reingold SC, Banwell B, et al. Diagnostic criteria for multiple sclerosis: 2010 Revisions to the McDonald criteria. Ann Neurol. 2011;69(2):292-302. doi: 10.1002/ana.22366 - DOI - PMC - PubMed