. 2025 Jul 19;53(14):gkaf624.
doi: 10.1093/nar/gkaf624.

Mouse metastable epialleles are extremely rare

Affiliations

Mouse metastable epialleles are extremely rare

Chathura J Gunasekara et al. Nucleic Acids Res. .

Abstract

Metastable epialleles (MEs) are genomic loci at which epigenetic marks are established stochastically during early embryonic development and maintained during subsequent differentiation and throughout life, leading to stable epigenetic and phenotypic variation among genetically identical individuals. Although MEs were first described in mice over 20 years ago, the extent of epigenetic metastability in the mouse genome remains unknown. We present the first unbiased genome-wide screen for MEs in mice. Using deep whole-genome bisulfite sequencing across tissues derived from the three embryonic germ layers in isogenic C57BL/6J mice, we identified only 29 MEs, precisely localizing them and documenting their rarity. Consistent with recent findings, we found no effects of maternal dietary methyl donor supplementation on ME methylation in the offspring, challenging previous assertions that MEs generally exhibit developmental plasticity. Most but not all MEs are associated with intracisternal A-particle (IAP) elements, tending to localize to the 5' end of the IAP. Additionally, we discovered autosomal regions at which systemic interindividual variation in DNA methylation is associated with sex, providing insights into sex-associated epigenetic development that apparently precedes sexual differentiation. Our findings indicate that expression of transcription factors, including CCCTC-binding factor (CTCF) and specific KRAB zinc finger proteins during early embryonic development, plays a key role in orchestrating stochastic establishment and/or maintenance of DNA methylation at metastable transposable elements. Overall, these findings advance our understanding of the genomic determinants of epigenetic metastability and suggest that interindividual epigenetic variation at MEs is unlikely to be a major determinant of phenotypic variation among isogenic mice.


Conflict of interest statement

None declared.

Figures

Graphical Abstract
Graphical Abstract
Figure 1.
Figure 1.
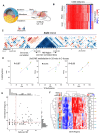
Screen for SIV identifies a small number of MEs, but also sex-associated SIV regions (SASIVs). (A) In each of 10 mice, genomic DNA from liver, kidney, and cerebral cortex was profiled by deep WGBS, yielding 30 methylomes. These tissues represent the three embryonic germ layer lineages. (B) Unsupervised clustering of bin-level average methylation (random sample of 10 000 100-bp bins) groups the 30 samples by tissue. (C) Step 1 of the SIV screen identified blocks of correlated methylation. One such block at the Snd1 gene body is shown; the blue triangle indicates correlated methylation across 12 100-bp bins. The color of each small square indicates correlation of methylation across adjacent 100 bp bins. (D) Step 2 of the screen assessed inter-tissue correlations (ITCs) of block-level average methylation. Each point represents one mouse. Here, all three ITCs at the Snd1 gene body are ≥0.71 (R2 ≥ 0.5) identifying it as an SIV region. (E) Interindividual methylation range vs. number of CpGs per block for all genomic blocks satisfying the SIV criteria. We focused on those including at least 5 CpGs and yielding an interindividual range ≥ 20% (dashed lines). (F) Consistent with their systemic nature, unsupervised clustering of average methylation at these 36 SIV regions groups the 30 libraries by individual. Also note separation by sex. The colors indicating individual mice are consistent across panels D and F.
Figure 2.
Figure 2.
Some multimodal SIV regions reflect sex differences in DNA methylation. Each row shows WGBS data on one genomic region. (A  –C) CpG-level methylation in liver samples at (A) sex-associated SIV region (SASIV) 5_10 111_Gm22011, (B) SASIV 6_17 515_C1s2 and (C) SASIV 6_13 992_Gm44169. Each color represents a mouse (females—dotted lines; males solid lines). (D  –F) At SASIVs, most heterogeneity of methylation occurs among DNA molecules. Tanghulu plots portray read-level methylation patterns (in kidney) for the segments of SASIVs showing sex differences in methylation; data are shown for one male and one female mouse; each row represents a WGBS sequencing read, and each column a CpG site. Filled circles depict methylated CpGs. (GI) Box plots representing methylation haplotype load (MHL) of brain, kidney, and liver at SASIVs. MHL was calculated over the same genomic coordinates as shown in D–F. MHL is higher in females than males in all three tissues (P= 3.2 × 10−17, 1.5 × 10−6, and 1.0 × 10−7 in panels G, H and I, respectively).
Figure 3.
Figure 3.
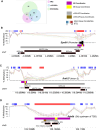
Several MEs we identified overlap previously discovered cVM-IAPs. (A) Venn diagram representing genomic coordinate overlap between all 29 mouse MEs, cVM-IAPs, and ERViiDMRs. The legend to the right is for panels B-D, which portray MEs identified in or near (B) Eps8l1, (C) Rab6b, and (D) Rnf157, respectively. Above each, the ITC heat map indicates the minimum block-level inter-tissue correlation (of brain versus liver, kidney versus liver, and kidney versus brain). Purple and gray bars indicate the locations of MEs identified by our screen and cVM-IAPs described by Elmer et al. [27], and the yellow and brown segments indicate the assay coordinates used for their validation, respectively. Dot plots show bin-level % methylation data in each region (from WGBS) for each of the 10 mice in our screen. The RepeatMasker track shows the ERV LTR subclasses in the vicinity of each ME.
Figure 4.
Figure 4.
No significant effects of maternal dietary methyl donor supplementation on offspring ME methylation were observed. Box plots summarize methylation data for each of 13 control litters (48 mice total, yellow) and 12 supplemented litters (48 mice total, teal). A–F show box plots of % methylation in liver within ME regions overlapping or near Snd1, Rims2, Rab6b, Ahi1, Eps8l1, and Rnf157, respectively.
Figure 5.
Figure 5.
Murine MEs are associated with specific classes of LTR transposable elements. (A) Heatmap summarizing counts of different classes of transposable elements directly overlapping SIV regions. Each column represents one of the 35 SIV regions; dotted lines separate MEs, multimodal MEs (mMEs), and sex-associated SIV regions (SASIVs). (B) Analogous heatmap for matched control regions (three control regions for each SIV region), in the same order as their matching SIV regions in panel A. Compared to control regions, MEs are enriched for long terminal repeats (LTRs) (paired t-test, P = 0.0005). (C) Heatmap summarizing counts of different LTR subfamilies overlapping SIV regions. (D) Analogous heatmap for matched control regions, in the same order as in panel C. Compared to control regions, MEs are enriched for IAPEz-int and IAPLTR1 elements (PIAPEz-int= 0.02, PIAPLTR1= 0.003). (E) Bar plot representing proportions of autosomal cVM-IAPs, MEs, multimodal MEs (mMEs), SASIVs and control regions that directly overlap various ERV subfamilies. Only subfamilies with a proportion ≥ 0.1 in at least one category are shown. Bars sum to > 1.0 because LTR overlaps are not mutually exclusive. Pie charts (inset) show the percentages of ERV overlaps for each category.

References

    1. Rakyan VK, Blewitt ME, Druker R et al. Metastable epialleles in mammals. Trends Genet. 2002; 18:348–51. 10.1016/S0168-9525(02)02709-9. - DOI - PubMed
    1. Dickies MM A new viable yellow mutation in the house mouse. J Hered. 1962; 53:84–6. 10.1093/oxfordjournals.jhered.a107129. - DOI - PubMed
    1. Waterland RA, Jirtle RL Transposable elements: targets for early nutritional effects on epigenetic gene regulation. Mol Cell Biol. 2003; 23:5293–300. 10.1128/MCB.23.15.5293-5300.2003. - DOI - PMC - PubMed
    1. Duhl DM, Vrieling H, Miller KA et al. Neomorphic agouti mutations in obese yellow mice. Nat Genet. 1994; 8:59–65. 10.1038/ng0994-59. - DOI - PubMed
    1. Vasicek TJ, Zeng L, Guan XJ et al. Two dominant mutations in the mouse fused gene are the result of transposon insertions. Genetics. 1997; 147:777–86. 10.1093/genetics/147.2.777. - DOI - PMC - PubMed