. 2025 Jul 19;53(14):gkaf694.
doi: 10.1093/nar/gkaf694.

Identification of regulatory sequences in Aca11 and Aca13 for detection of anti-CRISPR and protein-protein interaction

Affiliations

Identification of regulatory sequences in Aca11 and Aca13 for detection of anti-CRISPR and protein-protein interaction

Guoxu Song et al. Nucleic Acids Res. .

Abstract

Anti-CRISPR (Acr) proteins are frequently co-encoded with the anti-CRISPR associated (Aca) proteins, which act as repressors for regulating Acr expression within acr-aca operons. We previously identified three aca genes (aca11-13) from Streptococcus mobile genetic elements, but their regulatory mechanisms remained unclear. Here, we showed that Aca11 and Aca13 mediate bidirectional regulation in acr-aca operons through recognition of their inverted repeat (IR) sequences within the acr promoters. Based on the bioinformatics search using Aca13 with its IR sequences, we discovered a novel type II-A Acr (named AcrIIA35). AcrIIA35 exhibits a potent inhibitory activity against St1Cas9 by interfering with DNA recognition of Cas9 in bacterial and human cells. We also developed a novel Aca-driven protein-protein interaction detection (APID) system by integrating Aca-tagged target proteins with fluorescently labeled IR-DNA probes. The APID system enables efficient detection of protein-protein interaction using proteins or crude cell lysates. Utilizing the APID system, we have further elucidated the mechanism of AcrIIA24, which can interact with the HNH nuclease domain of St3Cas9 to inhibit the DNA cleavage activity of Cas9. Collectively, our work expands the understanding of Aca functions to modulate Acrs and expands the potential for Aca-based applications in CRISPR technologies.


Conflict of interest statement

None declared.

Figures

Graphical Abstract
Graphical Abstract
Figure 1.
Figure 1.
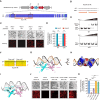
The multifunctional regulatory roles of Aca11 and Aca13 in acr-aca operons. (A) Genomic organization of representative acr-aca operons (see Supplementary Fig. S1 for complete schematic). Acr genes are annotated with subtypes and numbers (e.g. IF1 denotes AcrIF1). (B) Schematic view of acr-aca11 locus and engineered plasmid constructs for assessing Aca11-mediated regulation of acr-aca11 promoters (Aca11-s1 and -s2) in E. coli. Acr genes are shown with numbers corresponding to AcrIIA numbers. HTH and AP2 DNA-binding motifs were identified using HHpred (see the “Materials and methods” section). AmpR, ampicillin resistance; KanR, kanamycin resistance. (C) Representative colony pictures of E. coli expressing mCherry under the control of acr-aca11 promoters (Aca11-s1 and -s2) in the presence or absence of Aca11 protein. Bright field (BF) and mCherry fluorescence channels are displayed on the left side of each row. (D) Quantitative analysis of mCherry fluorescence driven by acr-aca11 promoters. Bar graphs depict the median mCherry fluorescence values, normalized to the corresponding promoter controls without Aca11. Error bars represent mean ± SEM from three biological replicates. Statistical significance (***P < .001) was determined by unpaired t-test. (E) Schematic view of the genomic context of acr-aca13 locus, including acr genes, aca13 gene, and other neighboring genes (annotated based on NCBI database information). Schematic of the plasmids designed for the assay to measure regulation of the acr-aca13 promoters (Aca13-s1 and -s2) by AcrIIA32 (Aca13 fused in the C-terminal portion of AcrIIA32) in E. coli. (F) Domain architectures of AcrIIA32 protein, an Acr-Aca fusion protein. The protein comprises an N-terminal anti-CRISPR domain (A32NTD) and a C-terminal Aca13 domain (A32CTD). (G) Representative colony pictures of E. coli expressing mCherry under acr-aca13 promoters (Aca13-s1 and -s2) in the presence or absence of AcrIIA32, A32NTD, or A32CTD proteins. BF and mCherry fluorescence channels are displayed on the left side of each row. (H) Bar graphs show the median mCherry fluorescence values (normalized to promoter controls without AcrIIA32) under different AcrIIA32 variants. Error bars represent mean ± SEM from three biological replicates. Statistical significance was determined by unpaired t-test (***P< .001; n.s., not significant).
Figure 2.
Figure 2.
Aca11 recognizes conserved IRs within the acr-aca11 promoters. (A) Nucleotide sequence alignment of acr-aca11 promoters (Aca11-s1 and -s2), spanning 80 bp upstream of the acr start codon. Predicted promoter elements, including the −10 and −35 regions, are highlighted by black boxes. IRs are denoted by orange boxes with arrowheads indicating their orientation. (B) Wild-type (WT) and scrambled IR (scIR) sequences in Aca11-s1 promoter context. Sequences of nucleotide substitutions in scIR mutant are shown in red. (C) Representative colony pictures of E. coli expressing mCherry under the control of Aca11-s1 (WT or scIR) promoters with or without Aca11 co-expression. BF and mCherry fluorescence channels are displayed on the left side of each row. (D) Bar graphs depict the median mCherry fluorescence values, normalized to the corresponding promoter controls without Aca11. Error bars represent mean ± SEM from three biological replicates. Statistical significance was determined by unpaired t-test (***P< .001; n.s., not significant). (E) EMSAs of the Aca11–DNA interactions with increasing concentrations (100, 200, 400, and 800 nM) of Aca11 indicated by black triangles. The assays were analyzed on the non-denaturing gel with Cy5-labeled WT/scIR probes (see Supplementary Fig. S4A). The gels are representative of three independent replicates. (F) The sequence of 24-bp Aca11-IR DNA used for molecular modeling. The core motif regions are highlighted. (G) AlphaFold 3-predicted structure of dimeric Aca11 in complex with 24-bp DNA [shown in panel (F)]. (H) Surface view of Aca11–IR complex with electrostatic potential (blue, positively charged; red, negatively charged). Aca11 exhibits a positively charged surface docked by IR DNA. (I) Spatial arrangement of key residues Y18, Q28, and R39 potentially engaged in base-specific contacts with palindromic motifs. (J) Representative colony pictures of E. coli expressing mCherry under the control of Aca11-s2 promoter in the presence of diverse Aca11 mutants. (K) Bar graphs depict the median mCherry fluorescence values of diverse Aca11 mutants, normalized to no Aca11 control. Error bars represent mean ± SEM from three biological replicates. Statistical significance was determined by unpaired t-test (***P< .001).
Figure 3.
Figure 3.
Aca13 domain in C-terminal of AcrIIA32 acting on conserved IRs within acr-aca13 promoters. (A) Nucleotide sequence alignment of Aca13-s1 and Aca13-s2 promoters (80 bp upstream of the acr start codon). Two predicted palindromic IRs (IR1: green box; IR2: orange box) are shown with arrowheads indicating their orientation. (B) Sequences of the WT IR and mutated IR (scIR1 and scIR2) of Aca13-s1 promoter. scIR sequences are shown in red. EMSAs of the Cy5-labeled WT (C), scIR1 (D), and scIR2 (E) DNA probe of Aca13-s1 with increasing concentrations (100, 200, 400, and 800 nM) of AcrIIA32, A32NTD, or A32CTD proteins indicated by black triangles. The assays were analyzed on the non-denaturing gel with three independent replicates. (F) The sequence of 18-bp Aca13-IR DNA used for structural modeling. The core motif regions are highlighted. (G) AlphaFold 3-predicted structure of dimeric A32CTD in complex with 18-bp DNA [shown in panel (F)]. (H) Surface view of A32CTD-IR complex with electrostatic potential (blue, positively charged; red, negatively charged). A32CTD exhibits a positively charged surface docked by IR DNA. (I) Spatial arrangement of key residues K92, W99, R107, and S111 of A32CTD potentially engaged in base-specific contacts with palindromic motifs. (J) Representative colony pictures of E. coli expressing mCherry under the control of Aca13-s2 promoter in the presence of diverse A32CTD mutants. (K) Bar graphs depict the median mCherry fluorescence values of diverse A32CTD mutants, normalized to no A32CTD control. Error bars represent mean ± SEM from three biological replicates. Statistical significance was determined by unpaired t-test (***P< .001).
Figure 4.
Figure 4.
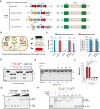
A novel type II-A Acr (AcrIIA35) inhibiting St1Cas9 is identified by Aca13 with its IR sequences. (A) Schematic view of the genomic context of representative Aca13 loci from diverse Streptococcus phages and prophages. Candidate acr genes (shown in orange) and other neighboring genes (shown in gray and annotated by NCBI website or HHpred) are searched by aca13 (shown in blue). Acr genes are shown in red with numbers corresponding to AcrIIA numbers. acr-aca promoters (s11–s18) are highlighted by boxes and core sequences are shown with the −10 and −35 elements (green shading) and identified IRs (orange boxes) in the right panel. (B) Schematic view of the PICI system to characterize novel anti-CRISPR proteins. (C) Bar graphs show the calculated transformation efficiency of Acrs and Acr candidates against St1Cas9 in E. coli as colony forming units per 25 ng of each plasmid DNA (left panel in C). Bar graphs show the median mCherry fluorescence value of Acrs, which were normalized to each Acr with mismatching spacer control (right panel in C). Error bars represent the mean ± SEM with three biological replicates. Sign “#” represents “below detection limit of this assay”. *P < .05, **P < .01, and ***P < .001, determined by unpaired t-test. n.s., not significant. (D) DNA cleavage assays targeting linearized plasmid DNA by St1Cas9 in the presence or absence of Acrs. Open and closed arrowheads indicate intact substrate and cleavage products, respectively. Representative data from triplicate experiments are shown. Representative gel images (E) and quantification of gene editing efficiencies (F) of T7E1 assay to manifest the inhibitory activities of Acrs against St1Cas9 in human cells. Error bars represent the mean ± SEM with three biological replicates. *P < .05, **P < .01, and ***P < .001, determined by unpaired t-test. n.s., not significant. (G) DNA EMSA assays were conducted to analyze the effect of AcrIIA35 on DNA binding of St1Cas9 RNP, when added prior to or after the addition of target DNA. Assays were conducted with St1Cas9 RNP (400 nM) and Acr titrations (4, 8, and 16 μM). The assays were analyzed on the non-denaturing gel with target DNA labeled by Cy5. The gels are representative of three independent replicates. (H) RNA EMSA assays were conducted to analyze the effect of AcrIIA35 on St1Cas9 binding to sgRNA, when Acrs were added prior to or after the addition of sgRNA. The gels are representative of three independent replicates.
Figure 5.
Figure 5.
Establishment of Aca-based EMSAs for protein–protein interaction detection. (A) Schematic view of the APID system based on EMSAs in this study. The target protein is conjugated with Aca13, which can specifically bind to fluorescently labeled Aca13 probe. Free and protein-bound probe can be separated in the non-denaturing polyacrylamide gel after electrophoresis. (B) Schematic view of AcrIIA35-Aca13 constructs. A glycine- and serine-rich linker (32aa) connects the Acr and Aca terminus. (C) Experimental workflow of AcrIIA35-Aca13 hybrid expression and purification from E. coli. Supernatant of cell lysis and proteins of AcrIIA35-Aca13 were used for subsequent EMSAs in panels (D) and (E). DNA EMSA assays of APID system were conducted with AcrIIA35-Aca13 protein (D) or AcrIIA35-Aca13 supernatant of cell lysis (E). Lanes 4 and 8 contain the purified AcrIIA35-Aca13 proteins as controls. Hollow arrowheads indicate shifted protein–DNA complex of AcrIIA35-Aca13 with Aca13 probe. AcrIIA35 can only bind to sgRNA-bound St1Cas9, leading to a DNA supershift. The gels are representative of three independent replicates. (F) Summary of the inhibitory mechanism identified in this study. For AcrIIA35, it binds solely to sgRNA-bound Cas9 to block the binding of Cas9 to target DNA. In contrast, AcrIIA24 abrogates the DNA cleavage activity of Cas9.
Figure 6.
Figure 6.
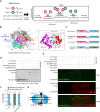
Detection of AcrIIA24 binding to the HNH domain of St3Cas9 using the optimized APID system. (A) Schematic view of the optimized APID (APID-v2) system. This system is constructed using Aca11 and Aca13 proteins along with doubly fluorescent-labeled probes. Supershifted DNA band indicates the co-localization of protein–protein interaction complexes. (B) AlphaFold 3-predicted structure of St3Cas9–gRNA–DNA–AcrIIA24 complex. AcrIIA24 comprises two α-helices and five β-sheets and bounds to the HNH domain of St3Cas9. The loop (E32–D38) between β1 and β2 sheets represents key residues engaged in interaction. (C) Schematic view of Aca-tagged protein constructs. Acr subtypes and numbers are indicated. A, AcrIIA; C, AcrIIC. (D) DNA EMSA assays were conducted with supernatant of cell lysis from E. coli expressing Acr-Aca13 and St3_HNH-Aca11 fusion proteins, in the presence of FAM-labeled Aca11 probe. The gels are representative of three independent replicates. (E) DNA EMSA assays of APID-v2 system were performed using the supernatant of cell lysis from E. coli expressing Acr-Aca13 and St3_HNH-Aca11 hybrids. Both FAM-labeled Aca11 probe and Cy5-labeled Aca13 probe were used in the assay. Asterisk indicates the supershifted DNA band, which demonstrates the co-localization of Aca11 and Aca13 probes bound by AcrIIA24-St3_HNH interaction complexes. (F) Bar graphs show the calculated transformation efficiency of AcrIIA24 variants against St3Cas9 in E. coli as colony forming units per 25 ng of each plasmid DNA. Error bars represent the mean ± SEM with three biological replicates. Sign “#” represents “below detection limit of this assay.” *P < .05, **P < .01, and ***P < .001, determined by unpaired t-test. n.s., not significant. (G) Schematic view of the inhibition mechanism of AcrIIA24. AcrIIA24 prevents Cas9 from DNA cleavage by binding to the HNH domain of Cas9.

Similar articles

References

    1. Mayo-Munoz D, Pinilla-Redondo R, Birkholz N et al. A host of armor: prokaryotic immune strategies against mobile genetic elements. Cell Rep. 2023; 42:112672. 10.1016/j.celrep.2023.112672. - DOI - PubMed
    1. Garneau JE, Dupuis ME, Villion M et al. The CRISPR/Cas bacterial immune system cleaves bacteriophage and plasmid DNA. Nature. 2010; 468:67–71. 10.1038/nature09523. - DOI - PubMed
    1. Wang JY, Doudna JA CRISPR technology: a decade of genome editing is only the beginning. Science. 2023; 379:eadd8643. 10.1126/science.add8643. - DOI - PubMed
    1. Wang JY, Pausch P, Doudna JA Structural biology of CRISPR–Cas immunity and genome editing enzymes. Nat Rev Microbiol. 2022; 20:641–56. 10.1038/s41579-022-00739-4. - DOI - PubMed
    1. Makarova KS, Wolf YI, Iranzo J et al. Evolutionary classification of CRISPR–Cas systems: a burst of class 2 and derived variants. Nat Rev Microbiol. 2020; 18:67–83. 10.1038/s41579-019-0299-x. - DOI - PMC - PubMed

MeSH terms

Substances

LinkOut - more resources