. 2025 Aug 19;6(8):102242.
doi: 10.1016/j.xcrm.2025.102242. Epub 2025 Jul 21.

TME-guided deep learning predicts chemotherapy and immunotherapy response in gastric cancer with attention-enhanced residual Swin Transformer

Affiliations

TME-guided deep learning predicts chemotherapy and immunotherapy response in gastric cancer with attention-enhanced residual Swin Transformer

Shengtian Sang et al. Cell Rep Med. .

Abstract

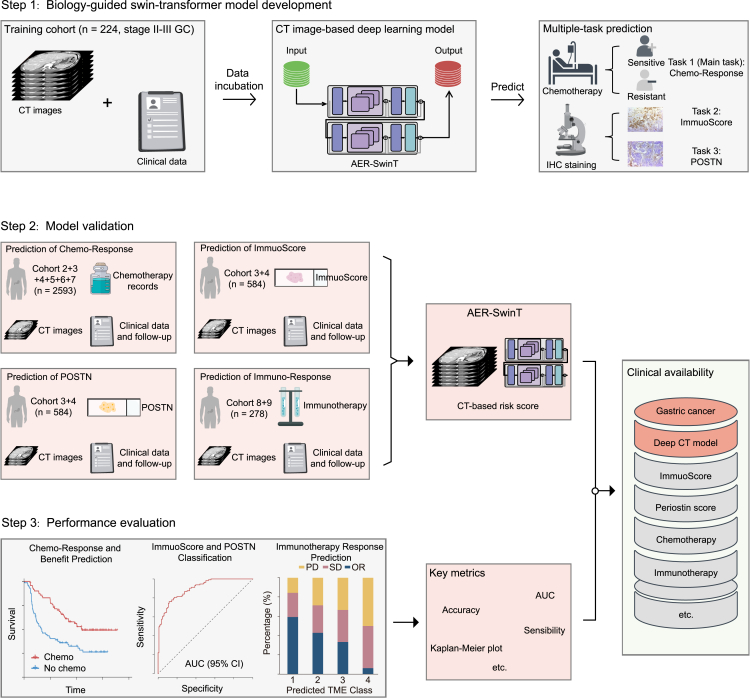
Adjuvant chemotherapy and immune checkpoint blockade exert quite durable anti-tumor responses, but the lack of effective biomarkers limits the therapeutic benefits. Utilizing multi-cohorts of 3,095 patients with gastric cancer, we propose an attention-enhanced residual Swin Transformer network to predict chemotherapy response (main task), and two predicting subtasks (ImmunoScore and periostin [POSTN]) are used as intermediate tasks to improve the model's performance. Furthermore, we assess whether the model can identify which patients would benefit from immunotherapy. The deep learning model achieves high accuracy in predicting chemotherapy response and the tumor microenvironment (ImmunoScore and POSTN). We further find that the model can identify which patient may benefit from checkpoint blockade immunotherapy. This approach offers precise chemotherapy and immunotherapy response predictions, opening avenues for personalized treatment options. Prospective studies are warranted to validate its clinical utility.

Keywords: chemotherapy response; immunotherapy; medical imaging; multitask Swin Transformer; tumor microenvironment.


Conflict of interest statement

Declaration of interests The authors declare no competing interests.

Figures

None
Graphical abstract
Figure 1
Figure 1
Workflow of the study Pretreatment CT images were retrospectively retrieved to develop and validate the multitask Swin Transformer for non-invasive prediction of chemotherapy response and the tumor microenvironment, which was further used to evaluate the prognosis and response to immunotherapy. Immunotherapy response outcomes are represented as percentage. Cohort 1–3 and 8 from SMU: Nanfang Hospital of Southern Medical University. Cohort 4–5 from SYSUCC: Sun Yat-sen University Cancer Center. Cohort 6 from YNCH: Yunnan Cancer Hospital. Cohort 7 from KMU: First Affiliated Hospital of Kunming Medical University. Cohort 9 from GPHCM: Guangdong Provincial Hospital of Chinese Medicine.
Figure 2
Figure 2
Architecture of AER-SwinT and intermediate attention maps (A) The illustration of the comprehensive architecture of AER-SwinT. The model processes CT images through multiple stages to extract hierarchical features and integrate attention mechanisms. (B) The intermediate attention maps generated by the AER-SwinT model at various stages. It can be observed that as the model progresses through these stages, it produces more global attention, enabling a comprehensive understanding of the spatial and contextual information within the images.
Figure 3
Figure 3
Diagnostic accuracy of the deep learning model in the training cohort, internal validation cohort 1, and external validation cohorts 1–4 for predicting chemotherapy response The ROC curves show the performance for predicting chemotherapy response in stage II–III patients undergone adjuvant chemotherapy. Data are represented as AUC ± 95% CI. ROC, area under the receiver operator characteristic curve.
Figure 4
Figure 4
Diagnostic accuracy of the deep learning model in the training cohort, internal validation cohort 2, and external validation cohort 1 for predicting the TME classes defined at immunohistochemistry (A) The ROC curves show the performance for predicting the ImmunoScore in patients with stage II–III disease. (B) The ROC curves show the performance for predicting the POSTN in patients with stage II–III disease. Data are represented as AUC ± 95% CI. TME, tumor microenvironment; ROC, area under the receiver operator characteristic curve.
Figure 5
Figure 5
Predictive value of the proposed deep learning model for survival benefit from adjuvant chemotherapy on DFS (A) Kaplan-Meier curves of DFS for patients who are stratified according to receipt of chemotherapy in internal validation cohort after PSM. (B) Kaplan-Meier curves of DFS for patients who are stratified according to receipt of chemotherapy in external validation cohorts 1–2 after PSM. (C) Kaplan-Meier curves of DFS for patients who are stratified according to receipt of chemotherapy in external validation cohorts 3–4 after PSM. (D) Forest plot for the effect of chemotherapy vs. no chemotherapy on DFS among stage II patients after PSM. (E) Forest plot for the effect of chemotherapy vs. no chemotherapy on DFS among stage III patients after PSM. Data are represented as hazard ratio ± 95% CI. DFS, disease-free survival; PSM, propensity score matching.
Figure 6
Figure 6
Predictive value of the proposed deep learning model for survival benefit from adjuvant chemotherapy on OS (A) Kaplan-Meier curves of OS for patients who are stratified according to receipt of chemotherapy in internal validation cohort after PSM. (B) Kaplan-Meier curves of OS for patients who are stratified according to receipt of chemotherapy in external validation cohorts 1–2 after PSM. (C) Kaplan-Meier curves of OS for patients who are stratified according to receipt of chemotherapy in external validation cohorts 3–4 after PSM. (D) Forest plot for the effect of chemotherapy vs. no chemotherapy on OS among stage II patients after PSM. (E) Forest plot for the effect of chemotherapy vs. no chemotherapy on OS among stage III patients after PSM. Data are represented as hazard ratio ± 95% CI. OS, overall survival; PSM, propensity score matching.
Figure 7
Figure 7
Predictive value of the proposed deep learning model for therapeutic response and clinical outcomes in patients treated with anti-PD-1 immunotherapy (A) The objective response rate of immunotherapy in different predicted TME status in the SMU cohort. (B) The objective response rate of immunotherapy in different predicted TME status in the GPHCM cohort. (C) Prognostic value of the predicted TME classes for PFS in patients treated with anti-PD-1 immunotherapy. (D) Receiver operating characteristic curves of the predicted TME classes for predicting immunotherapy response in the SMU cohort. (E) Receiver operating characteristic curves of the predicted TME classes for predicting immunotherapy response in the GPHCM cohort. (F) The association between the predicted TME model and immunotherapy response or CPS. (G) Forest plot for the effect of predicted TME model and CPS in evaluating immunotherapy response. Immunotherapy response outcomes are represented as percentage. ROC outcomes are represented as AUC ± 95% CI. Logistic regression outcomes are represented as odds ratio ± 95% CI. PD, progressed disease; SD, stable disease; OR, objective response; TME, tumor microenvironment; Predicted TME class 1, predicted high ImmunoScore and low POSTN; Predicted TME class 2, predicted high ImmunoScore and high POSTN; Predicted TME class 3, predicted low ImmunoScore and low POSTN; Predicted TME class 4, predicted low ImmunoScore and high POSTN; CPS, combined positive score; SMU, Nanfang Hospital of Southern Medical University; GPHCM, Guangdong Provincial Hospital of Chinese Medicine.

References

    1. Joshi S.S., Badgwell B.D. Current treatment and recent progress in gastric cancer. CA Cancer J. Clin. 2021;71:264–279. - PMC - PubMed
    1. Zhang X., Liang H., Li Z., Xue Y., Wang Y., Zhou Z., Yu J., Bu Z., Chen L., Du Y., et al. Perioperative or postoperative adjuvant oxaliplatin with S-1 versus adjuvant oxaliplatin with capecitabine in patients with locally advanced gastric or gastro-oesophageal junction adenocarcinoma undergoing D2 gastrectomy (RESOLVE): an open-label, superiority and non-inferiority, phase 3 randomised controlled trial. Lancet Oncol. 2021;22:1081–1092. doi: 10.1016/S1470-2045(21)00297-7. - DOI - PubMed
    1. Noh S.H., Park S.R., Yang H.K., Chung H.C., Chung I.J., Kim S.W., Kim H.H., Choi J.H., Kim H.K., Yu W., et al. Adjuvant capecitabine plus oxaliplatin for gastric cancer after D2 gastrectomy (CLASSIC): 5-year follow-up of an open-label, randomised phase 3 trial. Lancet Oncol. 2014;15:1389–1396. doi: 10.1016/S1470-2045(14)70473-5. - DOI - PubMed
    1. Sundar R., Tan P. Genomic Analyses and Precision Oncology in Gastroesophageal Cancer: Forwards or Backwards? Cancer Discov. 2018;8:14–16. doi: 10.1158/2159-8290.CD-17-1295. - DOI - PubMed
    1. Janjigian Y.Y., Ajani J.A., Moehler M., Shen L., Garrido M., Gallardo C., Wyrwicz L., Yamaguchi K., Cleary J.M., Elimova E., et al. First-Line Nivolumab Plus Chemotherapy for Advanced Gastric, Gastroesophageal Junction, and Esophageal Adenocarcinoma: 3-Year Follow-Up of the Phase III CheckMate 649 Trial. J. Clin. Oncol. 2024;42:2012–2020. - PMC - PubMed

Substances