Meta-Analysis
. 2025 Jul;292(2051):20250350.
doi: 10.1098/rspb.2025.0350. Epub 2025 Jul 23.

Keeping up with climate change: have Arctic arthropods reached their phenological limits?

Affiliations
Meta-Analysis

Keeping up with climate change: have Arctic arthropods reached their phenological limits?

Hannah Sørine Gerlich et al. Proc Biol Sci. 2025 Jul.

Abstract

Many arthropods show earlier seasonal activity with warming, but these responses cannot continue indefinitely. Identifying such phenological thresholds is crucial for understanding limits to climate tracking and species persistence, but few studies test for breakpoints that may indicate physiological or ecological constraints. Using a 28-year time series, we examined breakpoint responses to snowmelt and temperature across 15 arthropod taxa in seven plots from high-Arctic Greenland, a region experiencing pronounced warming. Our meta-analysis found breakpoint responses in two of six phenological driver and event combinations: onset and peak activity advanced with earlier snowmelt until a threshold, beyond which the relationship levelled off. A breakpoint for peak activity in response to temperature disappeared when snowmelt was included in the model, underscoring the importance of considering several environmental cues to prevent incorrect inferences about plasticity limits. Most responses showed no evidence of a breakpoint in phenological sensitivity, instead exhibiting continued tracking of cues over the study period. Our findings suggest that while many Arctic arthropods remain responsive to climate change, some may be approaching limits, potentially altering ecological interactions and vulnerability to abiotic cues. Our findings highlight the need for broader assessments of phenological thresholds to refine predictions of species responses to environmental change.

Keywords: arthropods; breakpoint phenological models; climate change; high Arctic; phenology.


Conflict of interest statement

We declare we have no competing interests.

Figures

Examples of types of breakpoint-based thresholds in phenological responses of arthropod taxa to (ɑ) temperature and (b) interannual variation in snowmelt.
Figure 1.
Examples of types of breakpoint-based thresholds in phenological responses of arthropod taxa to (a) temperature and (b) interannual variation in snowmelt. When a threshold is met, a change in slope is assumed (dashed vertical line) where the relationship between phenology and climate is continuous and piecewise linear. Taxa may show no response (slope not different from 0) on one side of the breakpoint (a,b) compared to a constant linear trend.
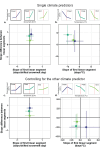
Types of breakpoint responses to snowmelt and temperature on average in the arthropod community, across onset, peak and end of seasonal activity, based on meta-analysis results summarized in table 1.
Figure 2.
Types of breakpoint responses to snowmelt and temperature on average in the arthropod community, across onset, peak and end of seasonal activity, based on meta-analysis results summarized in table 1. Panels (a–d) plot the estimated average Δ slope between the first and second linear segments against the estimated average slope of the first segment. To illustrate these responses, the smaller panels above each main panel depict the type of breakpoint response for each phenological event, differentiated by colour. Black panels indicate significant breakpoint models (where Δ slope was significantly different from zero), and grey panels indicate non-significant models. Panels (a) and (b) display responses to snowmelt and temperature as single predictors, while panels (c) and (d) show responses when controlling for the other predictor. Error bars represent 95% confidence intervals. Point estimates for all taxa and plots can be seen in electronic supplementary material, figures S2.4 and S2.6.
Frequency in location of estimated breakpoints from breakpoint regression models of onset, peak and end of activity for all arthropod taxa and plot combinations with temperature and timing of snowmelt as climate predictors.
Figure 3.
Frequency in location of estimated breakpoints from breakpoint regression models of onset, peak and end of activity for all arthropod taxa and plot combinations with temperature and timing of snowmelt as climate predictors. Only breakpoints from significant breakpoint models controlling for the other predictor are shown. The range of x-values (breakpoint location) has been normalized for all taxa and habitat combinations to range between 0 (minimum temperature or earliest timing of snowmelt experienced by a taxon) and 1 (maximum temperature or latest timing of snowmelt).
Forest plot showing slope estimates for the first linear segment and Δ slope for the onset and peak of arthropod activity in response to snowmelt (onset: (a,b) and peak: (e,f)) and temperature (onset: (c,d) and peak: (g,h)).
Figure 4.
Forest plot showing slope estimates for the first linear segment (a,c,e,g) and Δ slope (b,d,f,h) for the onset and peak of arthropod activity in response to snowmelt (onset: (a,b) and peak: (e,f)) and temperature (onset: (c,d) and peak: (g,h)), while controlling for the other predictor. Results are presented for all taxon-by-plot combinations included in the study. Error bars indicate the standard error of the mean. The final row in each panel includes the meta-analysis average estimates with confidence intervals. Similar figures for the end of activity can be found in the electronic supplementary material, figure S2.7.

References

    1. Parmesan C, Yohe G. 2003. A globally coherent fingerprint of climate change impacts across natural systems. Nature 421, 37–42. ( 10.1038/nature01286) - DOI - PubMed
    1. Visser ME, Both C. 2005. Shifts in phenology due to global climate change: the need for a yardstick. Proc. R. Soc. B 272, 2561–2569. ( 10.1098/rspb.2005.3356) - DOI - PMC - PubMed
    1. Walther GR, Post E, Convey P, Menzel A, Parmesan C, Beebee TJC, Fromentin JM, Hoegh-Guldberg O, Bairlein F. 2002. Ecological responses to recent climate change. Nature 416, 389–395. ( 10.1038/416389a) - DOI - PubMed
    1. Thackeray SJ, et al. 2016. Phenological sensitivity to climate across taxa and trophic levels. Nature 535, 241–245. ( 10.1038/nature18608) - DOI - PubMed
    1. Cohen JM, Lajeunesse MJ, Rohr JR. 2018. A global synthesis of animal phenological responses to climate change. Nat. Clim. Chang. 8, 224–228. ( 10.1038/s41558-018-0067-3) - DOI

Publication types

Grants and funding

LinkOut - more resources