. 2025 Sep 1;329(3):L343-L356.
doi: 10.1152/ajplung.00406.2024. Epub 2025 Jul 22.

High-fat diet obesity exacerbates acute lung injury-induced dysregulation of fatty acid oxidation in alveolar epithelial type 2 cells

Affiliations

High-fat diet obesity exacerbates acute lung injury-induced dysregulation of fatty acid oxidation in alveolar epithelial type 2 cells

Eleni Kallinos et al. Am J Physiol Lung Cell Mol Physiol. .

Abstract

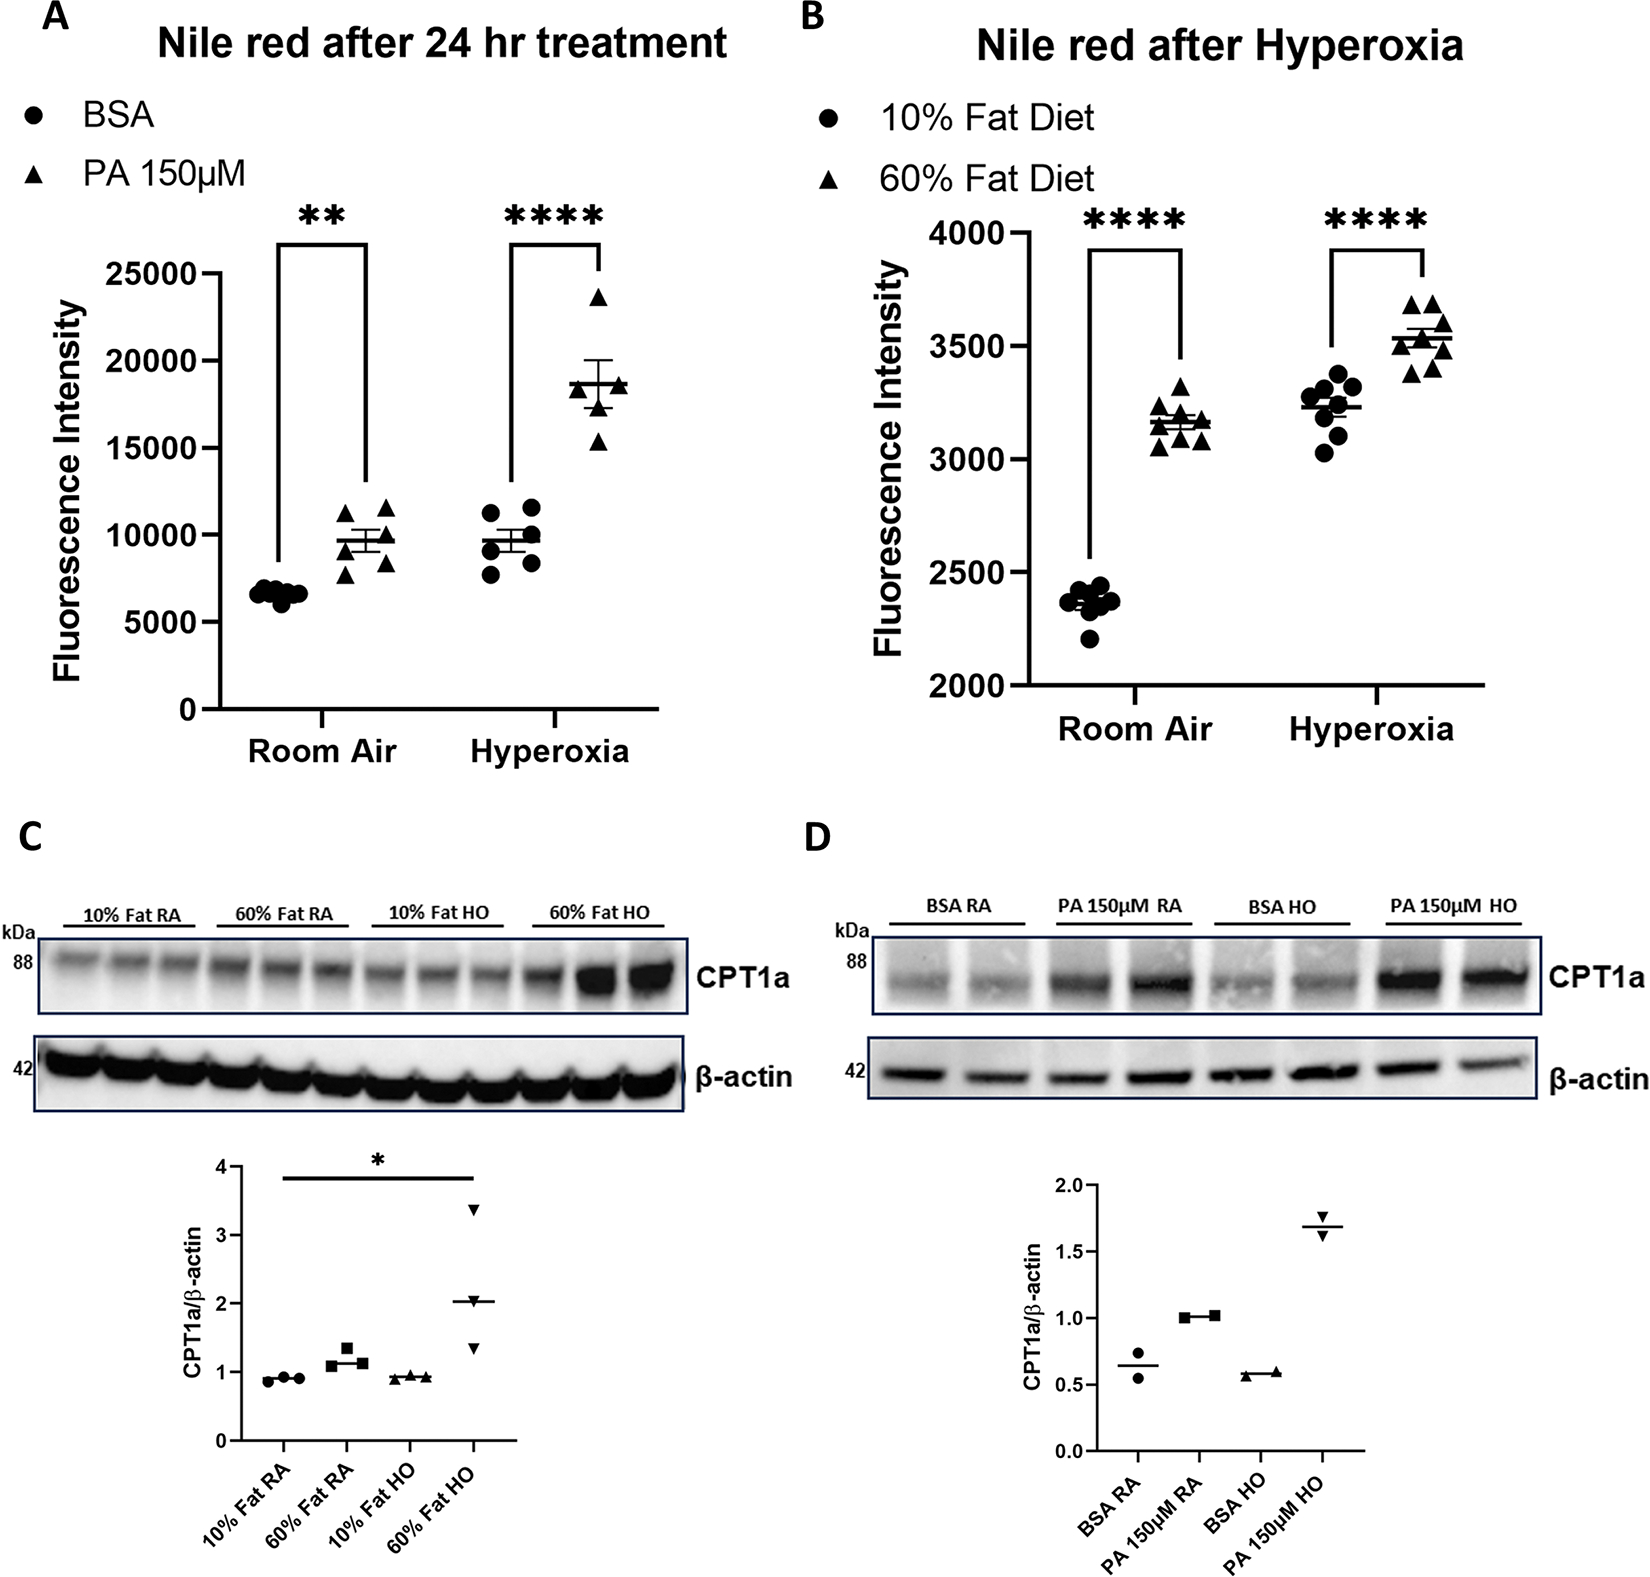
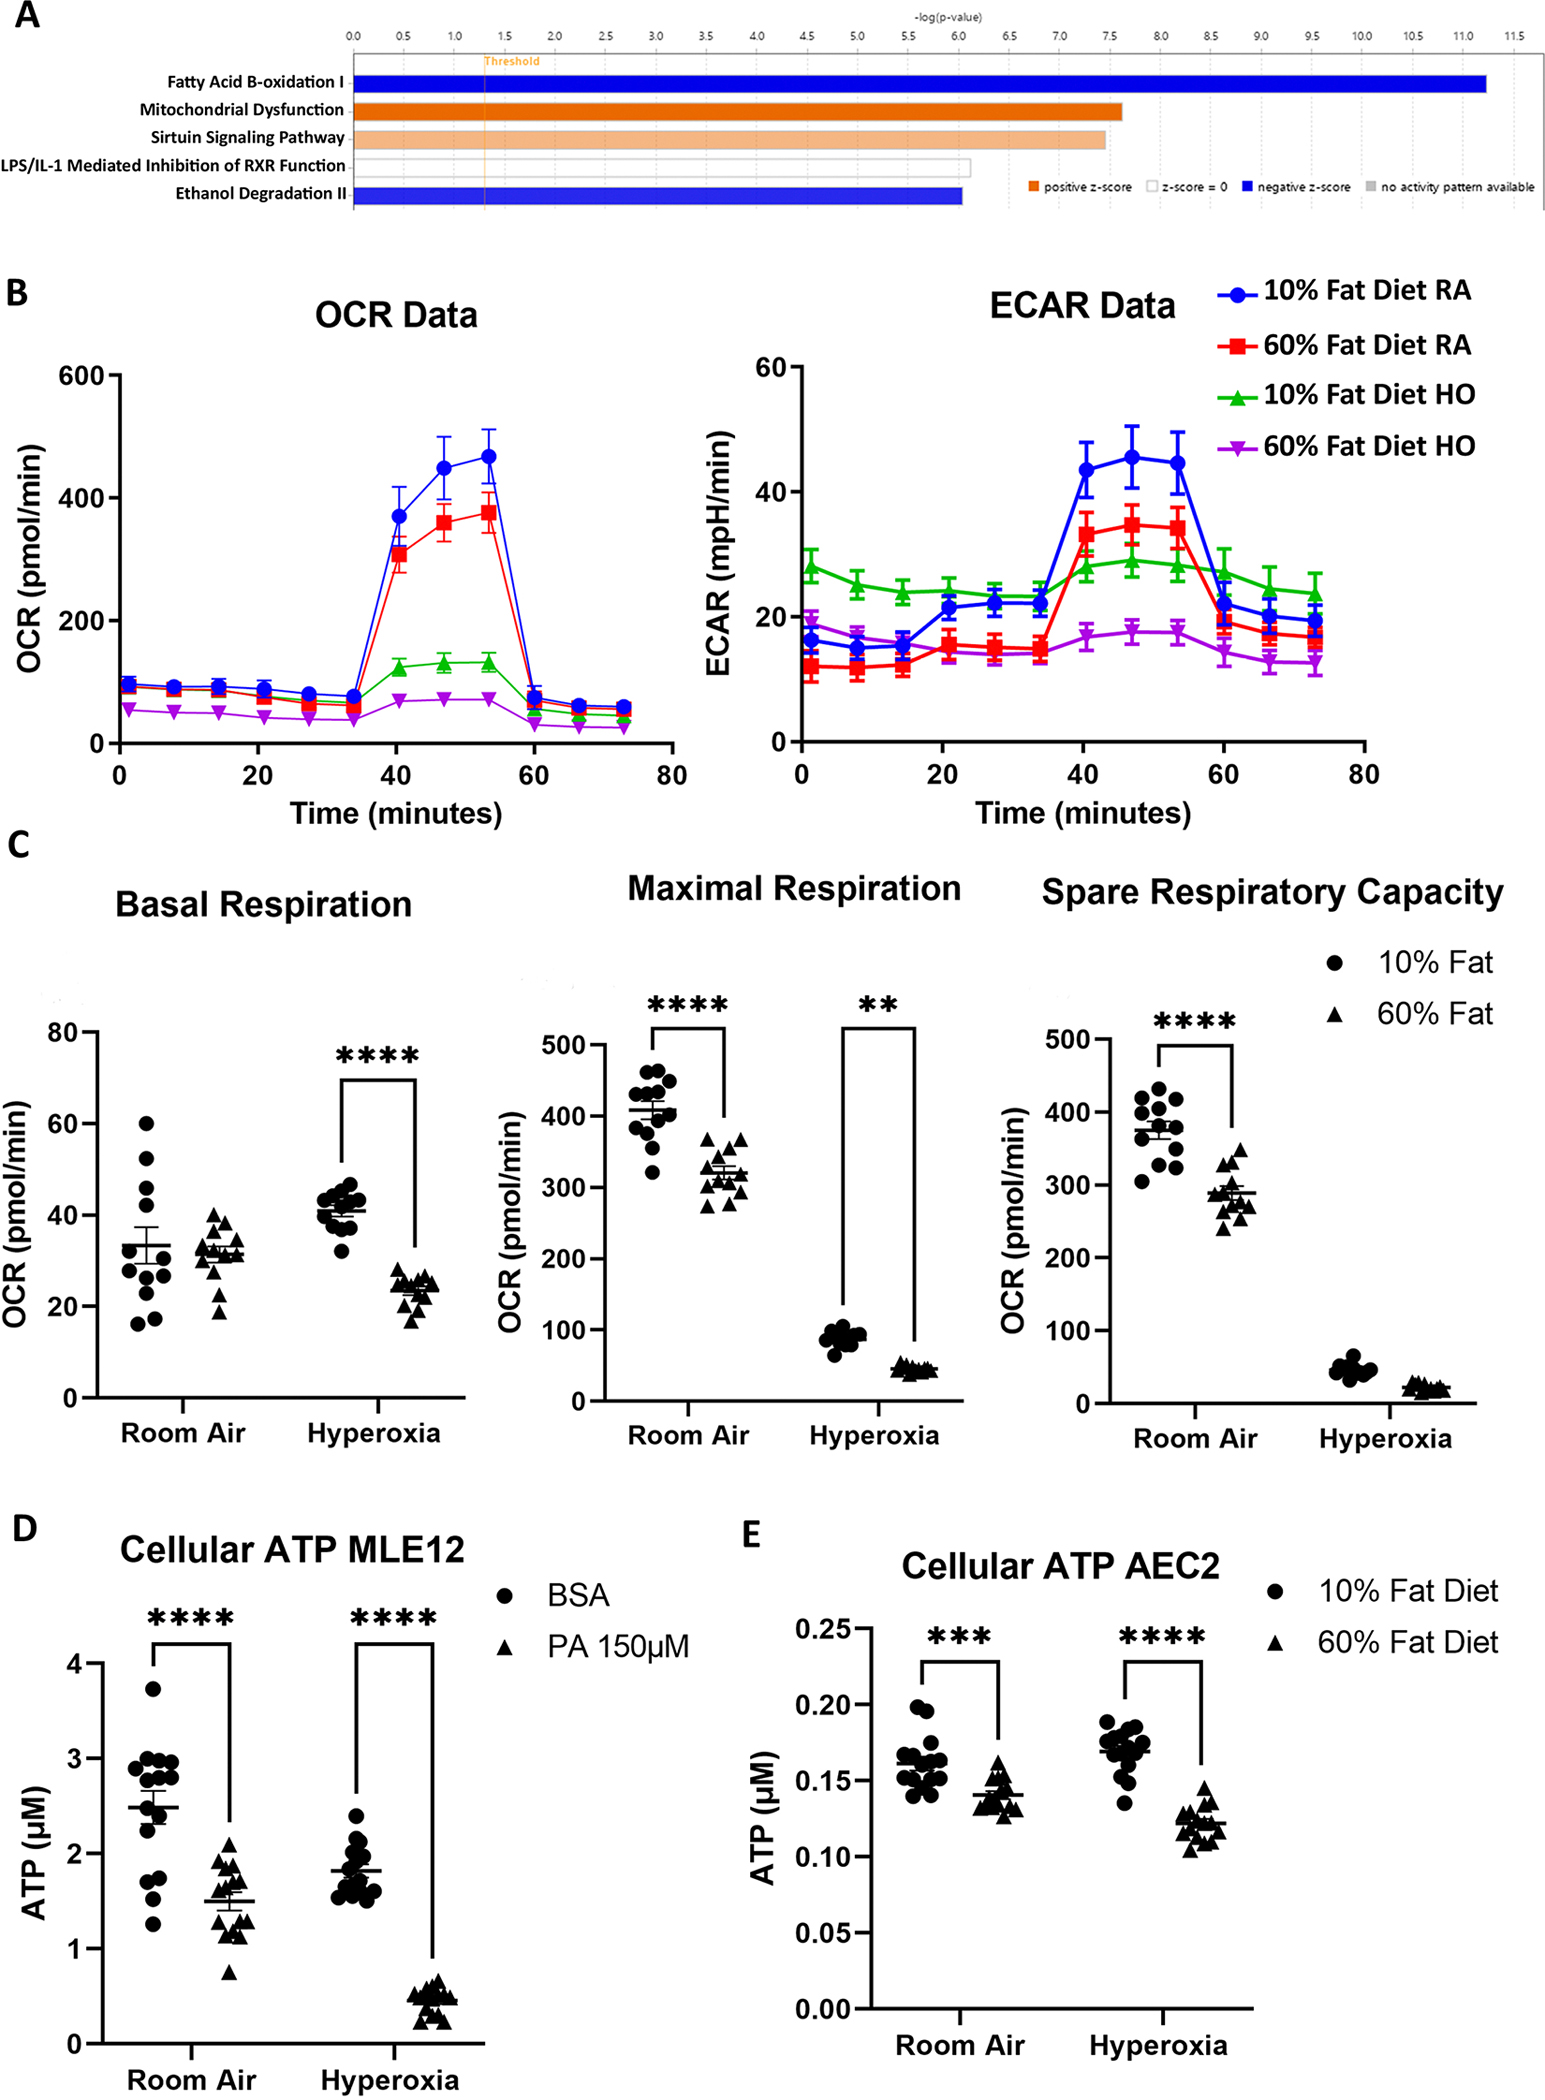
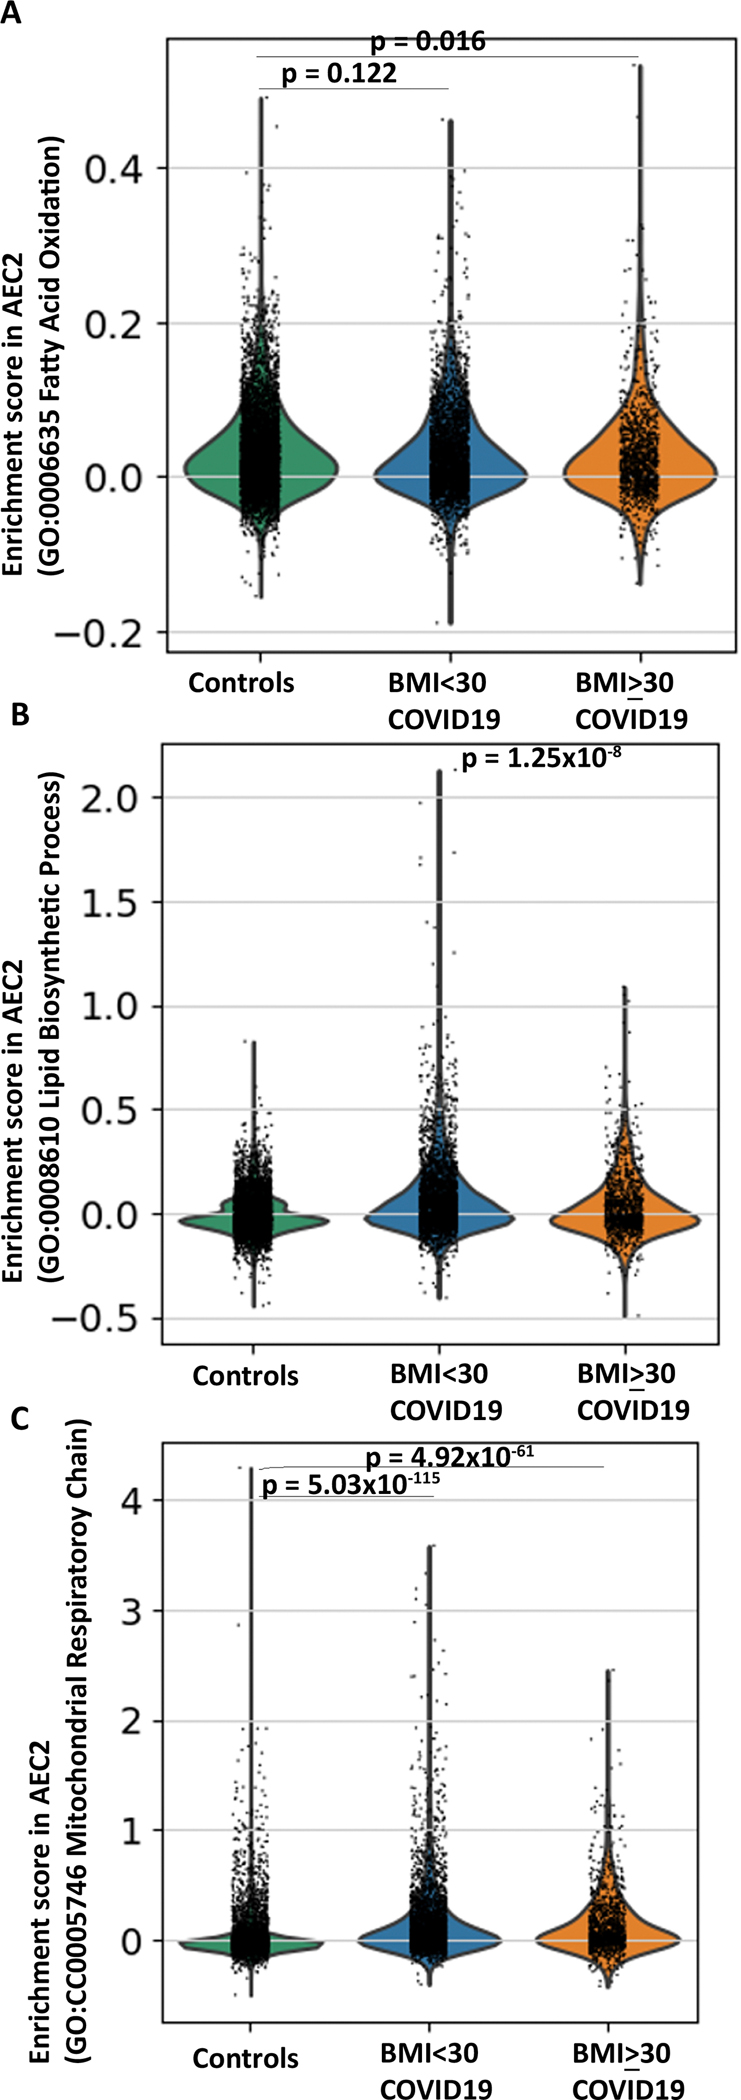
Obesity is a risk factor for acute respiratory distress syndrome (ARDS). We previously showed that obesity is linked to increased lung injury and bronchoalveolar lavage fluid (BALF) fatty acids in a hyperoxic model of ARDS. We sought to expand our understanding of this association and examined the effect of obesity on β-oxidation (FAO), the mitochondrial process of breaking down fatty acids, in alveolar epithelial type 2 cells (AEC2s) in hyperoxia-induced ARDS. AEC2 were isolated from mice receiving 60% versus 10% fat diet. Carnitine palmitoyltransferase 1A (CPT1A) mediates the transport of fatty acids into mitochondria for subsequent FAO. Cpt1aloxp/loxpSftpcCreERT2+/- mice were generated with AEC2-specific CPT1A downregulation. Obesity was associated with intracellular lipid accumulation and increased expression of CPT1A in AEC2 after hyperoxia. Mitochondrial FAO; however, was significantly transcriptionally downregulated in AEC2 of obese mice compared with lean mice after hyperoxia. AEC2 from obese mice exhibited more severe mitochondrial bioenergetic failure and reduced ATP production after hyperoxia compared with lean mice. Consistent with earlier reports linking FAO perturbation to surfactant impairment, we also observed that high-fat diet was associated with reduced surfactant-related phospholipids in hyperoxic AEC2 and increased BALF surface tension, although obese Cpt1aloxp/loxpSftpcCreERT2+/- mice were not protected from increased lung injury. In a reanalysis of a human single-cell lung atlas of COVID-19 ARDS, the downregulation of the FAO signature in AEC2 was significant only in obese, and not lean, patients with ARDS compared with controls. These findings demonstrate a previously underappreciated effect of diet on AEC2 function in acute lung injury.NEW & NOTEWORTHY High-fat diet obesity is linked to increased lung injury and bronchoalveolar lavage fluid (BALF) fatty acids in a hyperoxic ARDS model. In the present study, obesity not only upregulated intracellular lipids and effectors of fatty acid mitochondrial import but also was associated with downregulated fatty acid oxidation and reduced ATP production in alveolar epithelial type 2 cells after injury. Hyperoxic AEC2 from obese mice had reduced phospholipids, and obese mice had increased BALF surface tension after injury.

Keywords: ARDS; acute lung injury; fatty acid oxidation; lipid metabolism; obesity.


Conflict of interest statement

Conflict of Interest Statement: AMKC is a cofounder and consultant, and equity stockholder for Proterris, which develops therapeutic uses for carbon monoxide. AMKC is a consultant and equity stockholder for SPEXIS. AMKC has a use patent on CO. Additionally, AMKC has a patent in COPD. MP participated in an advisory board meeting for InflaRx. The remaining authors have declared that no conflict of interest exists.

Figures

Figure 1:
Figure 1:. In vitro exposure to palmitic acid and in vivo exposure to high fat diet is associated with increased intracellular lipids in AEC2 and increased CPT1A expression.
(A) Mouse lung epithelial (MLE12) cells were exposed in vitro to palmitic acid (PA 150 μM) or control BSA at room air (RA) and hyperoxic (HO) conditions. Exposure to PA was associated with significantly higher intracellular lipids, as measured by the lipophilic die Nile Red, especially after hyperoxia (fluorescence intensity, n = 8 wells for RA groups, n = 6 and 5 wells for BSA HO and PA 150 μM HO respectively, ANOVA with Šídák’s correction for multiple comparisons, **p < 0.01, ****p < 0.0001, similar results were obtained from at least 3 independent experiments). (B) Alveolar epithelial type 2 cells (AEC2) were isolated from mice fed 60% or 10% fat diet on room air and after hyperoxia. Nile red staining confirmed that AEC2 from high fat diet mice had increased intracellular lipids and even more so after hyperoxic exposure (fluorescence intensity, n = 8 wells per group, 40,000 cells/well, ANOVA with Šídák’s correction for multiple comparisons, ****p < 0.0001). (C) Western blot analysis for CPT1A in isolated AEC2 from mice fed 60% or 10% fat diet exposed to room air (RA) or hyperoxia (HO) with β-actin loading control. Densitometry analysis shown at the bottom (n = 3 mice per group, ANOVA with Tukey’s post hoc correction, *p < 0.05, similar results were obtained from at least 3 independent experiments). (D) Western blot analysis for CPT1A in MLE12 cells exposed to palmitic acid (PA 150 μM) or control BSA at RA and HO with β-actin loading control. Densitometry analysis shown at the bottom (n = 2 wells per group, similar results were obtained from 3 independent experiments).
Figure 2:
Figure 2:. Fatty acid oxidation (FAO) is the most significantly transcriptionally downregulated mitochondrial process in AEC2 with 60% compared to 10% fat diet after hyperoxia, and high fat diet is associated with more severe mitochondrial bioenergetic failure in AEC2 after hyperoxia.
(A) Ingenuity pathway analysis (IPA) of mrfDEGs in AEC2 of 60% fat versus 10% fat fed mice after hyperoxia. (B) Oxygen consumption rate (OCR, left) and extracellular acidification rate (ECAR, right) of isolated AEC2 cells from mice on 10% or 60% diet exposed to room air (RA) or hyperoxia (HO) for 48 hours. All data are raw values (similar results were obtained from 3 independent experiments). Data are expressed as mean ± SD. (C) Basal and maximal respiration, and spare respiratory capacity of isolated AEC2 cells from mice fed 60% or 10% fat diet exposed to RA or HO. All data are raw values (ANOVA with Šídák’s correction for multiple comparisons, **p < 0.01, ****p < 0.0001, similar results were obtained from 3 independent experiments). (D) Cellular ATP levels of MLE12 cells exposed to PA (PA 150 μM) or control BSA at RA and HO conditions (μM, n = 15 wells/group, ANOVA with Šídák’s correction for multiple comparisons, ****p < 0.0001, similar results were obtained from at least 3 independent experiments). (E) Cellular ATP levels of AEC2 cells isolated from mice on 10% or 60% fat diet exposed to RA or HO (μM, n = 15 wells/group, 40,000 cells/well, ANOVA with Šídák’s correction for multiple comparisons, ****p < 0.0001, ***p < 0.001).
Figure 3:
Figure 3:. 60% fat diet is associated with reduced surfactant related phospholipids in hyperoxic AEC2 and increased BALF surface tension.
(A) Lipids with saturated fatty acids (SFA), monounsaturated fatty acids (MUFA), and polyunsaturated fatty acids (PUFA) in isolated AEC2 from mice fed 60% or 10% fat diet exposed to room air (RA) or hyperoxia (HO) (relative value, n = 5 mice per group, ANOVA with Šídák’s correction for multiple comparisons, ns non significant). (B) Lipid class levels in isolated AEC2 from mice fed 60% or 10% fat diet exposed to room air (RA) or hyperoxia (HO) (relative value, n = 5 mice per group, ANOVA with Šídák’s correction for multiple comparisons, *p < 0.05). (C) Surfactant related phospholipid levels in isolated AEC2 from mice fed 60% or 10% fat diet exposed to RA or HO (relative value, n = 5 mice per group, ANOVA with Šídák’s correction for multiple comparisons, *p < 0.05, **p < 0.01, ***p < 0.001). (D) Relative gene expression levels of lysophosphatidylcholine acyltransferase 1 (Lpcat1) from RNA-Seq of isolated AEC2 from mice fed 60% and 10% fat diet exposed to hyperoxia or room air (n = 4 mice per group for RA and n = 5 mice per group for hyperoxia; the fold change of fragments per kilobase of transcript per million (FPKM) fragments sequenced was calculated relative to control, Benjamini-Hochberg method, **adjusted p < 0.01, ****adjusted p < 0.0001). (E) Western blot analysis for LPCAT1 in MLE12 cells exposed to palmitic acid (PA 150 μM) or control BSA at RA and HO with β-actin loading control (n = 2 per group, similar results obtained from 3 independent experiments). (F) Western blot analysis for LPCAT1 in isolated AEC2 from mice fed 60% or 10% fat diet exposed to RA or HO with β-actin loading control (n = 2 mice per group, similar results obtained from 3 independent experiments). (G) Bronchoalveolar lavage fluid (BALF) surface tension from mice fed 60% or 10% fat diet exposed to RA or HO (mN/m, n = 6 mice per group for RA, n = 14 mice for 10% fat diet HO, n = 16 mice for 60% fat diet HO, ANOVA with Šídák’s correction for multiple comparisons, *p < 0.05; combined results from 2 independent experiments).
Figure 4:
Figure 4:. CPT1A downregulation in AEC2 does not protect obese mice from increased hyperoxic lung injury.
(A) Western blot analysis for CPT1A in isolated AEC2 from Cpt1aloxp/loxpSftpcCreERT2+/− mice (Cpt1aiΔAEC2) and SftpcCreERT2+/− mice (control) with β-actin loading control (n = 4 mice per group). (B) Weight of Cpt1aiΔAEC2 and control mice on 10% and 60% (n = 10 mice per group for mice on 10% fat diet, n = 14 for control mice on 60% fat diet and n = 12 for Cpt1aiΔAEC2 mice on 60% fat diet, ANOVA with Tukey’s post hoc correction, **p < 0.01, ***p < 0.001). (C) Representative image of H&E-stained lungs (original magnification, ×20, scale bar 60 μm). (D) Bronchoalveolar lavage fluid (BALF) protein levels from Cpt1aiΔAEC2 and SftpcCreERT2+/− (control) mice receiving 60% or 10% fat diet after exposure to HO or RA (mg/mL, n = 2 per group for room air 10% fat diet, n = 3 for room air 60% fat diet, n = 8 for hyperoxia 10% fat, n = 11 for control hyperoxia 60% fat diet, and n = 9 for Cpt1aiΔAEC2 HO 60% fat diet, ANOVA with Šídák’s correction for multiple comparisons, ns non significant; similar results were obtained from at least 2 independent experiments). (E) BALF free fatty acid levels from Cpt1aiΔAEC2 and control mice receiving 60% or 10% fat diet after exposure to HO or RA (nmol/50 μL, n = 2 per group for RA 10% fat diet, n = 3 for RA 60% fat diet, n = 8 for HO 10% fat, n = 11 for control HO 60% fat diet, and n = 9 for Cpt1aiΔAEC2 HO 60% fat diet, ANOVA with Šídák’s correction for multiple comparisons, ns non significant; similar results were obtained from at least 2 independent experiments). CPT1a: Cpt1aiΔAEC2 mice, HO: hyperoxia.
Figure 5:
Figure 5:. Obesity is associated with downregulation of the FAO transcriptomic signature in AEC2 from patients with severe ARDS.
Transcriptomic signature in AEC2 cells in COVID19 ARDS was analyzed using human lung single-cell RNA sequencing datasets from subjects with fatal COVID-19 grouped by BMI and control subjects (GSE171524). Enrichment scores of (A) fatty acid oxidation pathway (GO: 0006635), (B) lipid biosynthetic process (GO: 0008610), and (C) mitochondrial respiratory chain (GO: CC0005746) across groups are exhibited using violin plots of z-scores for involved genes. The p values were calculated using Mann-Whitney U tests.

Comment in

References

    1. Force ADT, Ranieri VM, Rubenfeld GD, Thompson BT, Ferguson ND, Caldwell E, Fan E, Camporota L, and Slutsky AS. Acute respiratory distress syndrome: the Berlin Definition. JAMA 307: 2526–2533, 2012. - PubMed
    1. Hendrickson KW, Peltan ID, and Brown SM. The Epidemiology of Acute Respiratory Distress Syndrome Before and After Coronavirus Disease 2019. Crit Care Clin 37: 703–716, 2021. - PMC - PubMed
    1. Gupta S, Hayek SS, Wang W, Chan L, Mathews KS, Melamed ML, Brenner SK, Leonberg-Yoo A, Schenck EJ, Radbel J, Reiser J, Bansal A, Srivastava A, Zhou Y, Sutherland A, Green A, Shehata AM, Goyal N, Vijayan A, Velez JCQ, Shaefi S, Parikh CR, Arunthamakun J, Athavale AM, Friedman AN, Short SAP, Kibbelaar ZA, Abu Omar S, Admon AJ, Donnelly JP, Gershengorn HB, Hernan MA, Semler MW, Leaf DE, and Investigators S-C. Factors Associated With Death in Critically Ill Patients With Coronavirus Disease 2019 in the US. JAMA Intern Med 180: 1436–1447, 2020. - PMC - PubMed
    1. Lewandowski K, and Lewandowski M. Intensive care in the obese. Best Pract Res Clin Anaesthesiol 25: 95–108, 2011. - PubMed
    1. Fezeu L, Julia C, Henegar A, Bitu J, Hu FB, Grobbee DE, Kengne AP, Hercberg S, and Czernichow S. Obesity is associated with higher risk of intensive care unit admission and death in influenza A (H1N1) patients: a systematic review and meta-analysis. Obes Rev 12: 653–659, 2011. - PubMed

MeSH terms

Substances

LinkOut - more resources