. 2025 Jul 22;16(1):546.
doi: 10.1038/s41419-025-07849-w.

Diabetes is causally associated with increased breast cancer mortality by inducing FIBCD1 to activate MCM5-mediated cell cycle arrest via modulating H3K27ac

Affiliations

Diabetes is causally associated with increased breast cancer mortality by inducing FIBCD1 to activate MCM5-mediated cell cycle arrest via modulating H3K27ac

Binbin Tan et al. Cell Death Dis. .

Abstract

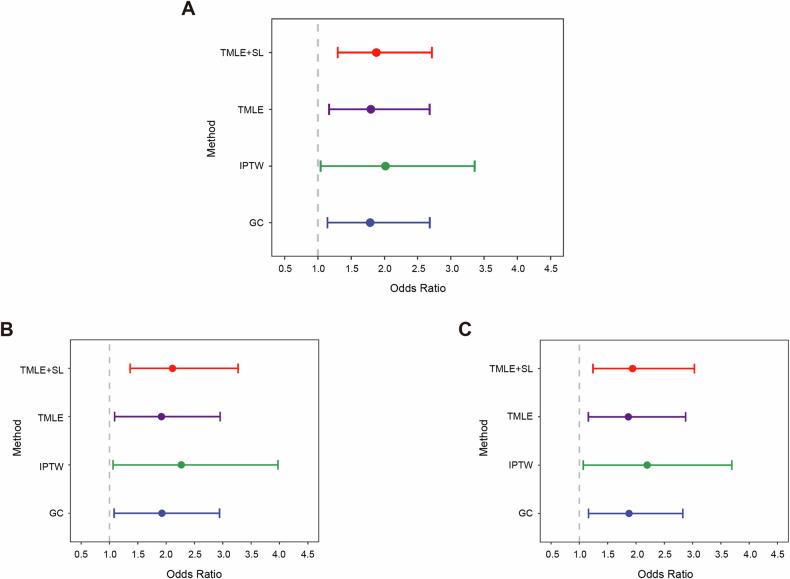
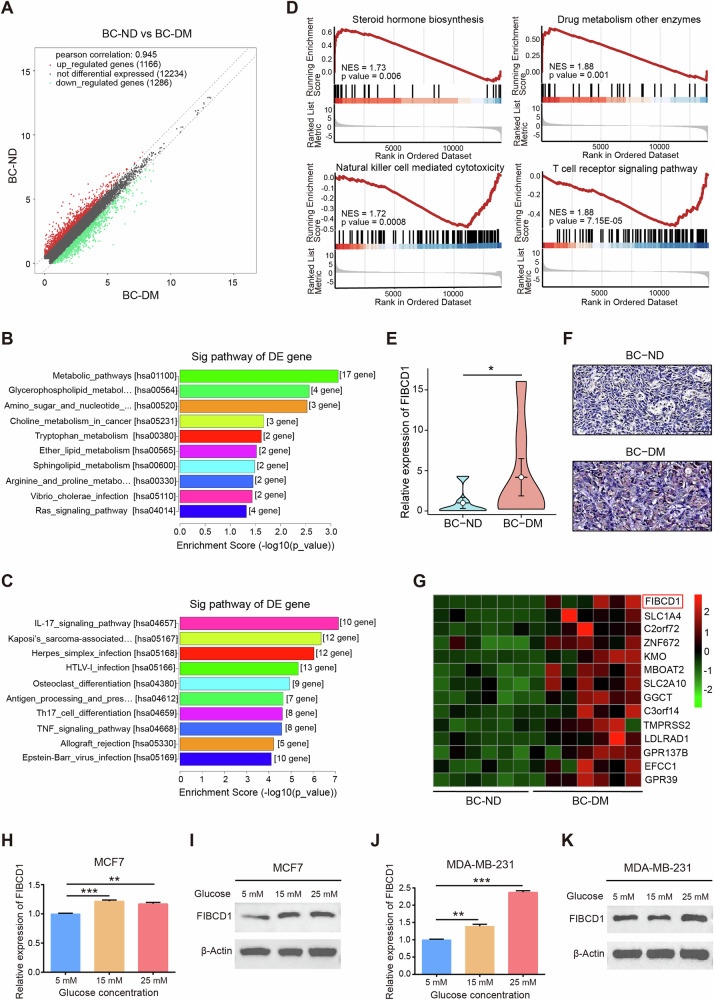
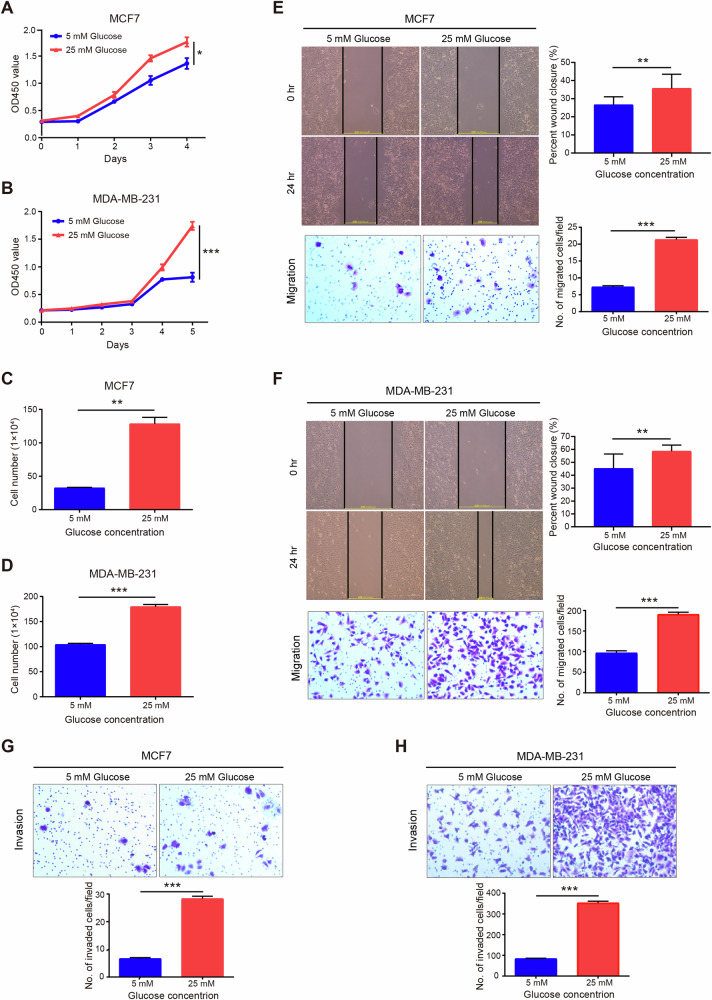
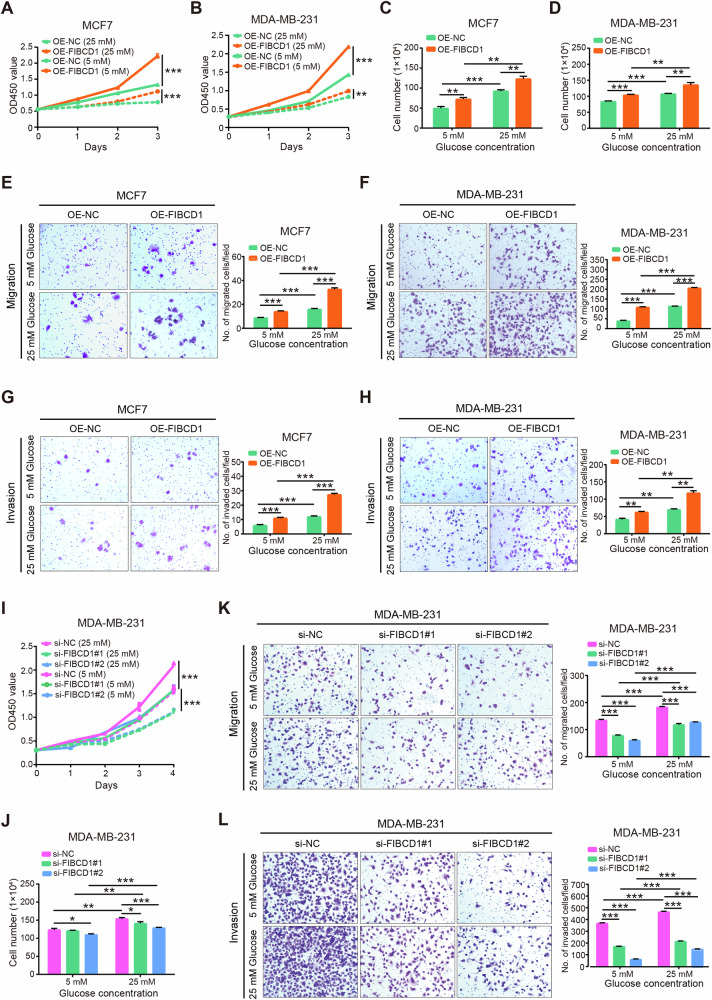
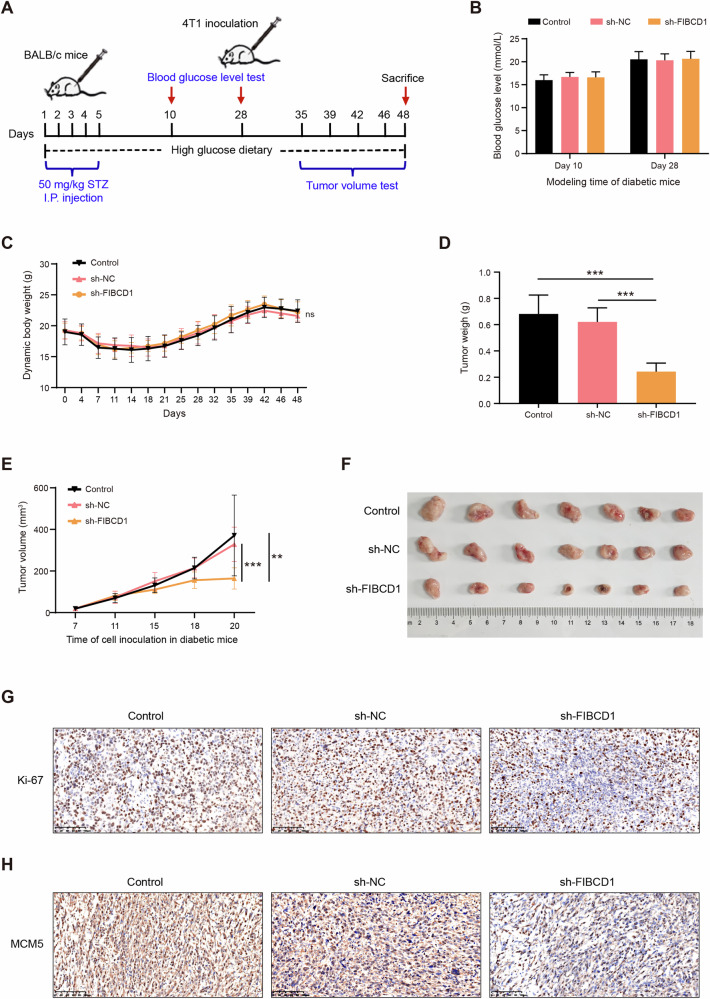
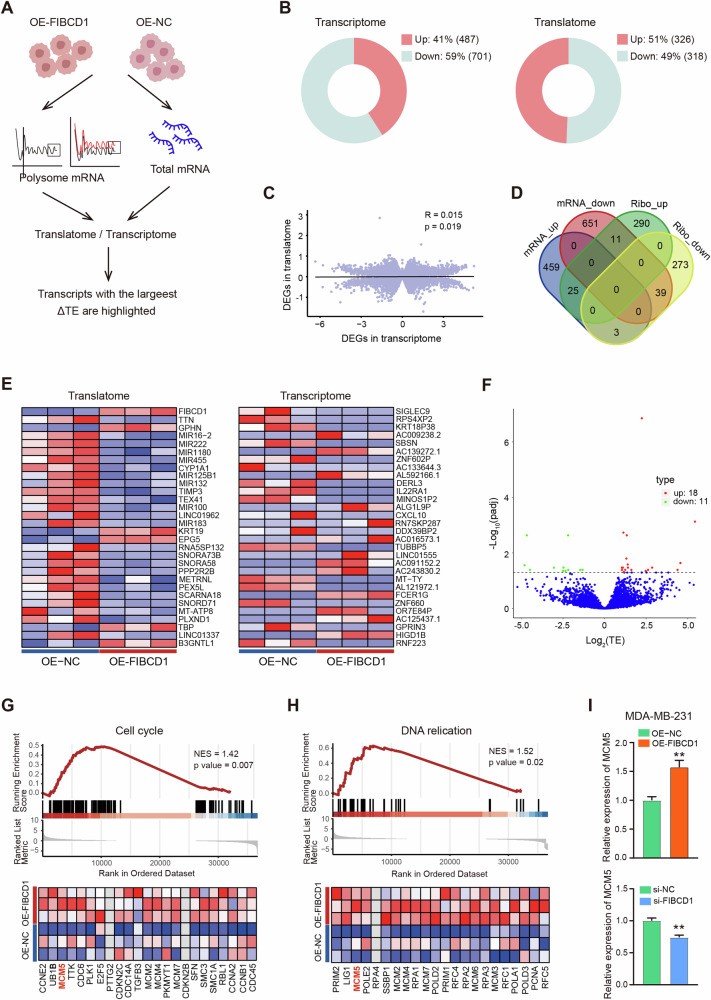
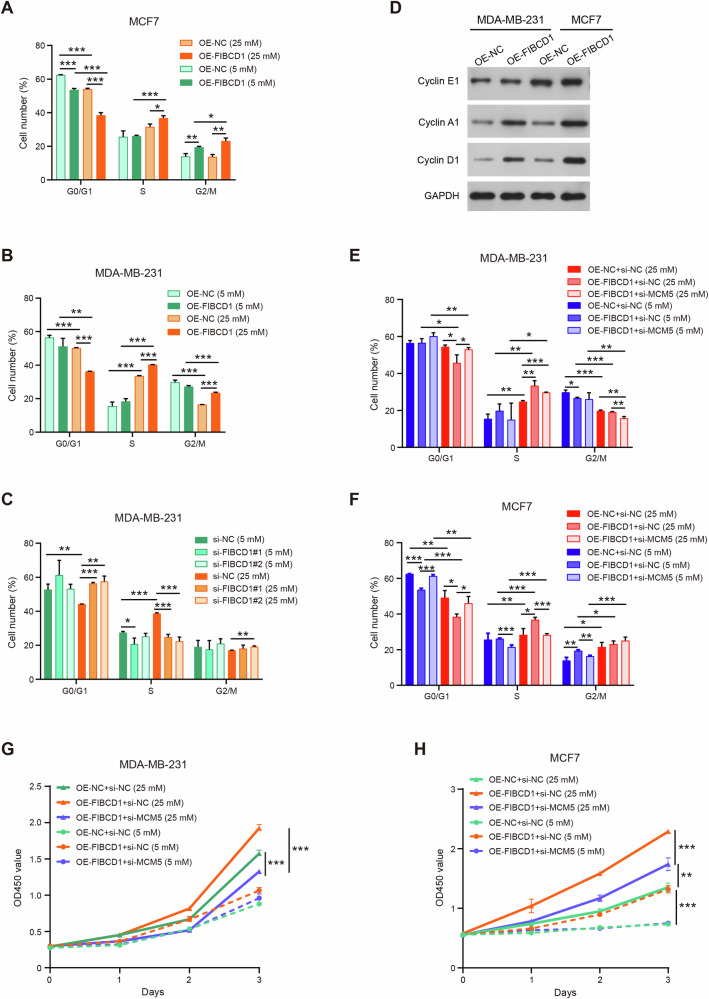
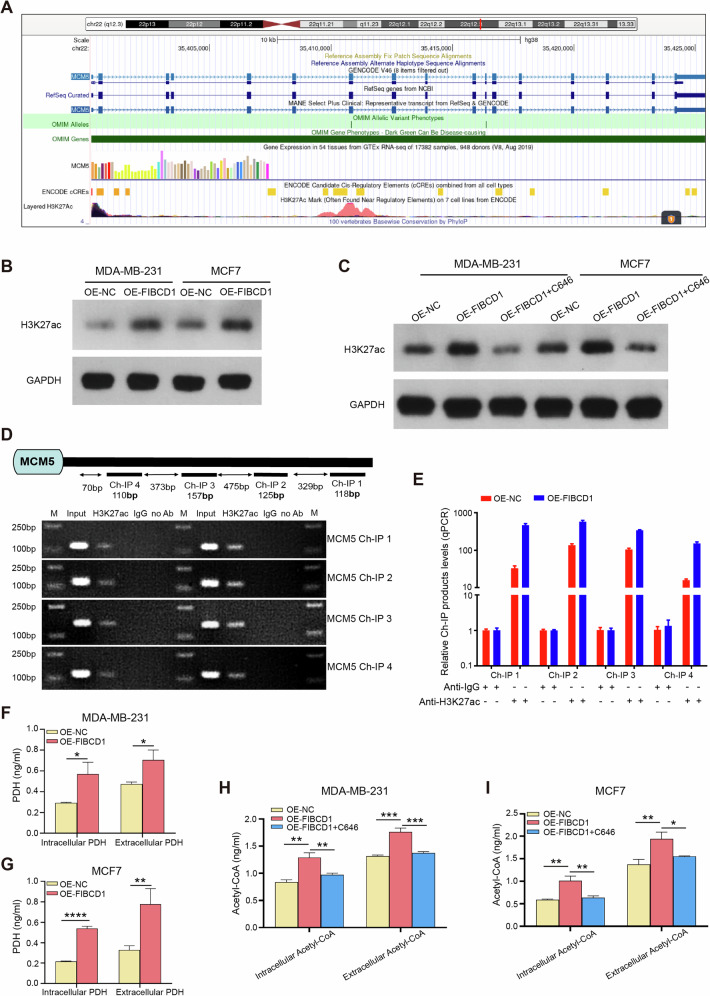
Breast cancer (BC) is the most common tumor worldwide and it has been recognized that up to one third of BC patients have co-existing diabetes mellitus (DM) (BC-DM). Although many observational studies have indicated an association between DM and BC, the causal relationship of DM and BC prognosis remained uncertain and the molecular mechanisms underlying BC-DM are largely unclear. In this study, we used causal inference methods, including g-computation (GC), inverse probability of treatment weighting (IPTW), targeted maximum likelihood estimation (TMLE), and TMLE-super learner (TMLE-SL), to comprehensively analyze the association of DM with BC mortality in a cohort of 3386 BC patients. We found that the adjusted odds ratios (OR) and 95% confidence intervals (95% CI) for 5-year mortality in BC-DM patients were 1.926 (1.082, 2.943), 2.268 (1.063, 3.974), 1.917 (1.091, 2.953), and 2.113 (1.365, 3.270), respectively. Further transcriptomic and qPCR analyses identified that FIBCD1 was highly expressed in BC-DM tumor tissues and in BC cells under hyperglycemia conditions. Functionally, upregulation of FIBCD1 promoted proliferation, migration, and invasion capacities of BC cells in a glucose level-dependent manner. While knockdown of FIBCD1 suppressed BC tumor growth in diabetic mice. Integrated RNA-seq and Ribo-seq analysis revealed that MCM5 was a target of FIBCD1. Mechanistically, hyperglycemia-activated FIBCD1 promoted MCM5 expression to induce S-phase cell cycle arrest by upregulating histone H3K27ac levels in MCM5 promoter via the PDH-acetyl-CoA axis. Our findings provide new evidence that co-existing DM has a causal effect on overall mortality in BC-DM patients. Targeting FIBCD1 may be a promising therapy for BC-DM.


Conflict of interest statement

Competing interests: The authors declare no competing interests. Ethics approval: Human sample collection and cohort study were approved by the Clinical Research Ethics Committee of Shenzhen University (Approved No. 2019015). Animal experiments were performed in accordance with the guidelines approved by the Institutional Animal Care and Use Committee of Shenzhen University Medical School (Approved No. IACUC-202300060).

Figures

Fig. 1
Fig. 1. Estimated 5-year mortality odds ratio (OR) by co-existing DM in patients with BC. Points represent adjusted ORs and lines indicate 95% confidence interval (CI).
A ORs are assessed by G-computation (GC), inverse probability of treatment weighting (IPTW), targeted maximum likelihood estimation (TMLE) and TMLE with super-learner (TMLE-SL), respectively. B Sensitivity analysis was conducted by excluding subjects with stage III. C Sensitivity analysis was performed by excluding subjects with age > =70. All ORs are adjusted for baseline age, BMI, Ki67, stage, HER2, ER, PR, lymphatic metastasis, hypertension, and menopause status.
Fig. 2
Fig. 2. FIBCD1 is upregulated in BC-DM and under hyperglycemia conditions.
A Scatter plotting shows differentially expressed genes between BC-DM tumor tissues and BC-ND tumor tissues. The red dots and green dots represent upregulated and downregulated mRNAs with statistical significance, respectively. B KEGG pathway analysis of significantly up-regulated mRNAs suggests that upregulated genes in BC-DM are enriched in metabolism-related pathways. C KEGG pathway analysis of significantly down-regulated mRNAs. D Gene set enrichment analysis (GSEA) revealed functional enrichments of differentially expressed genes in BC-DM tumor tissues. Normalized enrichment score (NES) and p-values are indicated. E FIBCD1 gene expression levels (detected by qRT-PCR assay) in BC-DM tissues are higher than that in BC-ND tissues. F Representative IHC images showing that FIBCD1 protein expression level in BC-DM tissue is higher than that in BC-ND tissue. G Top upregulated genes in BC-DM tumor tissues with FIBCD1 ranks as the top one DEG. H FIBCD1 gene expression levels in MCF7 cells are glucose dependent. I FIBCD1 protein expression is related to glucose concentration in MCF7 cells. J FIBCD1 gene expression levels in MDA-MB-231 cells under hyperglycemic conditions are higher than in euglycemic conditions. K FIBCD1 protein expression is related to glucose concentration in MDA-MB-231 cells. Data are presented as mean ± SD, Student’s t test. *P < 0.05; **P < 0.01; ***P < 0.001.
Fig. 3
Fig. 3. High glucose promotes cell proliferation, migration, invasion, and expression of FIBCD1 in BC cells.
A Proliferation rate of MCF7 cells is higher under hyperglycemic (25 mM glucose) culture conditions than that under euglycemic (5 mM glucose) culture conditions determined by CCK8 assay. B Proliferation capacity of MDA-MB-231 cells is higher under hyperglycemia conditions than that of euglycemic conditions. C Proliferation of MCF7 cells is determined by cell counting assay. D Proliferation of MDA-MB-231 cells is examined by cell counting assay. E Hyperglycemia promotes migration ability of MCF7 cells. F. Hyperglycemia enhances migration capacity of MDA-MB-231 cells. G Hyperglycemia augments invasion potential of MCF7 cells. H Hyperglycemia increases invasion capability of MDA-MB-231 cells. Data are shown as mean ± SD, Student’s t test. *P < 0.05; **P < 0.01; ***P < 0.001.
Fig. 4
Fig. 4. FIBCD1 enhances the malignancy of BC cells in a glucose level-dependent manner. BC cells were incubated in hyperglycemic (25 mM glucose) or euglycemic (5 mM glucose) culture conditions, respectively.
A High glucose enhances the promoting effect of FIBCD1 on cell proliferation in MCF7 cells. B Cell counting assay indicates that the effects of FIBCD1 on cell proliferation are stronger under high glucose conditions. C Proliferation of MCF7 cells by FIBCD1 was determined by cell counting assay. D Proliferation of MDA-MB-231 cells by FIBCD1 was measured by cell counting assay. E Hyperglycemia enhances the effects of FIBCD1 on cell migration ability of MCF7 cells. F Hyperglycemia increases the impacts of FIBCD1 on cell migration ability in MDA-MB-231 cells. G High glucose augments the promotive effects of FIBCD1 on cell invasion capacity of MCF7 cells. H High glucose promotes the influence of FIBCD1 on cell invasion ability of MDA-MB-231 cells. I Knockdown of FIBCD1 suppresses the proliferation rate of MAD-MB-231 cells. J Silencing of FIBCD1 inhibits proliferation capacity of MDA-MB-231 cells. K Knockdown of FIBCD1 depresses migration ability of MCF7 cells. L Silencing of FIBCD1 suppresses invasion capacity of MDA-MB-231 cells. Data are presented as mean ± SD, Student’s t test. *P < 0.05; **P < 0.01; ***P < 0.001.
Fig. 5
Fig. 5. Knockdown of FIBCD1 inhibits BC tumor growth in diabetic mice.
A Schematic overview of the in vivo experiment. B Blood glucose levels in sh-FIBCD1 treatment mice and control animals. C Comparison of body weight changes of mice during the experiment. D. The average xenograft tumor weight in si-FIBCD1-treated diabetic mice is significantly lower than that of control animals. E Tumor growth curves indicate that sh-FIBCD1 treatment significantly inhibits tumor growth in diabetic mice. F Representative images of xenograft tumors in diabetic mice with or without si-FIBCD1 treatment. G Representative images of IHC staining, indicating that sh-FIBCD1 suppresses the expression levels of Ki67 protein expression in xenograft tumor tissues. H sh-FIBCD1 inhibits MCM5 protein expression in xenograft tumor tissues. Data are presented as mean ± SD, Student’s t test. *P < 0.05; **P < 0.01; ***P < 0.001.
Fig. 6
Fig. 6. Integrated analysis of transcriptome and translatome identifies that cell cycle pathway gene MCM5 is a target of FIBCD1.
A Schematic workflow showing RNA extraction from ribosome-protected mRNA fragments (RPFs) or from whole cell lysates in FIBCD1-overexpressing and control cells to be used for Ribo-seq or RNA-seq analyses. B Numbers of significantly up- or down-regulated transcripts shown as doughnuts. C Genome-wide transcriptional and translational regulations show very little correlation. E Heatmaps representing the top 30 up- or downregulated transcripts in the translatome and transcriptome with |fold change>2.0| and P-value < 0.05. D The four-way Venn diagram showing the overlap between the significantly upregulated or down-regulated transcripts in the translatome and transcriptome. F Volcano map of differentially expressed TE genes (DTEG). The blue dot represents the non-differentially expressed translation efficiency genes. G Gene set enrichment analysis (GSEA) of DTEG showing the enrichment of Cell cycle pathway in FIBCD1-overexpressing cells, with MCM5 as one of the top up-regulated genes. H GSEA analysis showing the enrichment of DNA replication pathway in FIBCD1-overexpressing cells, with MCM5 as one of the top up-regulated genes. I Overexpression/Knockdown of FIBCD1 promotes/inhibits MCM5 expression in MDA-MB-231 cells. Data are presented as mean ± SD, Student’s t test. *P < 0.05; **P < 0.01; ***P < 0.001.
Fig. 7
Fig. 7. FIBCD1 affects BC cell cycle and proliferation by interacting with MCM5 in a glucose level-dependent manner.
A Overexpression of FIBCD1 arrests MCF7 cells in the S and G2/M phases. B FIBCD1 induces S and G2/M phases arrest in MDA-MB-231 cells. C Knockdown of FIBCD1 reduces the percentage of S phase cells. D FIBCD1 promotes Cyclin A1 and Cyclin D1 protein expression in both MCF7 and MDA-MB-231 cells. E Co-transfection of FIBCD1 and si-MCM5 partly reverses the impact of FIBCD1 on S phase arrest of cell cycle in hyperglycemic compared with euglycemic conditions in MDA-MB-231 cells. F si-MCM5 partially abolishes the effect of FIBCD1 on the percentage of S phase cells in hyperglycemic compared with euglycemic conditions in MCF7 cells. G Co-transfection of FIBCD1 and si-MCM5 suppresses the influence of FIBCD1 on cell proliferation rate in hyperglycemic compared with euglycemic conditions in MDA-MB-231 cells. H si-MCM5 inhibits the promotive effects of FIBCD1 on cell proliferation in hyperglycemic compared with euglycemic conditions in MCF7 cells. Data are presented as mean ± SD, Student’s t test. *P < 0.05; **P < 0.01; ***P < 0.001.
Fig. 8
Fig. 8. FIBCD1 promotes the enrichment of H3K27ac in the MCM5 promoter region through the PDH-acetyl-CoA axis.
A UCSC genome browser views for the MCM5 gene, indicating that H3K27ac mark is enriched in the promoter of MCM5. B Upregulation of FIBCD1 increases H3K27Ac level in both MDA-MB-231 and MCF7 cells. C Histone acetylase inhibitor C646 inhibits the effect of FIBCD1 on H3K27ac in BC cells. D Schematic illustration of four potential binding sites (Ch-IP1, Ch-IP2, Ch-IP3, Ch-IP4) in the MCM5 promoter for H3K27ac (top). Agarose gel electrophoresis of PCR products indicates that FIBCD1 increases the binding of H3K27ac with MCM5 promoter (bottom). E ChIP assay shows that H3K27Ac is enriched in the promoter region of MCM5 in MDA-MB-231 cells. F Upregulation of FIBCD1 promotes PDH production from MDA-MB-231 cells. G Overexpression of FIBCD1 augments PDH production from MCF7 cells. H Upregulation of FIBCD1 facilitates acetyl-CoA generation and C646 inhibits acetyl-CoA production from MDA-MB-231 cells. I Overexpression of FIBCD1 increases the release of acetyl CoA but C646 suppresses acetyl CoA production from MCF7 cells. Data are presented as mean ± SD, Student’s t test. *P < 0.05; **P < 0.01; ***P < 0.001.

Similar articles

References

    1. Sung H, Ferlay J, Siegel RL, Laversanne M, Soerjomataram I, Jemal A, et al. Global Cancer Statistics 2020: GLOBOCAN Estimates of Incidence and Mortality Worldwide for 36 Cancers in 185 Countries. CA Cancer J Clin. 2021;71:209–49. - PubMed
    1. Yancik R, Wesley MN, Ries LA, Havlik RJ, Edwards BK, Yates JW. Effect of age and comorbidity in postmenopausal breast cancer patients aged 55 years and older. JAMA. 2001;285:885–92. - PubMed
    1. Srokowski TP, Fang S, Hortobagyi GN, Giordano SH. Impact of diabetes mellitus on complications and outcomes of adjuvant chemotherapy in older patients with breast cancer. J Clin Oncol. 2009;27:2170–6. - PMC - PubMed
    1. Tammemagi CM, Nerenz D, Neslund-Dudas C, Feldkamp C, Nathanson D. Comorbidity and survival disparities among black and white patients with breast cancer. JAMA. 2005;294:1765–72. - PubMed
    1. Shao S, Gill AA, Zahm SH, Jatoi I, Shriver CD, McGlynn KA, et al. Diabetes and Overall Survival among Breast Cancer Patients in the U.S. Military Health System. Cancer Epidemiol Biomark Prev. 2018;27:50–57. - PMC - PubMed