. 2025 Jul 22;16(1):6752.
doi: 10.1038/s41467-025-61558-8.

Aberrant EZHIP expression drives tumorigenesis in osteosarcoma

Affiliations

Aberrant EZHIP expression drives tumorigenesis in osteosarcoma

Wajih Jawhar et al. Nat Commun. .

Abstract

Osteosarcomas (OS) are aggressive bone tumors known for their extensive structural variations and rare recurrent oncogenic driver mutations. In this study, we identify ectopic expression of the oncohistone-mimic EZHIP in 20% of patients across two independent OS cohorts. We demonstrate that reduced deposition of the repressive H3K27me3 mark correlates with poor histological response to neoadjuvant therapy, serving as a predictor of patient outcomes. Through gain- and loss-of-function experiments, we provide functional evidence of the oncogenic activity of EZHIP in enhancing the aggressive characteristics of OS both in vitro and in vivo. EZHIP-induced epigenetic reprogramming reactivates developmental pathways and impedes the differentiation of mesenchymal progenitors, pushing them towards smooth muscle lineage commitment at the cost of other fates. Targeting residual H3K27me3 with EZH2 inhibitors may offer therapeutic benefit in EZHIP-expressing OS. Our findings highlight EZHIP expression as a prevalent driver in OS, offering insights into its pathogenic mechanisms and potential therapeutic strategies for this debilitating cancer.


Conflict of interest statement

Competing interests: The authors declare no potential conflicts of interest.

Figures
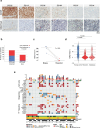
Fig. 1
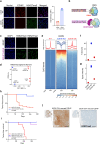
Fig. 1. EZHIP is ectopically expressed in a subset of Osteosarcoma tumors.
a EZHIP (top) and H3K27me3 (bottom) IHC images of representative OS patients from the discovery cohort. Scale bar, 100 µm. Tumor sections displayed represent the heterogeneity observed in the cohort (N = 54). (see supplementary data 1 for H3K27me3 scoring in complete tumor area). b Stacked bar graph depicting the number of patients with either good or poor response to neoadjuvant chemotherapy split by H3K27me3 status (retained or lost) (N = 40). Significance was assessed using a Fisher’s exact test. c Dot plot for four available matched therapy naïve and post-treatment samples displaying significant loss of H3K27me3 in post-treatment samples. Significance assessed using paired t-test. d Violin plots displaying global H3K27me3 levels in all biopsy, primary, and metastasis tissue samples available from the discovery cohort (N = 61). Significance was assessed using independent t-tests with Bonferroni correction. e Oncoprint displaying somatic alterations discovered from WGS/WES and RNAseq analysis of 35 OS patients and patient features including EZHIP expression based on IHC results.
Fig. 2
Fig. 2. EZHIP is necessary for U2OS in-vivo tumorigenesis.
a Left, Representative immunofluorescence images of U2OS unedited (U2OS WT) and EZHIP knockout (EZHIP KO) clones displaying restoration of H3K27me3 upon the loss of EZHIP expression. Right, bar graph of corresponding fluorescence intensity quantification for H3K27me3 N = 2 biological replicates (clones) per genotype. Data are presented as mean values ± SD. Scale bar, 50 µm. b Schematic illustrating the difference between WT EZHIP and KLP-mutant EZHIP (R405E) with null PRC2-stalling activity. Created with Biorender.com (c) Representative immunofluorescence images of U2OS C54 EZHIP R405E overexpressing cells demonstrating retained H3K27me2/3 compared to U2OS C54 rescued with WT EZHIP. Scale bar, 50 µm, independently replicated twice. d Scatter plot showing principal component 1 and principal component 2 (PC1, PC2) from PCA of spike in normalized H3K27me3 CUT&RUN signal in 5 kb bins across the genome (top 10000 most variable bins) for U2OS, U2OS EZHIP KO and U2OS EZHIP over expression (U2OS OE) (N = 2, independent experiments per genotype). e CUT&RUN metagene plots (top) and heatmaps (bottom) of U2OS cell lines within ± 10 Kb windows centered at CGI reveal global decrease and H3K27me3 restriction to CGI. Y axis; average H3K27me3 read density. f Dot plot of number of H3K27me3 domains called in U2OS WT, U2OS EZHIP knock out (KO) and U2OS EZHIP over expression (OE) (N = 2, independent experiments per genotype). g Dot plot of H3K27me3 signal intensity in H3K27me3 domains (read density) U2OS WT, U2OS EZHIP knock out (KO) and U2OS EZHIP over expression (OE). (N = 2, independent experiments per genotype). h Kaplan-Meier curves showing tumor-free survival analysis of NSG mice injected with U2OS WT (N = 25) and EZHIP KO (N = 10), significance assessed using the log-rank test. i Kaplan-Meier curves showing tumor-free survival analysis of NSG mice injected with U2OS EZHIP KO clone C54 rescued with an EZHIP expression construct compared to U2OS C54 KO clone rescued with an empty-vector control (CTL), and EZHIP R405E, N = 7 per group, significance assessed using log-rank test. j Representative IHC images showing EZHIP (left) and H3K27me3 (right) in U2OS C54 rescued EZHIP tumors. Scale bar, 200 µm. In total, 5 tumors were stained, all showing similar results. Created in BioRender. Jabado, N. (https://BioRender.com/k32g741).
Fig. 3
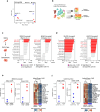
Fig. 3. EZHIP overexpression enhances aggressiveness of MG63 and KHOS Osteosarcoma cell lines.
a, b Left, Representative immunofluorescence images of MG63 and KHOS CTL and EZHIP cell lines displaying loss of H3K27me3 upon EZHIP overexpression. Right, bar graphs of corresponding fluorescence intensity quantification for H3K27me3. Data are presented as mean values ± SD, n = 4 (MG63) and n = 3 (KHOS) technical replicates. Scale bar, 50 µm. c, d CUT&RUN heatmaps of spike in normalized MG63 and KHOS cell lines within ± 10 Kb windows centered at CGI reveal global decrease and H3K27me3 restriction to CGI when EZHIP is overexpressed. Y axis; average H3K27me3 read density. e Top, dot plot of number of H3K27me3 domains called in KHOS CTL, KHOS EZHIP overexpression (OE), MG63 CTL and MG63 EZHIP overexpression (OE). Bottom, dot plot of H3K27me3 signal intensity in H3K27me3 domains in KHOS WT, KHOS EZHIP overexpression (OE), MG63 CTL and MG63 EZHIP overexpression (OE). (N = 2, independent experiments per genotype except KHOS EZHIP; N = 1). f In-vivo tumor growth curves of MG63 EZHIP and CTL in NRG mice. 8/8 mice injected with EZHIP OE cells formed tumors, compared to 2/7 in the CTL cells (Fisher’s exact test, p = 0.007). g Tumor-free Kaplan-Meier survival curves of MG63 bearing mice. Significance assessed using logrank test, p = 0.0002. h In-vivo tumor growth curves of KHOS tumors in NRG mice. Data are presented as mean values ± SEM. Significance assessed using a two-way repeated measure Anova (p = 0.0051), significant timepoints upon Benjamini-Hochberg procedure (t = 28 p = 0.036, t = 30 p = 0.027). i Tumor-free Kaplan-Meier survival curves of KHOS bearing mice. Significance assessed using logrank test, p = 0.0016.
Fig. 4
Fig. 4. EZHIP expression drives transcriptomic signatures of mesenchymal progenitors.
a Scatter plot showing principal component 1 and principal component 2 (PC1, PC2) for PCA of bulk RNA-seq (top 10000 variable genes) for MG63 CTL (N = 2, independent samples, only two CTL tumors formed), MG63 EZHIP over expression (OE) (N = 3, independent samples), KHOS CTL (N = 3, independent samples) and KHOS EZHIP over expression (OE) xenograft tumors (N = 3, independent samples). b Data analysis workflow for investigating normal cell type signatures in cell lines and xenograft tumors. c GSEA analysis of MG63 xenografts showing enrichment of Osteo-CAR and Adipo-CAR signatures (Baccin) and MSPC-Osteo/Adipo (Dolgalev). Blue or red colored bar indicates significant signature (adjusted P value < 0.01). Stars indicate common significant signatures in xenograft and in-vivo cell line. Significance assessed with weighted Kolmogorov–Smirnov statistics and P values adjusted using the Benjamini-Hochberg procedure. d GSEA analysis of MG63 xenografts showing enrichment of Osteo-CAR and Adipo-CAR signatures (Baccin) and MSPC-Osteo/Adipo (Dolgalev). Blue or red colored bar indicates significant signature (adjusted P value < 0.01). Stars indicate common significant signatures in xenograft and in-vivo cell line. Significance assessed with weighted Kolmogorov–Smirnov statistics and P values adjusted using the Benjamini-Hochberg procedure. e Left, ssGSEA scores for the Osteo-CAR and Adipo-CAR signatures in MG63 xenograft (CTL vs EZHIP over expression) (N = 2 and N = 3 independent samples, respectively, only two CTL tumors formed). Right, heatmap of bulk RNA expression (Z-scored normalized counts) for top significant differentially expressed genes in the Osteo-CAR/Adipo-CAR signature between MG63 CTL and MG63 EZHIP over expression (OE) xenograft tumours. f Left, ssGSEA scores for the Osteo-CAR and Adipo-CAR signatures in U2OS cell line (WT EZHIP vs EZHIP knock out). (N = 3 independent experiments for each genotype). Significance assessed with two-sided unpaired t-test (* < 0.05, ** < 0.01). Right, heatmap of bulk RNA expression (Z-scored normalized counts) for top significant differentially expressed genes in the Osteo-CAR/Adipo-CAR signature between U2OS WT EZHIP and U2OS EZHIP knock out (KO).
Fig. 5
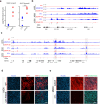
Fig. 5. WIF1 is upregulated by EZHIP expression in OS models.
a Dot plot of WIF1 log2 normalized read counts in MG63 xenografts (EZHIP, N = 3 and CTL, N = 2) and KHOS (N = 3 per genotype). Significance assessed using the Wald test statistic and P values adjusted using the Benjamini-Hochberg procedure (** < 0.01, **** <0.00001). b Spike in normalized CUT&RUN tracks from OS cell line models, revealing loss of H3K27me3 domains at WIF1 locus when EZHIP is expressed. c Spike in normalized CUT&RUN tracks from OS cell line models, revealing global loss of H3K27me3 and recurrent restriction to CGIs when EZHIP is expressed, highlighted in gray. d, e Representative snapshots of WIF1/H3K27me3 dual immunofluorescence on OS xenograft models demonstrating high protein expression of WIF1 restricted to H3K27me3 low regions. Scale bar, 100 µm. WIF1 staining repeated on 4 different MG63 xenografts per genotype (N = 4) and (N = 1) for U2OS from available tumors (only 1 U2OS R405E tumor formed, Fig. 2. I).
Fig. 6
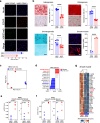
Fig. 6. EZHIP expression stalls mesenchymal differentiation.
a Top, Representative immunofluorescence images of hMSC EZHIP- and EZHIP+ cell lines displaying loss of H3K27me3 upon EZHIP overexpression. Bottom, bar graphs of corresponding fluorescence intensity quantification for H3K27me3 (n = 4), where n represents technical replicates. Data are presented as mean values ± SD. Scale bar, 50 µm. b Representative images of stained hMSC upon lineage-specific differentiation (top: EZHIP- cells, bottom: EZHIP+ cells) and corresponding quantification. Significance assessed by two-sided unpaired t-tests. Top left, Oil red O staining of lipids after adipogenic differentiation (N = 9, p = 0.0001, ****). Top right, Alizarin red S staining of calcified matrix produced after osteogenic differentiation (N = 9, p = 0.0001, ****). Bottom left, Alcian blue staining of sulfated glycosaminoglycan-rich matrix produced after chondrogenic differentiation (N = 9, p = 0.0002, ****). Bottom right, smooth muscle-specific calponin immunofluorescence after myogenic differentiation (N = 3, p = 0.0001, ****). All data are presented as mean values ± SD of N independent differentiation experiments. c Scatter plot showing principal component 1 and principal component 2 (PC1, PC2) for PCA of bulk RNA-seq (top 10000 variable genes) for hMSC WT and hMSC over expression (OE) (N = 3 independent experiments for each genotype). d GSEA of hMSC (EZHIP- vs EZHIP + ) showing significant enrichment of smooth muscle and Adipo-CAR signatures and a downregulation of mature osteoblast signatures. Blue or red colored bar indicates significant signature (adjusted P value < 0.01). Significance assessed with weighted Kolmogorov–Smirnov statistics and P values adjusted using the Benjamini-Hochberg procedure. e Left, ssGSEA scores for the smooth muscle signature from Di Micheli et al. in hMSC WT and hMSC EZHIP over expression (OE). Right, the percentage cells predicted to be smooth muscle cells in deconvolution analysis using Di Micheli et al. as the reference data set for hMSC WT and hMSC EZHIP over expression (OE). (N = 3 independent experiments for each genotype). Significance assessed with two-sided unpaired t-test (* < 0.05). f Left, ssGSEA scores for the smooth muscle signature from Baccin et al. in hMSC WT and hMSC EZHIP over expression (OE). Right, the percentage cells predicted to be smooth muscle cells in deconvolution analysis using Baccin et al. as the reference data set for hMSC WT and hMSC EZHIP over expression (OE). (N = 3 independent experiments for each genotype). Significance assessed with two-sided unpaired t-test (* < 0.05). g Heatmap showing bulk RNA expression (z-scored normalized counts) for the top significant differently expressed genes from the smooth muscle signatures in hMSC WT and hMSC EZHIP over expression (OE).
Fig. 7
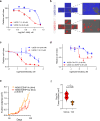
Fig. 7. EZHIP expressing cells display enhanced sensitivity to EZH2 inhibitors.
a UNC1999 dose response curves for U2OS C1 vs C54 cells (N = 3). Plot depicts mean values of 3 independent experiments, ±SEM. b Representative IncuCyte images at experimental endpoint for the highest UNC1999 dose depicting higher confluency of C54 well (U2OS EZHIP KO, blue mask) compared to C1 well (U2OS EZHIP WT, red mask). c Plot depicts mean values ± SEM of cell viability for Tazemetostat dose response curves of U2OS C1 vs C54 cells, N = 3 independent experiments. d Plot depicts mean values ± SEM of cell viability for Tazemetostat dose response curves of U2OS C54 EZHIP and CTL OE, N = 3 independent experiments. e In-vivo tumor growth curves of MG63 EZHIP tumors in NSG mice treated with Tazemetostat vs. vehicle (N = 4/group). Data are presented as mean values ± SEM. Significance assessed using two-sided F test on linear regression slopes (p = 0.0013). f Violin plots of tumor sizes of vehicle treated group vs. Tazemetostat group at last time point amenable to comparison (day 94) showing significantly smaller size of tumors treated with Tazemetostat (2 vs. 3 tumors). Significance assessed using unpaired t-test, two-sided, p = 0.028 (*).

References

    1. Savage, S. A. & Mirabello, L. Using epidemiology and genomics to understand osteosarcoma etiology. Sarcoma2011, 548151 (2011). - PMC - PubMed
    1. Chen, X. et al. Recurrent somatic structural variations contribute to tumorigenesis in pediatric osteosarcoma. Cell Rep.7, 104–112 (2014). - PMC - PubMed
    1. Behjati, S. et al. Recurrent mutation of IGF signalling genes and distinct patterns of genomic rearrangement in osteosarcoma. Nat. Commun.8, 15936 (2017). - PMC - PubMed
    1. Grobner, S. N. et al. The landscape of genomic alterations across childhood cancers. Nature555, 321–327 (2018). - PubMed
    1. Freeman, S. S. et al. Copy number gains in EGFR and copy number losses in PTEN are common events in osteosarcoma tumors. Cancer113, 1453–1461 (2008). - PMC - PubMed

LinkOut - more resources