. 2025 Jul 23;16(1):6768.
doi: 10.1038/s41467-025-61893-w.

Resolving the structural basis of therapeutic antibody function in cancer immunotherapy with RESI

Affiliations

Resolving the structural basis of therapeutic antibody function in cancer immunotherapy with RESI

Isabelle Pachmayr et al. Nat Commun. .

Abstract

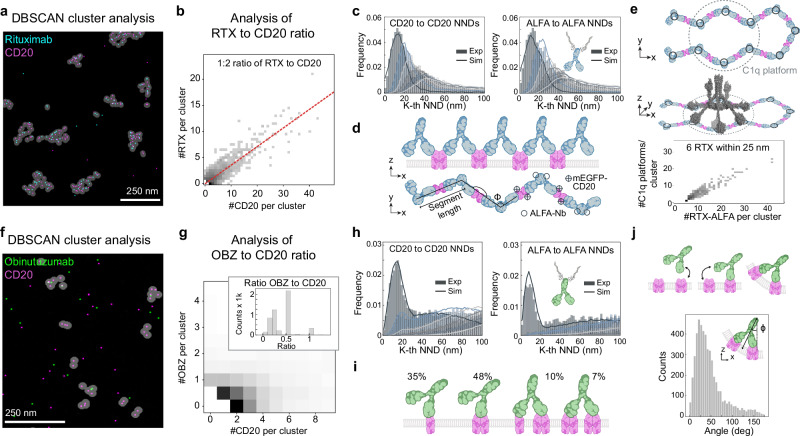
Monoclonal antibodies (mAb) are key therapeutic agents in cancer immunotherapy and exert their effects through Fc receptor-dependent and -independent mechanisms. However, the nanoscale receptor reorganization resulting from mAb binding and its implications for the therapeutic mode of action remain poorly understood. Here, we present a multi-target 3D RESI super-resolution microscopy technique that directly visualizes the structural organization of CD20 receptors and the Type I (e.g., Rituximab) and Type II (e.g., Obinutuzumab) anti-CD20 therapeutic antibodies and quantitatively analyze these interactions at single-protein resolution in situ. We discover that, while Type I mAbs promote higher-order CD20 oligomerization, Type II mAbs induce limited clustering, leading to differences in therapeutic function. Correlating RESI with functional studies for Type II antibodies with different hinge region flexibilities, we show that the oligomeric CD20 arrangement determines the Type I or Type II function. Thus, the nanoscale characterization of CD20-mAb complexes enhances our understanding of the structure-function relationships of therapeutic antibodies and offers insights into the design of next-generation mAb therapies.


Conflict of interest statement

Competing interests: M.L., S.H., M.B. and C.K. declare employment, patents (unrelated to this work) and stock ownership with Roche. The other authors declare no competing interests.

Figures

Fig. 1
Fig. 1. Assessing the structure-function relationship of anti-CD20 therapeutic antibodies in the cellular context using RESI microscopy.
a The structural configuration of CD20 proteins and their interactions with therapeutic antibodies on the cell membrane influence the therapeutic efficacy of the antibodies. b CD20 proteins (magenta) in the membrane exist as a mixture of monomers and pre-formed dimers. Rituximab (RTX) (cyan) can bind with 2 Fabs per CD20 dimer, thereby inducing higher-order arrangements of CD20 dimers,. However, the quantitative nature of the 3D cluster organization is still unknown. In contrast, Obinutuzumab (OBZ) (green) can bind with one Fab per single CD20 dimer, suggesting a terminal complex of up to CD20 tetramers by bridging two CD20 dimers. However, the resulting structural organization of CD20 – potentially forming monomers, dimers, trimers, or tetramers – remains to be fully elucidated. c We use two-target RESI super-resolution microscopy with four rounds per target to visualize and correlate the locations of mEGFP-tagged CD20 and ALFA-tagged therapeutic antibodies at single-protein resolution (sub-5 nm). CD20 is labeled in 1:1 stoichiometry and mAbs are labeled in a 2:1 stoichiometry. By performing eight consecutive DNA-PAINT imaging rounds and clustering localizations, we achieve precise RESI localizations (σ ≈ 0.6 nm) of the targets in their cellular context. Created with the help of BioRender (https://BioRender.com/y76v9f4 and https://BioRender.com/5575210).
Fig. 2
Fig. 2. Super-resolution imaging of CD20-therapeutic antibody complexes using RESI.
Imaging of cells treated with Rituximab (a) and Obinutuzumab (e) shows the distribution of CD20 and these therapeutic antibodies. Rituximab (cyan) colocalizes with CD20 (magenta), forming distinct higher-order structures on the cell membrane. In contrast, Obinutuzumab (green) and CD20 colocalize, yet appear homogeneously distributed without forming such structures. Transitioning from DNA-PAINT super-resolution (left side of dashed line) to RESI resolution (right side of dashed line) allows visualization of individual proteins in complexes. In (b), Rituximab-CD20 complexes exhibit clustered formations, while in (f), Obinutuzumab-CD20 complexes appear as few colocalizing molecules without evident higher-order clustering. 3D rotational views of the complexes reveal further structural details. For Rituximab-CD20 complexes (c, d), the 3D view shows that clusters are generally planar, suggesting a two-dimensional organization in the cell membrane. In contrast, Obinutuzumab-CD20 complexes (g, h) show up to four CD20 molecules colocalized with a single Obinutuzumab molecule, lacking the distinct planar higher-order structures observed in Rituximab-treated cells. Images are representative of three independent experiments. Scale bars in (c, d): 50 nm. Scale bars in (g, h): 20 nm.
Fig. 3
Fig. 3. Quantitative analysis and structural modeling of therapeutic antibody-CD20 complexes.
a DBSCAN analysis (marked in gray) of RTX (cyan)-CD20 (magenta) clusters shows distinct higher-order structures in 2D. b Quantitative analysis in 2D reveals a linear relationship between the number of RTX molecules and CD20 dimers. Two ALFA-Nbs correspond to one RTX per cluster. A linear fit yields 0.38, suggesting that approximately one RTX binds per CD20 dimer, when correcting for the labeling efficiency (for details, see Methods). c Nearest-Neighbor Distance (NND) analysis indicates a higher-order organization, which can be modeled by a flexible-chain arrangement. d The model includes anchor points at the RTX hinge regions, linear segments connecting these points, CD20 dimers located centrally along these segments and ALFA-Nbs located at the hinge regions. e The flexible-chain model can explain how RTX-CD20 interactions lead to the formation of U-shaped clusters to facilitate C1q binding. The number of hexameric RTX platforms was determined by counting each possible binding configuration of C1q (see Methods). f DBSCAN cluster analysis for OBZ (green) with CD20 in 2D shows smaller clusters compared to RTX-CD20. g Quantitative analysis reveals specific OBZ to CD20 stoichiometries, without a linear relationship between the number of OBZ and CD20 molecules. Two ALFA-Nbs correspond to one OBZ per cluster. h NND analysis for CD20 complexes suggests that CD20 does not form higher-order structures beyond tetramers at the cell surface. NND analysis of the ALFA-Nbs labeling OBZ reveals only a first NND peak, representing two ALFA-Nbs bound per single OBZ. The absence of a second NND peak excludes a higher-order arrangement of OBZ-CD20 clusters. i Simulations with CD20 monomers, dimers, trimers and tetramers, taking into account the labeling efficiency of the GFP-Nb, for this representative cell result in 35 % monomers, 48 % dimers, 10 % trimers and 7 % tetramers after OBZ treatment. j, We observe a 25° angle between OBZ bound to CD20 and the xy-plane of the cell membrane. This suggests the necessity of membrane bending to allow for OBZ binding to CD20 with two Fab arms simultaneously. Created with the help of BioRender (https://BioRender.com/y76v9f4 and https://BioRender.com/5575210).
Fig. 4
Fig. 4. Assessing the structure-function relationship of anti-CD20 antibodies.
a Schematic representation of CD20-CD3 TCE configurations: classical (c-TCE) and inverted (i-TCE), featuring an anti-CD20 monoclonal antibody (mAb) based on OBZ and an anti-CD3 Fab fragment at two different positions in the molecule. b, c RESI images of mAb-CD20 clusters when treated with c-TCE (b) and i-TCE (c). d, e Nearest-Neighbor Distance (NND) analysis of CD20 clusters treated with c-TCE (d) and i-TCE (e), showing increased frequencies of non-random sub-25-nm distances in the second and third NND histograms for i-TCE. Least-squares fit (solid lines) of monomers, dimers, trimers and tetramers shows an increased trimer- and tetramerization for i-TCE compared to c-TCE. f Bar graph depicting the percentage of CD20 oligomers in monomeric, dimeric, and higher-order forms (trimers and tetramers) for OBZ, c-TCE, and i-TCE. The frequency of trimers and tetramers is increased for i-TCE compared to c-TCE. The bars and error bars represent the mean and standard deviation, respectively. The number of biological replicates is n(OBZ) = 3, n(c-TCE)=n(i-TCE) = 4. Statistical significance was tested using a two-way ANOVA, adjusting for multiple comparisons (p = 0.0027). Source data are provided as a Source Data file. g Direct cell killing assay of CD20-positive Raji cells in untreated condition, and upon treatment with untagged versions of Rituximab (RTX), Obinutuzumab (OBZ), c-TCE, and i-TCE. i-TCE has a reduced killing efficiency compared to c-TCE, approaching values for Type I-RTX. The number of biological replicates is n = 3. The height of the bar and error bars represent mean and standard deviation, respectively. Statistical significance was tested using a one-way ANOVA, adjusting for multiple comparisons (p < 0.0001). Source data are provided as a Source Data file. h Graph depicting cell binding affinity in Raji cells across a range of mAb concentrations (0.01 to 100 nM) for untagged versions of RTX, OBZ, c-TCE, and i-TCE, measured as Mean Fluorescence Intensity (MFI) geometric mean. The results show an increased binding for i-TCE compared to c-TCE. The data points and error bars represent mean and standard deviation, respectively. The number of biological replicates is n = 3. Source data are provided as a Source Data file. Created with the help of BioRender (https://BioRender.com/y76v9f4 and https://BioRender.com/5575210).
Fig. 5
Fig. 5. 2-plex RESI imaging and quantitative analysis shows a structure-function relationship of Type I and Type II anti-CD20 therapeutic antibodies.
a RESI image of CD20 treated with Type I Ofatumumab shows higher-order CD20 arrangements. b NND analysis (histogram) and fitting with CD20-flexible chain model (solid line). Image is representative of three independent experiments. c Type I Ofatumumab forms flexible chains with a shorter segment length than Rituximab, i.e. 17 ± 2 nm. d RESI image of CD20 treated with Type II H299 (clone used for therapeutic antibody Tositumomab) shows limited CD20 oligomerization. Image is representative of three independent experiments. e NND analysis (histogram) and fitting with a model of monomers, dimers, trimers and tetramers (solid line). f Type II H299 forms oligomers similarly to Obinutuzumab. g Correlation of CD20 Type I or Type II-like function with CD20 oligomerization. Created with the help of BioRender (https://BioRender.com/y76v9f4 and https://BioRender.com/5575210).

Similar articles

References

    1. Pavlasova, G. & Mraz, M. The regulation and function of CD20: an “enigma” of B-cell biology and targeted therapy. Haematologica105, 1494–1506 (2020). - PMC - PubMed
    1. Tsao, L. C., Force, J. & Hartman, Z. C. Mechanisms of therapeutic antitumor monoclonal antibodies. Cancer Res. 81, 4641–4651 (2021). - PMC - PubMed
    1. Greenall, S. A. et al. Non-agonistic bivalent antibodies that promote c-MET degradation and inhibit tumor growth and others specific for tumor related c-MET. PLoS ONE7, e34658 (2012). - PMC - PubMed
    1. Tebbutt, N., Pedersen, M. W. & Johns, T. G. Targeting the ERBB family in cancer: couples therapy. Nat. Rev. Cancer13, 663–673 (2013). - PubMed
    1. Yu, X. et al. Complex interplay between epitope specificity and isotype dictates the biological activity of anti-human CD40 antibodies. Cancer Cell33, 664–675.e664 (2018). - PMC - PubMed

MeSH terms

LinkOut - more resources