. 2025 Jul 22;16(1):6411.
doi: 10.1038/s41467-025-61033-4.

Accelerated brain ageing during the COVID-19 pandemic

Affiliations

Accelerated brain ageing during the COVID-19 pandemic

Ali-Reza Mohammadi-Nejad et al. Nat Commun. .

Abstract

The impact of SARS-CoV-2 and the COVID-19 pandemic on brain health is recognised, yet specific effects remain understudied. We investigate the pandemic's impact on brain ageing using longitudinal neuroimaging data from the UK Biobank. Brain age prediction models are trained from hundreds of multi-modal imaging features using a cohort of 15,334 healthy participants. These models are then applied to an independent cohort of 996 healthy participants with two magnetic resonance imaging scans: either both collected before the pandemic (Control groups), or one before and one after the pandemic onset (Pandemic group). Our findings reveal that, even with initially matched brain age gaps (predicted brain age vs. chronological age) and matched for a range of health markers, the pandemic significantly accelerates brain ageing. The Pandemic group shows on average 5.5-month higher deviation of brain age gap at the second time point compared with controls. Accelerated brain ageing is more pronounced in males and those from deprived socio-demographic backgrounds and these deviations exist regardless of SARS-CoV-2 infection. However, accelerated brain ageing correlates with reduced cognitive performance only in COVID-infected participants. Our study highlights the pandemic's significant impact on brain health, beyond direct infection effects, emphasising the need to consider broader social and health inequalities.


Conflict of interest statement

Competing interests: R.G.J. reports research grants or contracts from AstraZeneca, Galecto, GlaxoSmithKline, Nordic Bioscience, Redx and Pliant, with all payments made to his institution. He has served as a consultant for AbbVie, AdAlta, Apollo Therapeutics, Arda Therapeutics, AstraZeneca, Brainomix, Bristol Myers Squibb, Chiesi, Cohbar, Galecto, GlaxoSmithKline, Mediar Therapeutics, Redx, Syndax and Pliant. He has received honoraria for lectures, presentations, speaker bureau participation, manuscript writing, or educational events from Boehringer Ingelheim, Chiesi, Roche and AstraZeneca. He has received payment for expert testimony from Pinsent Masons LLP. He has served on data safety monitoring boards or advisory boards for Boehringer Ingelheim, Galapagos and Vicore. He holds an unpaid advisory board role at NuMedii and serves as President of Action for Pulmonary Fibrosis. He is also Chair of the Editorial Board of BMJ Open Respiratory Research. All other authors declare no competing interests.

Figures
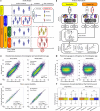
Fig. 1
Fig. 1. Study design, analysis framework, and accuracy assessment of brain age prediction models.
a A brain age prediction model was trained using 20-fold cross-validation on healthy participants with a single pre-pandemic scan (training set). The model was applied to an unseen set comprising the Pandemic group (G1) and the No Pandemic group (G2). G1 was further subdivided into Pandemic–COVID-19 (G3) and Pandemic–No COVID-19 (G4). b Imaging-derived phenotypes (IDPs) were extracted from grey matter (GM) and white matter (WM) across scan times. Separate prediction models were trained by tissue type and sex using pre-pandemic data, and then applied independently to scans from different time points to estimate brain age gap (BAG). Statistical analyses assessed pandemic- and infection-related effects using longitudinal data. c Scatter plots show predicted vs. chronological age for GM and WM models in females (males shown in Supplementary Fig. 2). The diagonal line indicates perfect prediction. ‘N’ is the number of subjects used for training. Model performance was evaluated using Pearson’s correlation (r) and mean absolute error (MAE), averaged across 100 repetitions. d Relationship between BAG and chronological age for GM and WM models, aggregated across sexes. The black regression line indicates no age-related bias. e Predicted brain ages at two time points show high reproducibility in both groups (Pearson’s r > 0.96). Intraclass correlation coefficients were 0.981 (95% CI: 0.977–0.985) for the Pandemic group and 0.983 (95% CI: 0.980–0.985) for the No Pandemic group, confirming temporal stability. Partial correlation analyses, controlling for chronological age, yielded r = 0.86 (95% CI: 0.83–0.88) for the Pandemic group and r = 0.88 (95% CI: 0.87–0.90) for the No Pandemic group. f Boxplots compare BAG distributions between the training set (N = 15,334) and unseen (first scan) set (N = 996), and between Pandemic (N = 432) and No Pandemic (N = 564) groups for GM and WM models. No significant differences were observed (GM: p(FDR) = 0.44, 0.23; WM: p(FDR) = 0.99, 0.28). Each scatter point represents a participant. Asterisks (****) indicate FDR-corrected p ≤ 0.0001; ‘ns’ denotes non-significant differences.
Fig. 2
Fig. 2. Effect of COVID-19 and the pandemic on brain ageing.
This figure illustrates the distribution of the rate of change in brain age gap (BAG) across different brain tissue models and subject groups. The left panel corresponds to the Grey Matter (GM) model, while the right panel represents the White Matter (WM) model. Each group is displayed using coloured half-violin plots: orange for the Pandemic group (G1, N = 432), blue for the No Pandemic group (G2, N = 564), red for the Pandemic–COVID-19 group (G3, N = 134), and green for the Pandemic–No COVID-19 group (G4, N = 298). The y-axis indicates the rate of change in brain age gap in months per year. Pairwise comparisons between groups were performed using two-sample t tests, with p-values corrected for multiple comparisons using FDR. Cohen’s d values, which quantify the effect size of group differences, were also calculated.
Fig. 3
Fig. 3. Impact of SARS-CoV-2 infection and the COVID-19 pandemic on brain ageing, and the role of age and sex.
a Rate of change in brain age gap (BAG) is plotted against the average chronological age between two scans for the Pandemic–COVID-19, Pandemic–No COVID-19, and No Pandemic groups. Solid lines show best-fit associations; dot-dashed curves indicate 95% confidence intervals. b Violin plots display the distribution of the rate of change in brain age gap stratified by sex and pandemic status. For females: Pandemic group (G1), N = 255; No Pandemic group (G2), N = 297. For males: G1, N = 177; G2, N = 267. Cohen’s d-values, representing effect sizes, are reported for each comparison, alongside the FDR-corrected p-values from two-sample t tests between the groups. Interaction plots on the right highlight distinct patterns in grey matter (GM) and (white matter) WM between groups. Stars in the interaction plots indicate significant results, based on the FDR-corrected p-values of the interaction analysis determined by the two-factor, two-level permutation test. GM model results are displayed on the left and WM model results on the right in both panels.
Fig. 4
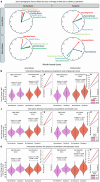
Fig. 4. Influence of socio-demographic factors on brain ageing during the COVID-19 pandemic.
a The effects of socio-demographic factors, represented by indices of deprivation, on brain ageing in participants grouped by pandemic status. Each clock represents the difference in the mean rate of change in brain age gap (BAG) between individuals with low and high levels of specific socio-demographic factors. The clocks are presented separately for GM and WM models, with one set depicting participants in the No Pandemic group and another for participants in the Pandemic group. The socio-demographic factors studied include housing score, health score, employment score, income score, and education score. bd Violin plots display the distribution of the rate of change in BAG for the Pandemic and No Pandemic groups, stratified by socio-demographic scores for (b) employment (No Pandemic: N = 111 low, N = 129 high; Pandemic: N = 105 low, N = 102 high), (c) health (No Pandemic: N = 110 low, N = 159 high; Pandemic: N = 111 low, N = 123 high), and (d) education (No Pandemic: N = 223 low, N = 126 high; Pandemic: N = 157 low, N = 95 high). High and low groups are colour-coded as purple and red, respectively. Each panel includes two plots for GM (left) and WM (right) results. Cohen’s d effect sizes and FDR-corrected p-values are reported for group comparisons based on two-sample t tests. Small plots on the right side of each panel depict interaction plots, suggesting the presence of interaction effects. These plots visualise how the mean rate of change in BAG deviates between the No Pandemic and Pandemic groups in both GM and WM models. Stars in the interaction plots indicate significant results based on the FDR-corrected p-values, calculated based on a two-factor, two-level permutation test, highlighting the interaction between the two factors.
Fig. 5
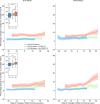
Fig. 5. Impact of COVID-19 on cognitive performance across rates of change in brain age gap.
The figure illustrates the percentage change in completion time for the Trail Making Test A (TMT-A, top row) and Trail Making Test B (TMT-B, bottom row) over two imaging time points across varying rates of change in brain age gap (BAG). Results are shown for the Pandemic–COVID-19 (G3, N = 134; red), Pandemic–No COVID-19 (G4, N = 298; green), and No Pandemic (G2, N = 564; blue) groups, using both grey matter (GM, left panels) and white matter (WM, right panels) models. A three-year sliding window was used to smooth the curves. Standard error is indicated using shaded areas: light blue (G2), light green (G4), and light red (G3). Boxplots (upper left of each row) display the raw distribution of percentage change in TMT performance, without a sliding window, for GM and WM models. Participants with COVID-19 (G3) showed greater decline in performance (i.e., longer completion times) compared to the Control group (G2), with FDR-corrected p-values of 1.0e-6 (TMT-A) and 9.1e-5 (TMT-B). Significant differences were also observed between COVID-infected (G3) and non-infected (G4) Pandemic participants (FDR-corrected p-values: 7.2e-4 (TMT-A) and 7.4e-4 (TMT-B)). Asterisks indicate statistical significance: *** denotes FDR-corrected p ≤ 0.001; **** denotes FDR-corrected p ≤ 0.0001. Group differences were assessed using two-sample t tests.

Similar articles

Cited by

References

    1. Zeng, N. et al. A systematic review and meta-analysis of long term physical and mental sequelae of COVID-19 pandemic: call for research priority and action. Mol. Psychiatry28, 423–433 (2023). - PMC - PubMed
    1. Douaud, G. et al. SARS-CoV-2 is associated with changes in brain structure in UK Biobank. Nature604, 697–707 (2022). - PMC - PubMed
    1. Mavrikaki, M., Lee, J. D., Solomon, I. H. & Slack, F. J. Severe COVID-19 is associated with molecular signatures of aging in the human brain. Nat. Aging2, 1130–1137 (2022). - PubMed
    1. Xiong, J. et al. Impact of COVID-19 pandemic on mental health in the general population: A systematic review. J. Affect Disord.277, 55–64 (2020). - PMC - PubMed
    1. Ahmed, N. et al. Mental health in Europe during the COVID-19 pandemic: a systematic review. Lancet Psychiatry10, 537–556 (2023). - PMC - PubMed