. 2025 Jul 22;16(1):6765.
doi: 10.1038/s41467-025-61878-9.

Intestinal tuft cell subtypes represent successive stages of maturation driven by crypt-villus signaling gradients

Affiliations

Intestinal tuft cell subtypes represent successive stages of maturation driven by crypt-villus signaling gradients

Julian R Buissant des Amorie et al. Nat Commun. .

Abstract

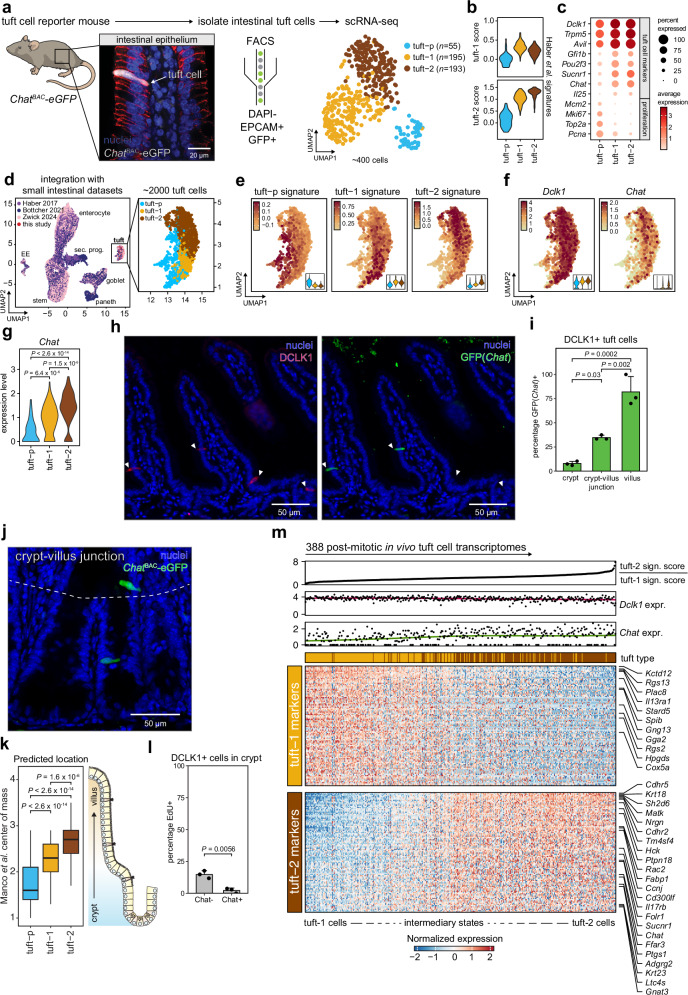
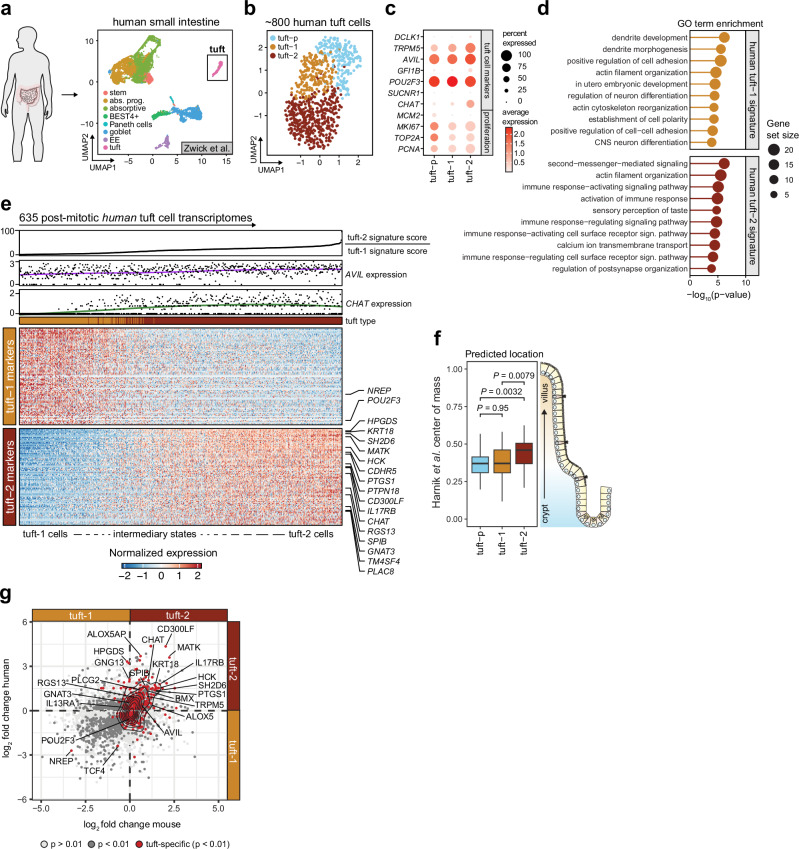
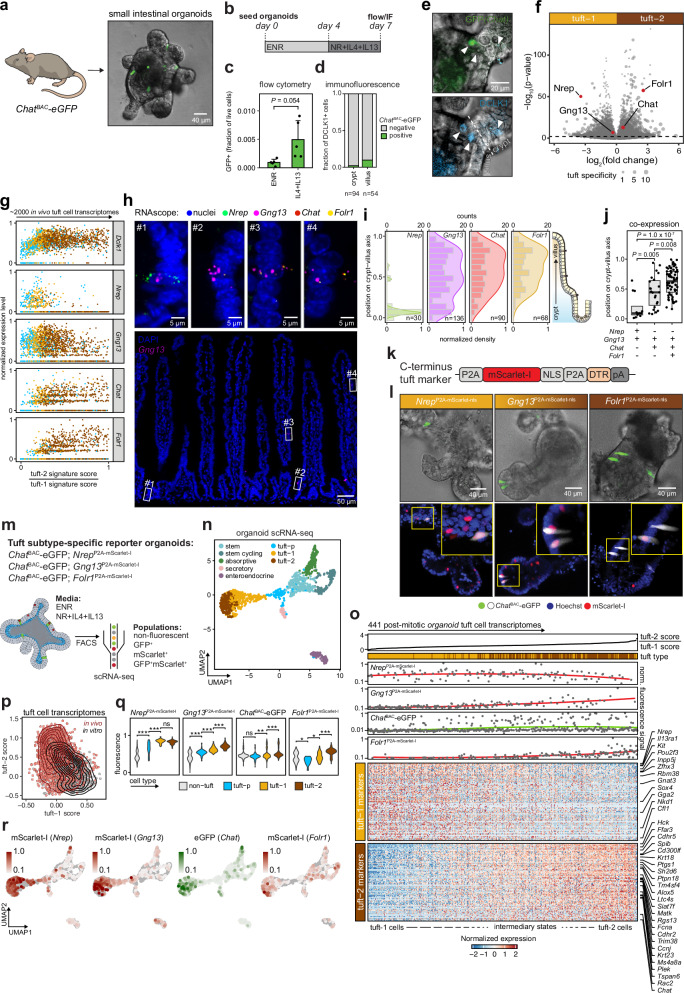
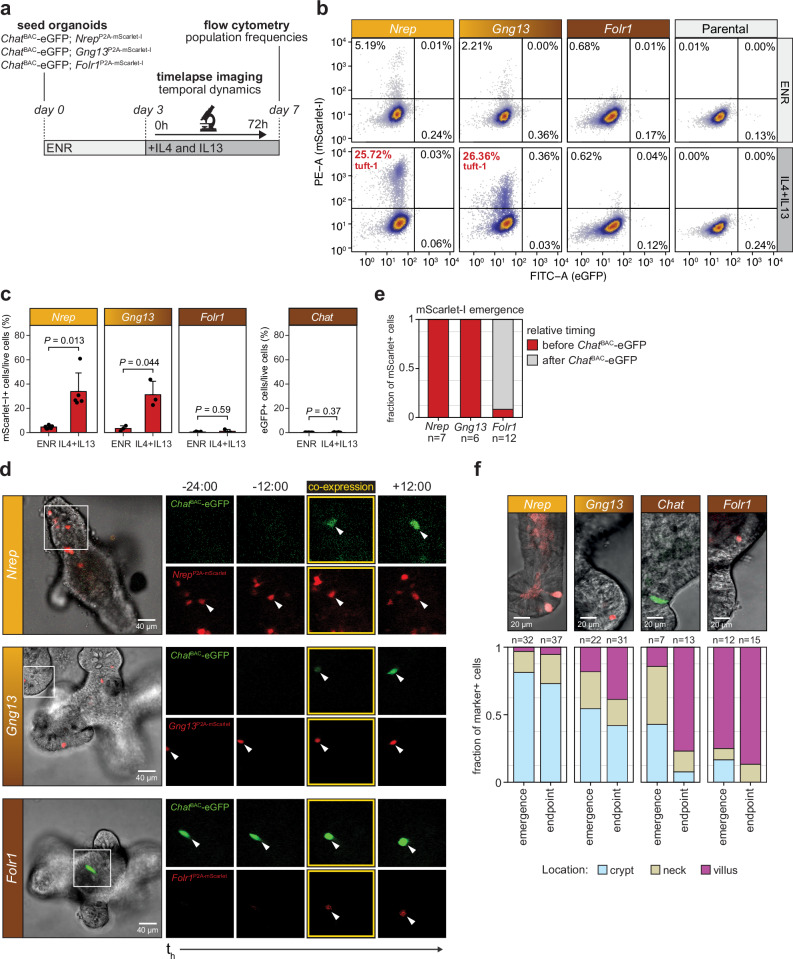
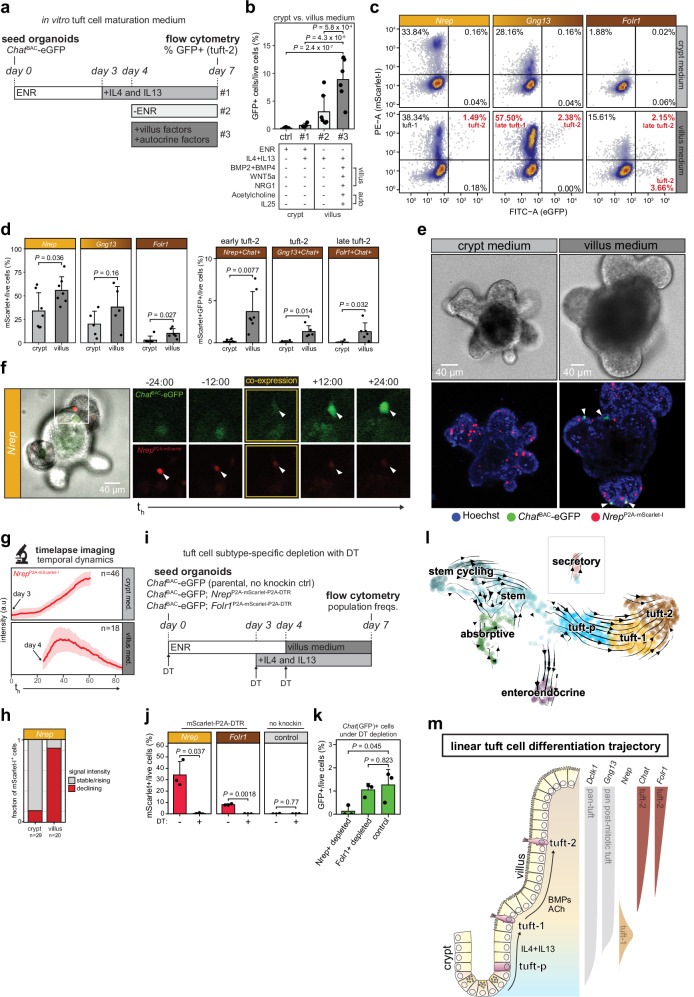
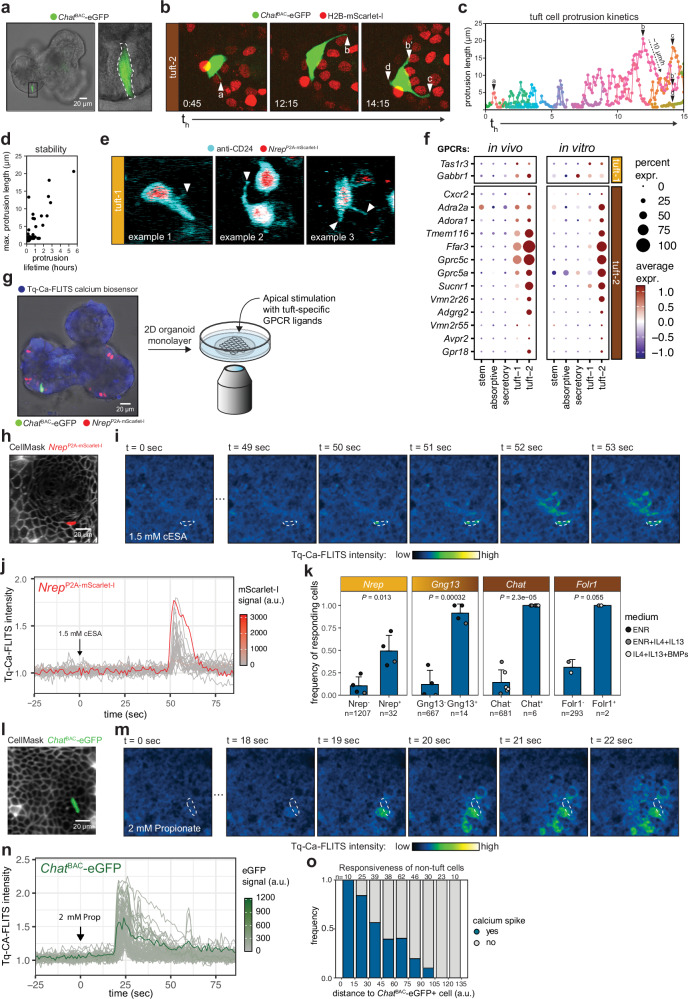
Intestinal tuft cells are epithelial sentinels that trigger host defense upon detection of parasite-derived compounds. While they represent potent targets for immunomodulatory therapies in inflammation-driven intestinal diseases, their functioning and differentiation are poorly understood. Here, we reveal common intermediary transcriptomes among the previously described tuft-1 and tuft-2 subtypes in mouse and human. Tuft cell subtype-specific reporter knock-ins in organoids show that the two subtypes reflect successive post-mitotic maturation stages within the tuft cell lineage. In vitro stimulation with interleukin-4 and 13 is sufficient to fuel the generation of new Nrep+ tuft-1 cells, arising from tuft precursors (tuft-p). Subsequently, changes in crypt-villus signaling gradients, such as BMP, and cholinergic signaling, are required to advance maturation towards Chat+ tuft-2 phenotypes. Functionally, we find chemosensory capacity to increase during maturation. Our tuft subtype-specific reporters and optimized differentiation strategy in organoids provide a platform to study immune-related tuft cell subtypes and their unique chemosensory properties.


Conflict of interest statement

Competing interests: H.C. is the head of Pharma Research and Early Development at Roche, Basel, and holds several patents related to organoid technology. The full disclosure is given at https://www.uu.nl/staff/JCClevers/ . The other authors declare no competing interests.

Figures

Fig. 1
Fig. 1. Gradual Chat expression marks a continuum of zonated tuft cell states on the crypt-villus axis.
a Left: zoom-in of intestinal villus where ChatBAC-eGFP marks solitary tuft cells (white), with epithelial membrane (b-catenin, red) and nuclear staining (blue). Middle: FACS strategy for scRNA-seq of GFP+ cells from ChatBAC-eGFP mice (n = 3). Right: UMAP with unsupervised clustering of 443 ChatBAC-eGFP+ tuft cells. Tuft-p: tuft-precursors. Illustration from NIAID NIH BIOART Source bioart.niaid.nih.gov/bioart/279. b Violin plots depicting distribution of tuft-1 and tuft-2 signature scores per cluster. c Single-cell dot plot showing expression of tuft cell and proliferation markers per cluster. d Left: UMAP of integrated single-cell transcriptomic datasets of mouse small intestinal epithelium. Cells are colored by study origin. Right: zoom-in of tuft cell cluster (~2000 cells). EE: enteroendocrine cells. Sec. prog.: secretory progenitors. e Relative expression of tuft-p, tuft-1 and tuft-2 signatures (top 100 differentially expressed genes) overlayed on UMAP of integrated tuft cell cluster and as violin plots (insets). Signatures were extracted from ChatBAC-eGFP+ tuft clusters in (a). f Relative expression of Dclk1 and Chat overlayed on UMAP of integrated tuft cell cluster and as violin plots (insets). g Violin plot depicting distribution of relative Chat expression for all cells per cluster (ANOVA p = 1.85  × 10−15, Tukey HSD test). h Fluorescent image of ChatBAC-eGFP mouse small intestine stained for DCLK1 (red), GFP (green) and nuclei (blue). White arrows: DCLK1+ tuft cells. i Quantification of frequency of Chat+ cells among DCLK1+ cells for indicated regions on the crypt-villus axis (n = 3 mice, 267 DCLK1+ tuft cells, ANOVA P = 0.0002, Tukey HSD test). j Representative image showing lower expression of ChatBAC-eGFP in tuft cells in crypt regions. White dashed line: crypt-villus junction. k Zonation profile of tuft-p, tuft-1 and tuft-2 clusters (panel a). Boxplots show center of mass on the crypt-villus axis for the top 100 cluster-specific genes featured in Manco et al. dataset. Boxes in Tukey box-and-whisker plot represent interquartile range (IQR, Q1 (25th percentile) to Q3 (75th percentile)), central lines mark median values and whiskers indicate outlier boundaries (1.5x IQR) (ANOVA P < 2 × 10−16, Tukey HSD test). l Barplot depicting frequency of EdU+ cells, split by Chat phenotype (Chat+ or Chat-), among DCLK1+ cells in the crypt (n = 3 mice, 112 DCLK1+ tuft cells, t-test). m Heatmap showing co-expression of tuft-1 and tuft-2 marker genes (genes with adjusted P value < 0.01 are shown, Wilcoxon rank-sum test with Bonferroni correction). Cells from the post-mitotic tuft-1 and tuft-2 clusters (panel a) are ordered by the ratio of tuft-1 and 2 scores, indicated at the top of the heatmap. Relative Dclk1 and Chat expression per cell are shown above the heatmap.
Fig. 2
Fig. 2. Small intestinal tuft cell phenotypes are conserved between mouse and human.
a Schematic and UMAP of published single-cell transcriptomics dataset of human small intestine. Cell types are annotated by color. EE: enteroendocrine cells. Abs. prog.: absorptive progenitors. Sec. prog.: secretory progenitors. Illustration from NIAID NIH BIOART Source bioart.niaid.nih.gov/bioart/232. b Unsupervised clustering of 844 human tuft cells identifies three separate tuft cell populations. c Single cell dot plot showing expression of tuft cell and proliferation markers per cluster. Average expression is represented by dot color while the percentage of expressing cells is denoted by the dot size. d Lollipop plot showing GO-term enrichment analysis (clusterProfiler; Biological Process) of human tuft-1 and tuft-2 expression profiles. Dot size represents the number of genes within the gene set, stalk length corresponds to significance (one-sided Fisher’s exact test). e Heatmap showing co-expression of tuft-1 and tuft-2 marker genes in human post-mitotic tuft cells (genes with adjusted P value < 0.01 are shown, Wilcoxon rank-sum test with Bonferroni correction). Transcriptomic profiles are ordered by their ratio of human tuft-1 and 2 signature scores, indicated at the top of the heatmap. AVIL and CHAT expression per cell is shown above the heatmap. f Zonation profile of human tuft-1 and tuft-2 populations from (b). Center of mass on crypt-villus axis for the top 50 cluster-specific genes is shown. Boxes in Tukey box-and-whisker plot represent interquartile range (IQR, Q1 (25th percentile) to Q3 (75th percentile)), central lines mark median values and whiskers indicate outlier boundaries (1.5*IQR) (ANOVA P = 0.002, Tukey HSD test). g Differential expression analysis between tuft-1 and tuft-2 subtypes in mouse and human (Wilcoxon rank-sum test). Tones of gray represent significance level. Tuft-specific genes, shared between human and mice, are highlighted in red. Contour plot indicates density distribution of these shared tuft-specific genes.
Fig. 3
Fig. 3. Tuft subtype-specific reporter knock-ins enable identification of tuft-1 and tuft-2 transcriptional states in vitro.
a Representative phase contrast image with fluorescent GFP (green) overlay of small intestinal organoid derived from ChatBAC-eGFP mouse (n = 50 organoids examined). Illustration from NIAID NIH BIOART Source bioart.niaid.nih.gov/bioart/279. b Treatment regimen for tuft cell induction with IL-4 and IL13. E: EGF, N: Noggin, R; R-spondin, IF: immunofluorescence. c Flow cytometry analysis of GFP(Chat)+ cells in organoids cultured in ENR with or without IL-4 and IL-13 according to the regimen shown in (b) (n = 3 independent experiments, t-test). E: EGF, N: Noggin, R; R-spondin. d Quantification of GFP(Chat)+ cells among DCLK1+ cells in crypt and villus region of organoids assessed by immunofluorescence following cytokine treatment as in (b). e Representative image of ChatBAC-eGFP (top, green) organoid following cytokine treatment as in (b) and stained for DCLK1 (bottom, blue). White arrows: DCLK1+ tuft cells. White dashed line: crypt-villus junction (n = 148 DCLK1+ cells examined). f Vulcano plot showing differentially expressed genes (Wilcoxon rank-sum test) between tuft-1 and tuft-2 clusters from the integrated mouse in vivo single-cell transcriptomic dataset (Fig. 1d). Genes selected for reporter knock-ins are highlighted in red. Point size represents tuft specificity (see “Methods”). g Relative expression levels of general tuft cell marker Dclk1 and selected reporter genes in all tuft cells from the integrated mouse in vivo single-cell transcriptomics dataset (Fig. 1d). Cells are ranked based on their normalized tuft-2/1 signature score ratio. h Representative fluorescence image of RNAscope FISH on mouse small intestinal tissue (n = 4) targeting Nrep (green), Gng13 (magenta), Chat (red) and Folr1 (yellow). Bottom: overview image showing entire crypt-villus units with nuclei (blue) and Gng13 (magenta). Top: zoom-ins showing expression of the four markers at four positions along the crypt-villus axis. i Location of cells expressing indicated tuft cell markers on crypt-villus axis. Numbers of analyzed cells are indicated (n = 2 mice). Histograms of counts and normalized density plots are shown. j Co-expression of indicated tuft cell markers along the crypt-villus axis. Boxes in Tukey box-and-whisker plot represent interquartile range (IQR, Q1 (25th percentile) to Q3 (75th percentile)), central lines mark median values and whiskers indicate outlier boundaries (1.5x IQR) (n = 101 cells from 2 mice, ANOVA P = 5.8 × 10−8, Tukey HSD test). k Schematic of knock-in template integrated at C-terminus of reporter genes. NLS: nuclear localization signal. mScarlet-I: monomeric red fluorescent protein. DTR: diphtheria toxin receptor. pA: polyadenylation signal. l Top: Confocal brightfield images of tuft subtype-specific reporter knock-in organoids, overlayed with fluorescent ChatBAC-eGFP signal (green). Bottom: fluorescent overlays of ChatBAC-eGFP+ tuft cells (white) with indicated tuft-subtype reporters (red) and nuclear stain (blue) (n = 20 organoids examined per knock-in). m Experimental setup of reporter lines, culture conditions and flow cytometry to enrich for fluorescent tuft cells prior to plate-based single-cell transcriptomic analysis. n UMAP with unsupervised clustering of organoid single-cell transcriptomic dataset, containing cells from all three knock-in tuft subtype reporter lines and both medium conditions. o Heatmap showing co-expression of tuft-1 and tuft-2 marker genes in organoid tuft cells (genes with adjusted P value < 0.01 are shown, Wilcoxon rank-sum test with Bonferroni correction). Organoid tuft cell transcriptomic profiles are ordered by the ratio of mouse tuft subtype signature scores (tuft-2 score / tuft-1 score). Original tuft subtype (yellow: tuft-1; brown: tuft-2) and normalized fluorescent mScarlet-I and eGFP signals of cells during sorting are indicated for each cell at the top of the heatmap. p Contour plot showing density of tuft-1 and tuft-2 signature scores ratios for tuft cells from the integrated in vivo dataset (Fig. 1d, red), as well as the organoid dataset (Fig. 3n, black), indicating underrepresentation of mature tuft-2 cells in vitro. q Violin plots of normalized fluorescent signal for each reporter per indicated cell cluster (ANOVA P < 0.001, ns not significant, *** adjusted P value < 0.0001, * adjusted P value < 0.05, exact P values are included in the Source Data, Tukey HSD test). r Normalized mScarlet-I and eGFP fluorescent signal intensities measured during cell sorting, superimposed on UMAP of organoid single-cell transcriptomic dataset. Source Data
Fig. 4
Fig. 4. Cytokines drive the generation of new tuft-1 cells but are insufficient to advance their maturation.
a Schematic of experimental setup showing organoid knock-in reporters, treatment regimen and readout strategies (timelapse microscopy and flow cytometry). ENR: EGF, Noggin and R-spondin medium. b Representative flow cytometry analysis of the three indicated tuft subtype-specific mScarlet-reporter lines and the parental ChatBAC-eGFP line (parental). All lines were treated with IL-4 and IL-13 for 4 days, 3 days after seeding in ENR medium as illustrated in (a). Percentages of the fluorescent populations are indicated in each plot. Individual panels contain combined data from 3 independent experiments, 5000 cells are shown per plot. c Flow cytometry quantifications of tuft-subtype reporter frequencies (%) upon induction with indicated cytokines as in (a) (n = 5 (Nrep), 3 (Gng13 and Folr1) and 8 (Chat) independent experiments, t-test). d Microscopic stills from live imaging experiments demonstrating the temporal dynamics of tuft subtype reporters. Left: confocal brightfield image of organoids at the start of imaging, overlayed with fluorescent signals of indicated reporters. Right: stills of fluorescence channels (mSarlet-I: red, eGFP: green) from timepoints preceding and following co-expression of fluorescent markers to visualize differential dynamics with respect to ChatBAC-eGFP. Cell that shows co-expression is indicated with a white arrowhead throughout imaging timepoints. e Quantification of mScarlet-I emergence relative to ChatBAC-eGFP expression for the three indicated tuft sutype-specific reporter knock-ins. f Top: Representative confocal brightfield image with overlay of indicated fluorescent reporter. Bottom: Location distribution of tuft-reporter+ cells along the crypt-villus axes within organoids scored at emergence of reporter+ cells versus the end of imaging procedure.
Fig. 5
Fig. 5. Crypt-villus signaling gradients advance maturation from tuft-1 to tuft-2 states.
a Experimental setup to promote tuft cell maturation with villus-inspired medium. ChatBAC-eGFP reporter organoids were pretreated with IL-4 and IL-13 on the 3rd day after seeding in ENR (EGF, Noggin and R-spondin) medium. On the 4th day, factors were added to, or depleted from, the medium. Frequency of GFP(Chat)+ tuft-2 induction was tested at day 7 with flow cytometry. b Percentage of ChatBAC-eGFP+ tuft-2 cells in organoids treated with culture medium (ctrl, n = 11) or IL-4 and IL-13 in presence (#1, n = 4) or absence (#2, n = 7) of crypt or villus/autocrine-inspired signaling factors (#3, n = 6) (ANOVA P = 6.8 × 10−7, Tukey HSD test). c Representative flow cytometry analysis of fluorescent population frequencies in indicated reporter organoids treated with crypt (#1) or villus-inspired medium (#3) after IL-4 and IL-13 pretreatment. 5000 cells are shown per plot. d Percentage of mScarlet+ (left) and mScarlet+GFP+ (right) cells in indicated organoid reporter lines treated with crypt or villus-inspired medium (condition #1 vs #3, Fig. 5a, b) measured by flow cytometry (n = 7 (Nrep), 5 (Gng13) and 6 (Folr1) independent experiments, t-test). e Representative fluorescence image of ChatBAC-eGFP;NrepP2A-mScarlet-I organoids treated with crypt or villus-inspired medium regimen (condition #1 vs #3, Fig. 5a, b). White arrows: ChatBAC-eGFP+ cells. f Microscopic stills from live imaging experiments of ChatBAC-eGFP;NrepP2A-mScarlet-I organoids in villus-inspired medium (condition #3 of Fig. 5a, b). Left: confocal brightfield image of organoid at the start of imaging. Right: stills of fluorescence channels (mSarlet-I: red, eGFP: green) from timepoints preceding and following co-expression of fluorescent markers. Cell that shows co-expression is indicated with a white arrowhead throughout imaging timepoints (n = 2 independent experiments). g Average mScarlet-I signal over time in ChatBAC-eGFP;NrepP2A-mScarlet-I organoids treated with crypt or villus-inspired medium regimen (condition #1 vs #3, Fig. 5a, b). Shading in plot represents SEM. Number of cells comprising each graph are indicated. h Barplot showing fraction of mScarlet-I+ cells in ChatBAC-eGFP;NrepP2A-mScarlet-I organoids with stable/rising or declining fluorescence signal in crypt or villus medium with cytokines (IL4 + IL13). Related to g. Number of cells comprising each graph are indicated. i Experimental setup for tuft cell subtype-specific depletion with diphtheria toxin (DT). Organoids were treated as in condition #3 of Fig. 5a, b and DT was added with every medium change. j Percentage of mScarlet+ cells in indicated reporter lines and parental no knock-in control (ChatBAC-eGFP; no mScarlet-I or DTR) after differentiation during depletion with DT (n = 3 independent experiments, t-test). k Percentage of GFP+ cells in indicated reporter lines and parental no knock-in control (ChatBAC-eGFP; no mScarlet-I or DTR) after differentiation during depletion with DT (n = 3 independent experiments, ANOVA P = 0.04, Tukey HSD test). l RNA velocity-based trajectory inference with single cell transcriptomes from organoids treated with ENR, NR + IL4 + IL13 or villus-inspired medium superimposed on UMAP. Direction of arrows predict unidirectional differentiation from tuft-1 to tuft-2 transcriptomic states. m Schematic depicting linear model of intestinal tuft cell differentiation. Tuft-p: tuft precursors; IL4: interleukin-4; IL13: interleukin-13; ACh: acetylcholine; BMPs: bone morphogenetic proteins.
Fig. 6
Fig. 6. An organoid-based platform for functional characterization of tuft cell properties.
a Microscopic images of ChatBAC-eGFP+ cell in organoid showing typical tuft cell morphology (observed in 3 independent experiments). Left: overview confocal brightfield image overlayed with GFP fluorescence channel. Right: zoom-in of indicated region. White dotted line outlines ChatBAC-eGFP+ tuft cell. b Dynamic protrusions in Chat+ tuft-2 cells that can span several neighboring cells. Merge of fluorescence channels is shown: green, eGFP; red, nuclei visualized with H2B-mScarlet-I. Three stills of indicated timepoints are shown. White triangles with letters indicate protrusions. c. Protrusion lengths over time. Triangles with letters indicate single protrusion tracks corresponding to protrusions shown in microscopy images of (b). d Relationship between maximum protrusion length and protrusion lifetime. e Microscopic stills from live imaging of NrepP2A-mScarlet-I-nls organoids stained with anti-CD24, visualizing membrane protrusions of Nrep+ tuft-1 cells. Merge of fluorescence channels is shown: cyan, anti-CD24; red, NrepP2A-mScarlet-I-nls. White triangles with letters indicate protrusions. Three different examples of Nrep+ cells with dynamic protrusions are shown. f Relative expression level of tuft-specific GPCRs within indicated cell types, as extracted from the mouse in vivo integrated single-cell dataset (Fig. 1d) and organoids (Fig. 3n). g Experimental setup for live imaging experiments to monitor tuft cell activation. Tuft-subtype reporter organoids expressing the Tq-Ca-FLITS calcium biosensor (left, representative image of 10 examined organoids) are re-plated to form 2D monolayers that can be apically stimulated and are compatible with high temporal resolution imaging (right). h Fluorescent image of 2D monolayer of reporter organoid with CellMask deep red incubation to label cell boundaries (membranes, white) and mScarlet-I reporter signal to label tuft identity. Image is prior to stimulation with cis-epoxysuccinic acid (cESA) (n = 3 independent experiments). i Fluorescent intensity fluctuations of Tq-Ca-FLITS biosensor within the field-of-view cell monolayer as shown in (d), following stimulation with cESA at t = 0. Time (seconds) post cESA exposure is indicated at the top of each panel. White outline indicates Nrep+ tuft cell. j Single-cell traces of Tq-Ca-FLITS intensity fluctuations within monolayer of (e). Traces are colored by mScarlet-I signal measured in the corresponding cell. k Responsiveness of tuft-reporter positive cells following stimulation with 1.5 mM cESA. Per bar, each point represents a separate experiment and is colored for the medium used (number of cells comprising each bar and p-values are indicated, t-test). l As in panel d, but now monolayer of ChatBAC-eGFP reporter organoid prior exposure to propionate (n = 2 independent experiments). m As in panel e, but Tq-Ca-FLITS intensity fluctuation post propionate exposure. Time since propionate addition is indicated at the top of each panel. Arrow indicates ChatBAC-eGFP+ tuft cell. n Single-cell traces of Tq-Ca-FLITS intensity fluctuations within monolayer of panel i. Traces are colored by GFP signal measured in the corresponding cell. o Responsiveness of non-tuft cells (mScarlet-I GFP) in the proximity of the ChatBAC-eGFP+ cell shown in (h). Number of cells comprising each bar are indicated at the top of each bar. Results of one representative experiment are shown.

Similar articles

References

    1. Kotas, M. E., O’Leary, C. E. & Locksley, R. M. Tuft cells: context- and tissue-specific programming for a conserved cell lineage. Annu. Rev. Pathol.18, 311–335 (2023). - PMC - PubMed
    1. Banerjee, A. et al. Succinate produced by intestinal microbes promotes specification of tuft cells to suppress ileal inflammation. Gastroenterology159, 2101–2115 (2020). - PMC - PubMed
    1. O’Keefe, R. N. et al. A tuft cell - ILC2 signaling circuit provides therapeutic targets to inhibit gastric metaplasia and tumor development. Nat. Commun.14, 6872 (2023). - PMC - PubMed
    1. Howitt, M. R. et al. Tuft cells, taste-chemosensory cells, orchestrate parasite type 2 immunity in the gut. Science (1979)351, 1329–1333 (2016). - PMC - PubMed
    1. Gerbe, F. et al. Intestinal epithelial tuft cells initiate type 2 mucosal immunity to helminth parasites. Nature529, 226–230 (2016). - PMC - PubMed

LinkOut - more resources