. 2025 Jul 22;11(1):337.
doi: 10.1038/s41420-025-02627-1.

MARCO expression on myeloid-derived suppressor cells is essential for their differentiation and immunosuppression

Affiliations

MARCO expression on myeloid-derived suppressor cells is essential for their differentiation and immunosuppression

Sijia Liu et al. Cell Death Discov. .

Abstract

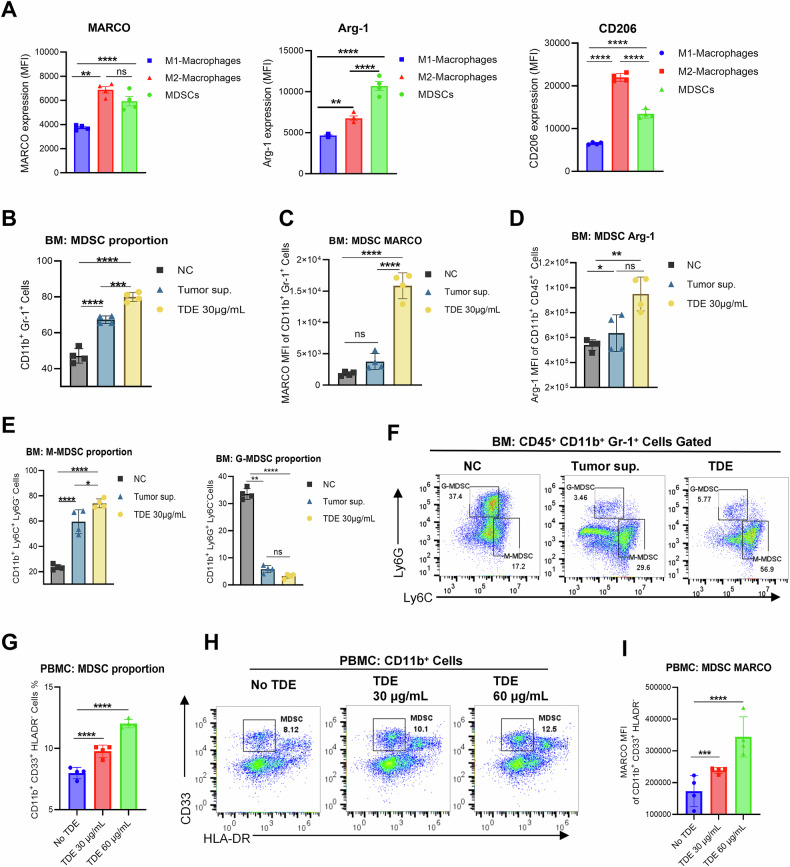
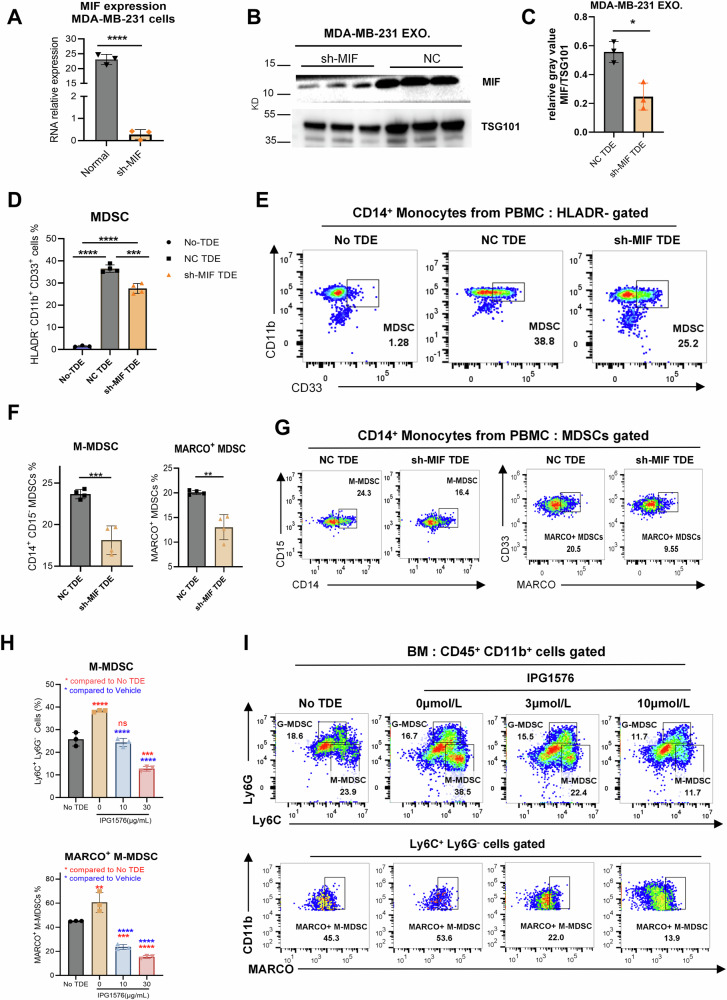
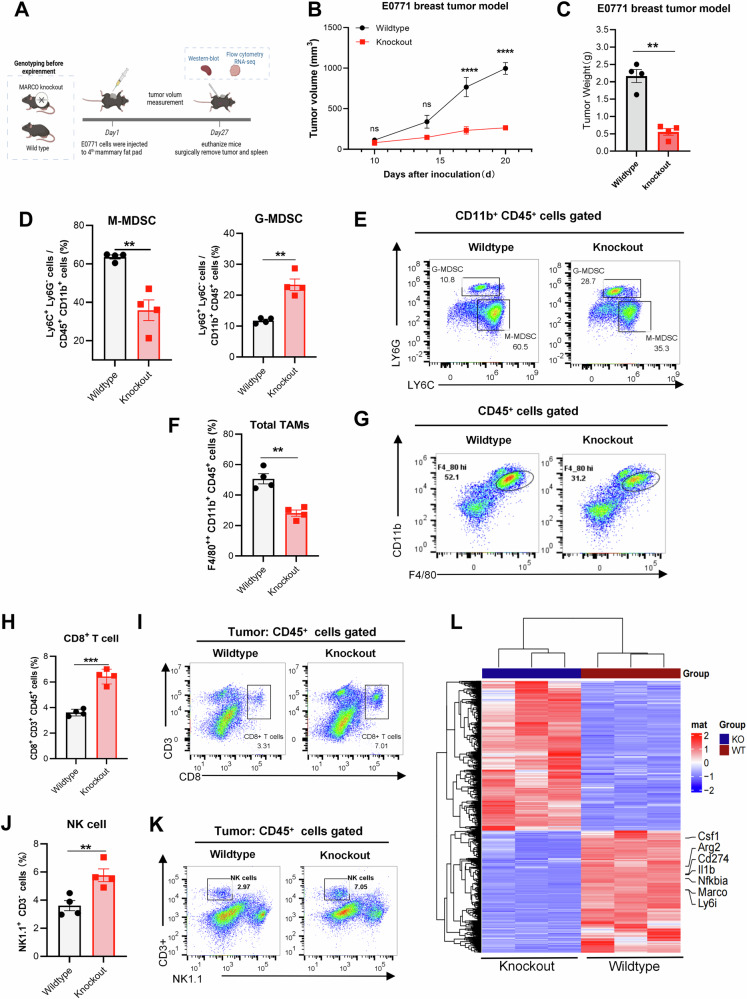
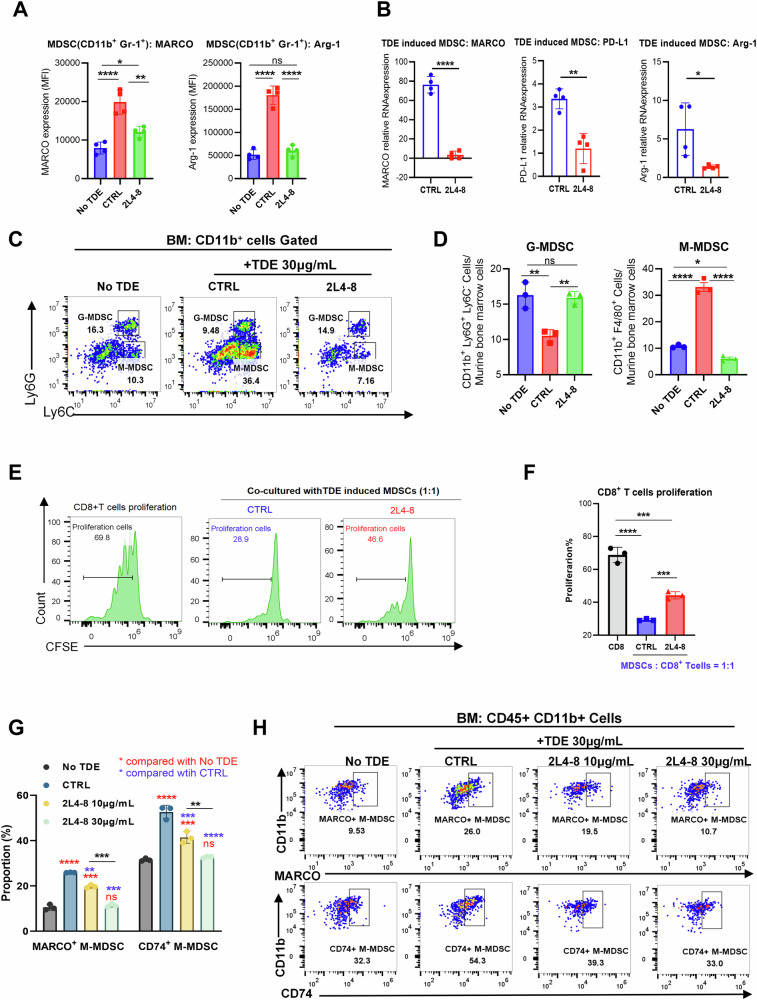
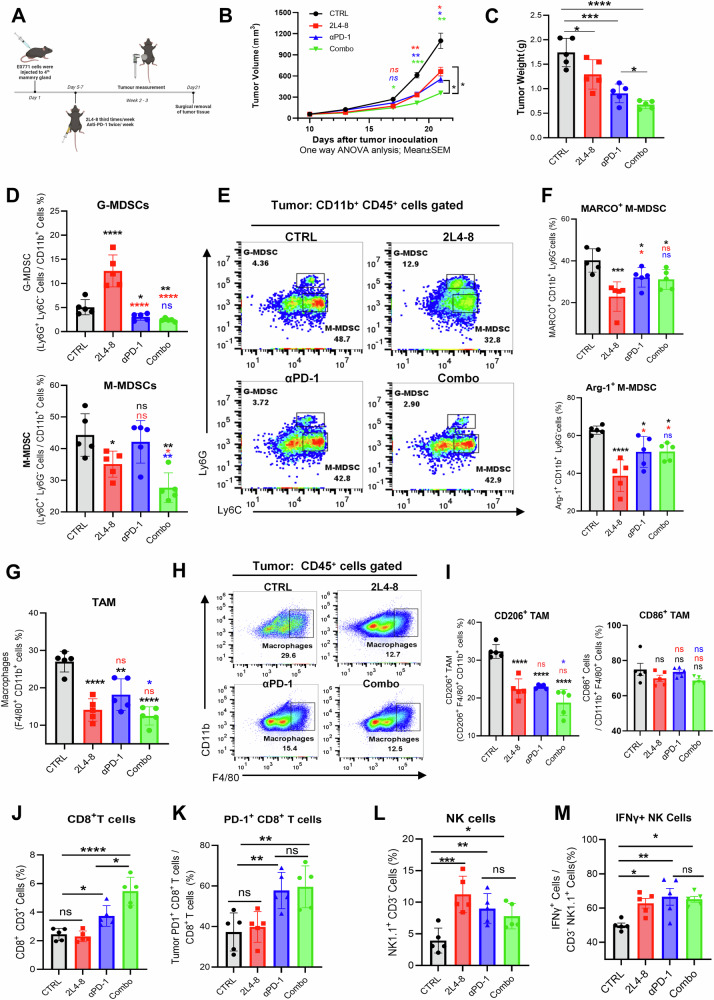
Myeloid-derived suppressor cells (MDSCs) significantly contribute to the immunosuppressive tumor microenvironment (TME), and targeted inhibition of MDSCs is a potential therapeutic strategy against cancer. Here, we identify macrophage receptor with collagenous structure (MARCO) as a critical regulator of MDSC differentiation and immunosuppression in breast cancer. The present study demonstrates that MARCO is expressed on MDSCs, and breast tumor-derived exosomes (TDEs) enriched with macrophage migration inhibitory factor (MIF) promote MDSC differentiation and amplify immunosuppressive activity by up-regulating MARCO. Genetic ablation of MARCO in a murine breast cancer model attenuated tumor growth, accompanied by reduced monocytic MDSCs (M-MDSCs) and total tumor-associated macrophages (TAMs), along with enhanced infiltration of CD8+ T cells and natural killer (NK) cells. Furthermore, we developed a specific MARCO down-regulation-promoting monoclonal antibody that impeded TDE-induced MDSC differentiation and immunosuppression. In vivo, MARCO down-regulating antibody suppressed tumor growth and reprogrammed the TME by diminishing immunosuppressive MDSCs and TAMs and revitalizing CD8+ T cells and NK cells. Strikingly, combining the MARCO down-regulating antibody with PD-1 blockade synergistically enhanced anti-tumor efficacy. This work establishes MARCO as a key regulator of MDSC-mediated immunosuppression and presents a compelling case for the inclusion of MARCO as a therapeutic target in cancer immunotherapy.


Conflict of interest statement

Competing interests: The authors declare no competing interests.

Figures

Fig. 1
Fig. 1. TDE induces MARCO expression and promotes MDSC differentiation.
A Flow cytometric analysis of MARCO, Arg-1, and CD206 expression on cytokine-induced murine bone marrow cells. (M1: M-CSF + LPS + IFN-γ; M2: M-CSF + IL4 + IL10; MDSC: GM-CSF + IL6). BD MDSC proportion, MDSC MARCO expression, and MDSC Arg-1 expression on murine bone marrow cells treated with E0771 tumor-sup or TDEs. E M-MDSC and G-MDSC proportion. Murine BM cells treated with E0771 tumor-sup or TDE. F Representative flow cytometry figure of MDSC subgroups. G Human PBMC cells were treated with different concentrations of MDA-MMB-231 TDE. Then, the MDSC proportion was detected. H Representative flow cytometry figure of MDSC proportion. I MARCO expression on human TDE-induced MDSC. Data are presented as mean ± SD with a CI of 95% from three biological replicates (individual data points overlaid), and the entire study was independently repeated at least three times. p < 0.05 by one-way ANOVA with Tukey’s multiple comparisons test. *p < 0.05, **p < 0.01, ***p < 0.001, ****p < 0.001.
Fig. 2
Fig. 2. MIF in TDE promotes MDSC differentiation and MARCO upregulation.
A MIF RNA expression of MDA-MBA-231 cells transfected with different indicated plasmids. B Representative Western blot images demonstrate the expression of MIF in TDEs isolated from MDA-MB-231 transfected with MIF shRNA (sh-MIF) or negative control shRNA (NC). Three biological replicates per group. C Relative gray value analysis of Western blot images to prove MIF knockdown in exosomes. D The proportions of MDSCs when human PBMCs respond to the sh-MIF or NC TDEs. Each experiment included four biological replicates, and the entire study was independently repeated at least three times. E Representative flow cytometry figure of (D). F The proportions of human PBMC differentiated M-MDSCs and MARCO+ MDSC in response to the sh-MIF or NC TDEs. G Representative flow cytometry figure of (F). H Mouse BM cells induced by E0771 exosomes were treated with IMP-1576 with different concentrations, compared to BM without E0771 TDE. Quantitation data of M-MDSC and MARCO+ MDSC proportion. I Representative flow cytometry figure of (H). Data was shown as mean ± SD. with a CI of 95% and individual data points overlaid. p < 0.05 by one-way ANOVA with Tukey’s multiple comparisons test for pairwise comparisons between groups. **p < 0.01, ***p < 0.001, ****p < 0.001. ns: no significance.
Fig. 3
Fig. 3. MARCO deficiency prevented tumor growth and altered the characteristics of MDSCs.
A Schematic of the E0771 mammary tumor model and period of tumor volume measurement. (n = 4 for both wild-type and MARCO Knockout groups littermate controls). B The growth curve of E0771 breast tumors. Data was shown as mean ± SEM. with a CI of 95%. We analyzed tumor growth differences between the two groups across multiple time points using two-way ANOVA (factors: Group × Time) with Šídák’s multiple comparisons test to show the difference between groups at the same time point. C The tumor weight at the experimental endpoint. D, E Proportions and representative flow cytometry data of G-MDSCs and M-MDSCs in tumor tissue. F, G Proportions and representative flow cytometry data of TAM. H, I Quantification and representative flow cytometry data of tumor-infiltrating CD8+ T cells. J, K Quantification and representative flow cytometry data of tumor-infiltrating NK cells. Data in (CK) was shown as mean ± SD. with a CI of 95%. Comparisons between the two groups were performed using unpaired two-tailed Student’s t-tests. *p < 0.05, **p < 0.01, ***p < 0.001, ****p < 0.001, ns not significant. L MDSCs were isolated from the MARCO deficiency and wild-type group (n = 3 for each group) for RNA sequencing analysis. The heatmap showed the differentially expressed genes between knockout MDSCs and wild-type MDSCs.
Fig. 4
Fig. 4. MARCO downregulation-inducing antibody inhibits the MDSC differentiation.
Mouse bone marrow cells incubated with E0771 TDEs in the presence of control antibody (CTRL) or MARCO antibody (2L4-8) 30 μg/mL. A flow cytometry to detect MARCO and Arg-1 expression on MDSCs. B RT-PCR to detect total MARCO, PD-L1, and Arg-1 expression. The experiment contained four biological replicates and was independently repeated at least three times. C, D Representative flow cytometry data and quantification analysis of the proportion of MDSCs’ sub-populations. E, F TDE-induced MDSCs were co-cultured with CD8+ T cells at a 1:1 ratio with the presence of isotype control and 2L4-8 antibodies for 2 days. Three biological replicates per group. Representative flow cytometry data showed the proliferation of CD8+ T cells. Quantification of CD8+ T cell proliferation. G Quantification data showed the dose-dependent effect of 2L4-8 to inhibit the MARCO and CD74 expression on M-MDSCs. The experiment contained four biological replicates and was independently repeated at least three times. H Representative flow cytometry of (G). Data were shown as mean ± SD. with a CI of 95%. For experiments with three groups, One-way ANOVA was performed to assess overall differences among the three groups, followed by Tukey’s post hoc test for all pairwise comparisons. For experiments with two groups, an unpaired two-tailed Student’s t-test was used. *p < 0.05, **p < 0.01, ***p < 0.001, ****p < 0.0001.
Fig. 5
Fig. 5. MARCO downregulation antibody attenuates TDE-induced MDSC immunosuppression.
A Experimental scheme of RNA-seq. Control vs. antibody-treated group (n = 4 for each group). B Volcano plot displaying differentially expressed genes (DEGs) between treatment and control groups (n = 4 each group). The X-axis shows log2 fold change, where positive values indicate higher expression in the treatment group. The Y-axis represents –log10 adjusted p-value. Red dots denote significant DEGs (|LFC | > 2, padj < 0.0001). C Data from GO enrichment analysis (GO:BP) shows the genes enriched in signaling pathways. D GSEA analysis showed the signaling pathway change in the two groups. The results are shown in a bar graph. E Heatmap of essential downregulating genes in response to 2L4-8 treatment. F All sequenced samples were subjected to RT-PCR to validate the expression of MARCO, Csf1, IL10, Il1a, Il1b, Cxcl14, and Fosl1. RT-PCR Data was shown as mean ± SD. with a CI of 95%. An unpaired two-tailed Student’s t-test was used. **p < 0.01, ***p < 0.001, ****p < 0.0001.
Fig. 6
Fig. 6. The MARCO antibody 2L4-8 enhanced the anti-tumor immune response of PD-1 therapy.
A Schematic of the E0771 mammary tumor model and treatment regimen from day 9 to 21 after inoculation. N = 5 for each group. B E0771 tumor growth in response to different treatments. Data was shown as mean ± SEM with a CI of 95%. The tumor growth differences between the two groups across multiple time points were analyzed by two-way ANOVA (factors: Group × Time) with Šídák’s multiple comparisons test to show the difference between groups at the same time point. C Tumor weight of the E0771 tumor. D Proportions of tumor-infiltrating G-MDSCs and M-MDSCs in each group. E Representative flow cytometry data of MDSC subtypes. F Proportion of MARCO+ M-MDSC and in Arg-1+ M-MDSC each group. G Percentage of tumor-infiltrating TAM in each group. K Representative flow cytometry data of TAMs. H Representative flow cytometry data of TAMs. I Percentage of tumor-infiltrating CD206+TAM and CD86+ TAM in each group. J, K Percentages of tumor-infiltrating CD8+ T cells and PD-1+ CD8+ T cells in each group. L, M Percentages of tumor-infiltrating NK cells and IFN-γ+ NK cells in each group. The weight of the tumor and flow cytometry data was analyzed using one-way ANOVA with Tukey’s multiple comparisons test for pairwise comparisons between groups. *p < 0.05, **p < 0.01, ***p < 0.001, ****p < 0.001. ns: no significance.

Similar articles

References

    1. Fidler IJ. The pathogenesis of cancer metastasis: the ‘seed and soil’ hypothesis revisited. Nat Rev Cancer. 2003;3:453–8. 10.1038/nrc1098. - PubMed
    1. de Visser KE, Joyce JA. The evolving tumor microenvironment: from cancer initiation to metastatic outgrowth. Cancer Cell. 2023;41:374–403. 10.1016/j.ccell.2023.02.016. - PubMed
    1. Quail DF, Joyce JA. Microenvironmental regulation of tumor progression and metastasis. Nat Med. 2013;19:1423–37. 10.1038/nm.3394. - PMC - PubMed
    1. Almand B, Clark JI, Nikitina E, van Beynen J, English NR, Knight SC, et al. Increased production of immature myeloid cells in cancer patients: a mechanism of immunosuppression in cancer. J Immunol. 2001;166:678–89. 10.4049/jimmunol.166.1.678. - PubMed
    1. Gabrilovich DI, Nagaraj S. Myeloid-derived suppressor cells as regulators of the immune system. Nat Rev Immunol. 2009;9:162–74. 10.1038/nri2506. - PMC - PubMed

LinkOut - more resources