. 2025 Jul 22;16(1):6714.
doi: 10.1038/s41467-025-62048-7.

Hamsters with long COVID present distinct transcriptomic profiles associated with neurodegenerative processes in brainstem

Affiliations

Hamsters with long COVID present distinct transcriptomic profiles associated with neurodegenerative processes in brainstem

Anthony Coleon et al. Nat Commun. .

Abstract

Following infection with SARS-CoV-2, patients may experience with one or more symptoms that appear or persist over time. Neurological symptoms associated with long COVID include anxiety, depression, and memory impairment. However, the exact underlying mechanisms are not yet fully understood. Using golden hamsters as a model, we provide further evidence that SARS-CoV-2 is neuroinvasive and can persistently infect the brain, as viral RNA and replicative virus are detected in the brainstem 80 days after the initial infection. Infected hamsters exhibit a neurodegenerative signature in the brainstem, characterized by overexpression of innate immunity genes, and altered expression of genes involved in the dopaminergic and glutamatergic synapses, in energy metabolism, and in proteostasis. These infected animals exhibit persistent depression-like behavior, impaired short-term memory, and late-onset signs of anxiety. Finally, we provide evidence that viral and immunometabolic mechanisms coexist in the brainstem of SARS-CoV-2-infected hamsters, contributing to the manifestation of neuropsychiatric and cognitive symptoms.


Conflict of interest statement

Competing interests: The authors declare no competing interests.

Figures
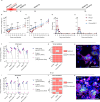
Fig. 1
Fig. 1. Long-term clinical profile and brainstem viral load in hamsters intranasally-inoculated with SARS-CoV-2 Wuhan or the variants Delta and Omicron/BA.1.
A General experimental outline. B, C Body weight variation in male and female hamsters over 80 days post-infection (dpi). Horizontal lines indicate the median and the interquartile range. Kruskal-Wallis test performed at 4, 14, 28, and 80 dpi (the p value is shown if p < 0.05). D, E Clinical score over 80 dpi. The clinical score is based on a cumulative 0-4 scale: ruffled fur, slow movements, apathy, and absence of exploration activity. Horizontal lines indicate the median and the interquartile range. Kruskal-Wallis test performed at 4 dpi (the p value is shown if p < 0.05). BE Between 0 and 28 dpi (mock-infected: n = 20 males + 18 females; Wuhan: n = 12 males + 12 females; Delta: n = 4 males + 4 females; Omicron/BA.1: n = 4 males + 4 females). At 80 dpi (mock-infected: n = 12 males + 12 females; Wuhan: n = 8 males + 8 females; Delta: n = 4 males + 4 females; Omicron/BA.1: n = 4 males + 4 females). FK SARS-CoV-2 detection in the brainstem at 4 dpi (F-H) and 80 dpi (IK) in male and female hamsters. F, I Genomic and sub-genomic viral RNA were assessed based on the RdRp and E gene sequence. Gray lines connect symbols from the same animals. G, J Isolation of infectious virus from the brainstem. Heatmaps showing positive isolation and amplification (red squares) or negative isolation (gray squares) of infectious virus. Each square corresponds to one different hamster. The number of animals in each experiment is marked in the graphs. H Immunofluorescence imaging of SARS-CoV-2 isolation from the brainstem of hamsters at 4 dpi. The micrograph is representative of the positive results shown in (G), where the virus was detected in Wuhan (n = 4 males + 4 females), Delta (n = 4 males + 3 females) and Omicron/BA.1 (n = 4 males + 4 females). K Immunofluorescence imaging of SARS-CoV-2 isolation from the brainstem of hamsters at 80 dpi. The micrograph is representative of the positive results shown in (J), where the virus was detected in Wuhan (n = 3 males + 3 females), Delta (n = 4 males + 3 females) and Omicron/BA.1 (n = 3 males + 3 females). H, K Labeling for the SARS-CoV-2 spike (S, green) and nucleoprotein (NP, magenta). The nuclei of Vero-E6 cells are stained with Hoechst (blue). Scale bar: 75 µm. Related to Supplementary Fig. 1-4.
Fig. 2
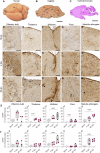
Fig. 2. Histopathological analysis in the brain of hamsters intranasally-inoculated with SARS-CoV-2 Wuhan.
A Dorsal view of a formalin-fixed hamster brain. Ob: olfactory bulbs, Cx: cortex, Cb: cerebellum. B Midsagittal section of a formalin-fixed hamster brain. Hp: hippocampus, cc: corpus calosum, fx: fornix, St: striatum, Th: thalamus, Mb: midbrain, Ps: pons, Mo: medulla oblongata. The brainstem (contoured by a black line) can be separated from the brain after removal of the cerebellum and detachment from the telencephalon at the level of the corpus callosum and the fornix. C Submacroscopic view of a sagittal section (HE staining), with indications of the regions from where the images DR were obtained. Astrocytes (GFAP + ) detection in the brain of a mock-infected hamster: olfactory bulb (D), thalamus (subependymal zone, E), midbrain at the level of the cruciform sulcus between the superior and inferior colliculus (F), pons (G) and medulla oblongata (subependymal zone; H). In the olfactory bulbs, astrogliosis is evident only at 4 dpi (I, arrow). In the brainstem, however, GFAP-immunoreactive astrocytes are increased in both acute COVID-19 (4dpi, JM) and long Covid (80 dpi, OR), where the glia limitans superficialis (subpial astrocyte foot processes; open arrowhead), the glia limitans perivascularis (perivascular astrocyte foot processes; filled arrowhead) and parenchymal astrocytes (arrow) are more evident. D–R: Representative images of immuno-histochemistry to detect astrocytes using GFAP as marker in mock-infected (n = 4 males + 4 females), hamsters infected at 4 dpi (n = 4 males + 4 females), and at 80 dpi (n = 4 males + 4 females). Scale bars: A-C = 5 mm, D-R = 100 µm. S, T Quantification of the percentage of the GFAP stained area in the olfactory bulb, thalamus, midbrain, pons, and medulla oblongata of male (S) and female (T) hamsters. Mock-infected (n = 4 males + 4 females), hamsters infected at 4 dpi (n = 4 males + 4 females), and at 80 dpi (n = 4 males + 4 females). Box and whisker plots (median, first and third quartiles, minimum and maximum). Individual values are also shown. Kruskal-Wallis test followed by the Dunn’s multiple comparisons test (the adjusted p value is indicated if p < 0.05). Related to Supplementary Fig. 5.
Fig. 3
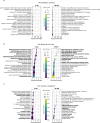
Fig. 3. Intranasal SARS-CoV-2 infection alters the brainstem transcriptomic profile in hamsters.
GO enrichment analysis considering biological process (A), molecular function (B) and cellular compartment (C). Selected GO terms are based on the up- and down-regulated genes between SARS-CoV-2 Wuhan-infected and mock-infected samples at 4 dpi (left panels) and 80 dpi (right panels). Circle sizes are proportional to the gene set size, which shows the total size of the gene set associated with the GO terms. Circle color is proportional to the corrected p values (one-sided tests, not considering potential depletions, and corrected for multiple testing using Benjamini-Hochberg correction). Common pathways observed at 4 and 80 dpi are shown in bold. Related to Supplementary Figs. 6–8.
Fig. 4
Fig. 4. Intranasal SARS-CoV-2 infection alters the brainstem transcriptomic profile in hamsters.
A KEGG pathways enrichment based on the differentially regulated genes between SARS-CoV-2 Wuhan-infected and mock-infected samples at the acute phase (4 days post-infection, dpi; left panel) and at the late phase (80 dpi, right panel). Circle sizes are proportional to the gene set size. Circle color is proportional to the corrected p values (one-sided tests, not considering potential depletions, and corrected for multiple testing using Benjamini-Hochberg correction). Common pathways observed at 4 and 80 dpi are shown in bold. Heatmap showing the differentially expressed genes at 4 and 80 dpi according to the selected KEGG pathway “Dopaminergic synapse” (B), “Glutamatergic synapse” (C), and “Synaptic vesicle cycle” (D), calculated in comparison with mock-infected hamstersColor gradient represents the transcription log2 fold change comparing infected and mock-infected (two-sided test, adjusted p-values after Benjamini-Hochberg multiple testing correction, considering a false discovery rate FDR < 0.05: *, **, *** denote p < 0.05, p < 0.01 and p < 0.001, respectively). Gene names in bold are mentioned in the text. Related to Supplementary Fig. 6-8.
Fig. 5
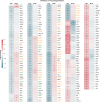
Fig. 5. Intranasal SARS-CoV-2 infection affects the expression of genes related to neurodegenerative processes in the brainstem.
Heatmap showing the differentially expressed genes at 4- and 80-days post-infection (dpi) according to the selected KEGG pathway “Pathways of neurodegeneration” calculated comparing SARS-CoV-2 Wuhan-infected to mock-infected hamsters (two-sided test, adjusted p-values after Benjamini-Hochberg multiple testing correction, considering a false discovery rate FDR < 0.05: *, **, *** denote p < 0.05, p < 0.01 and p < 0.001 respectively). Common genes appearing in the ‘Oxidative phosphorylation pathway’ are shown in orange, whereas common genes appearing in the ‘Proteasome pathway’ are shown in green. The color gradient represents the transcription log2 fold change comparing infected and mock-infected. Gene names in bold are mentioned in the text. Related to Supplementary Fig. 6-8.
Fig. 6
Fig. 6. Long-term impact of SARS-CoV-2 infection on neuropsychiatric and cognitive behavior in hamsters.
A General experimental outline with the three sessions of behavior testing. Novelty-suppressed feeding test: Average predicted latency to eat analyzed by mixed model regression in male (B) and female (E) hamsters. Increased latency to eat indicates hyponeophagia and corresponds to an anxious behavior. Sucrose splash test: Average predicted time grooming analyzed by mixed model regression in male (C) and female (F) hamsters. Time grooming corresponds to an index of motivational and self-care behavior and decreased grooming time is considered as a depression-like behavior. Novel object recognition test: Average predicted discrimination index analyzed by mixed model regression in male (D) and female (G) hamsters. Decreased discrimination index corresponds to less time spent exploring the new object and is indicative of short-term memory impairment. Data were analyzed using a mixed-model regression based on time post-infection (Day), Sex, and viral variant (Infection), with a random effect accounting for within-individual variability. For the novelty-suppressed feeding test and the sucrose splash test, the model used was Day * Sex * Infection. For the novel object recognition test, the model used was Day + Sex + Infection. For each outcome, model selection was performed to preserve the most parsimonius parameterization. Complete analyses are available in the Git repository [https://gitlab.pasteur.fr/hub/19421-long-covid-brainstem]. Horizontal lines indicate the estimated means and the 95% confidence interval. The gray crosshatched zone indicates the estimated means and the 95% confidence interval of the mock-infected group. Behavioral session 1 (mock-infected: n = 20 males + 18 females; Wuhan: n = 12 males + 12 females; Delta: n = 4 males + 4 females; Omicron/BA.1: n = 4 males + 4 females). Behavioral session 2 (mock-infected: n = 20 males + 18 females; Wuhan: n = 12 males + 12 females; Delta: n = 4 males + 4 females; Omicron/BA.1: n = 4 males + 4 females). Behavioral session 3 (mock-infected: n = 12 males + 12 females; Wuhan: n = 8 males + 8 females; Delta: n = 4 males + 4 females; Omicron/BA.1: n = 4 males + 4 females). Related to Supplementary Figs. 9–12.

References

    1. COVID-19 cases | WHO COVID-19 dashboard. datadothttps://data.who.int/dashboards/covid19/cases.
    1. Ballering, A. V., van Zon, S. K. R., Hartman, T. C. O. & Rosmalen, J. G. M. Persistence of somatic symptoms after COVID-19 in the Netherlands: an observational cohort study. Lancet400, 452–461 (2022). - PMC - PubMed
    1. Hastie, C. E. et al. True prevalence of long-COVID in a nationwide, population cohort study. Nat. Commun.14, 7892 (2023). - PMC - PubMed
    1. Salmon, D. et al. Patients with Long COVID continue to experience significant symptoms at 12 months and factors associated with improvement: A prospective cohort study in France (PERSICOR). Int. J. Infect. Dis.140, 9–16 (2024). - PubMed
    1. Blomberg, B. et al. Long COVID in a prospective cohort of home-isolated patients. Nat. Med27, 1607–1613 (2021). - PMC - PubMed

MeSH terms