. 2025 Jul 22;15(1):26665.
doi: 10.1038/s41598-025-09665-w.

Exploring thoracic aorta ECM alterations in Marfan syndrome: insights into aorta wall structure

Affiliations

Exploring thoracic aorta ECM alterations in Marfan syndrome: insights into aorta wall structure

Rodrigo Barbosa de Souza et al. Sci Rep. .

Abstract

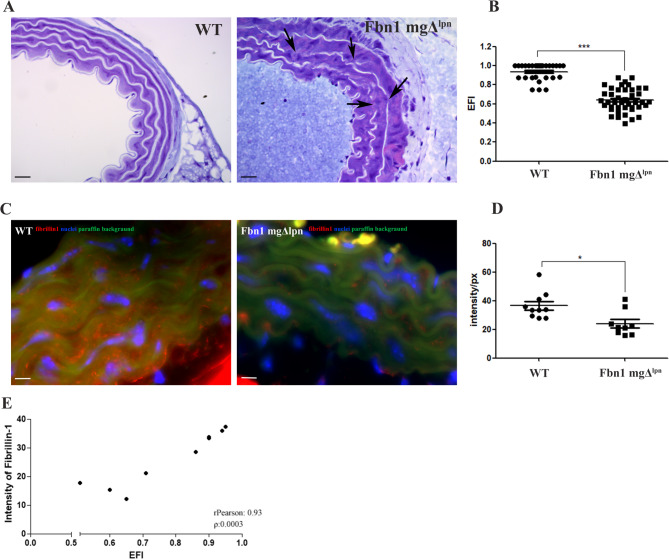
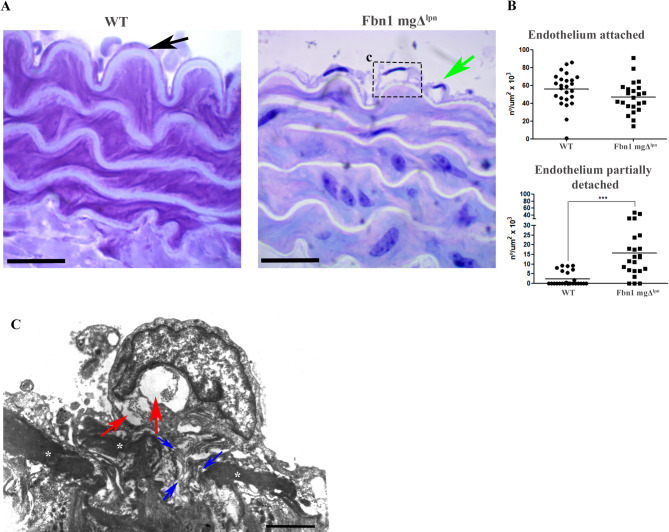
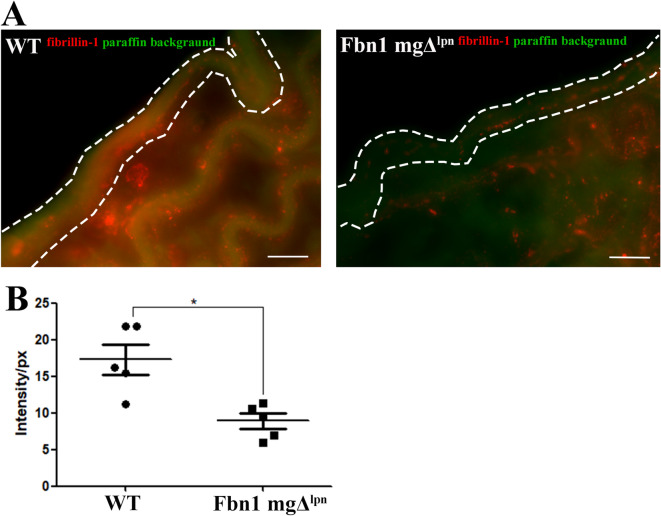
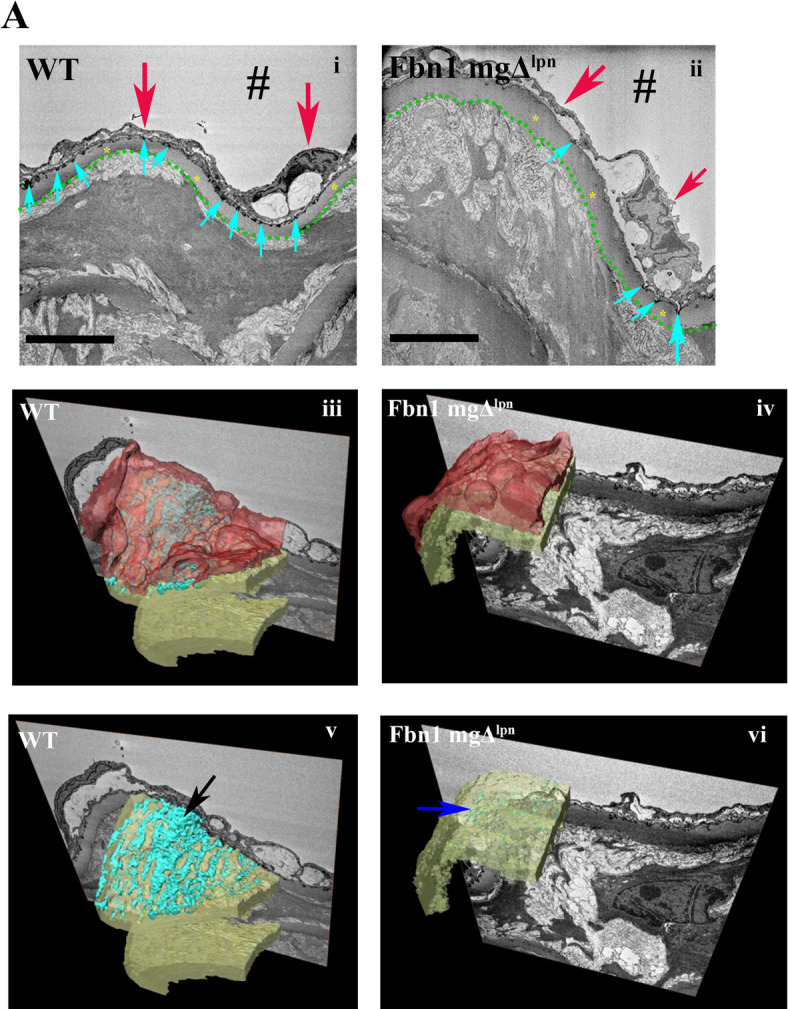
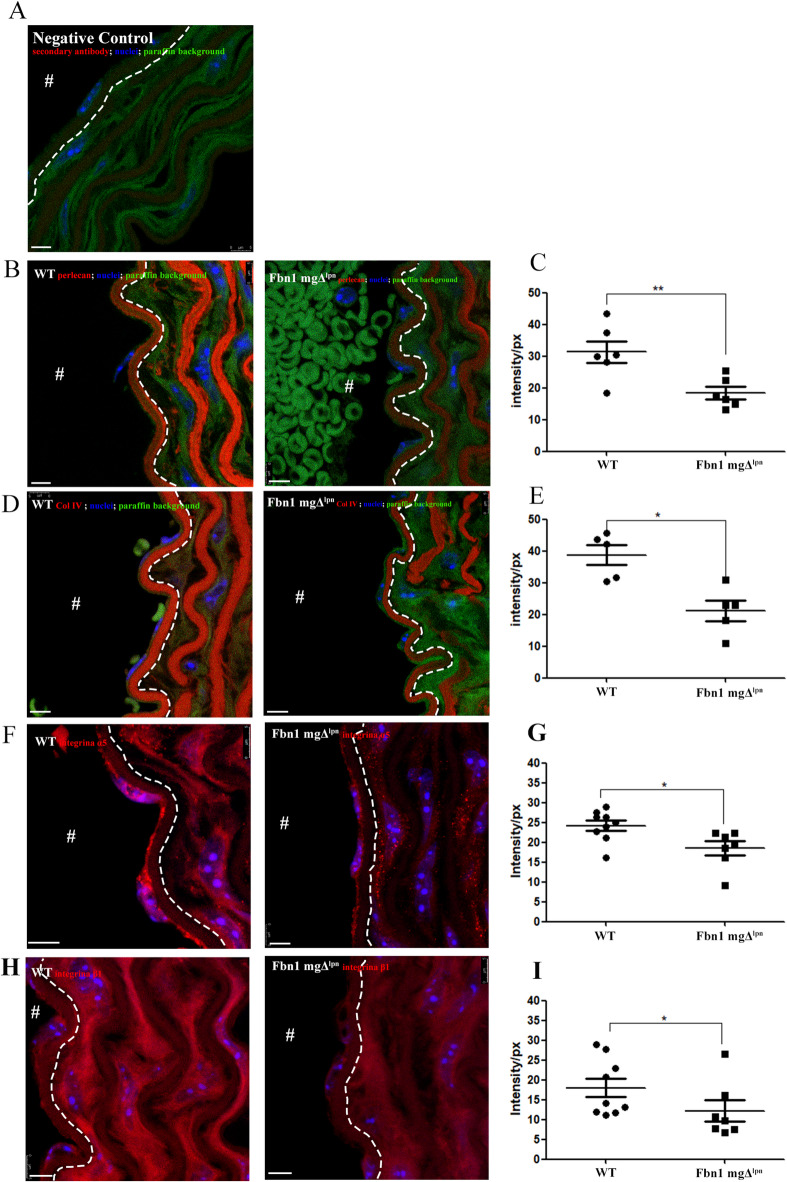
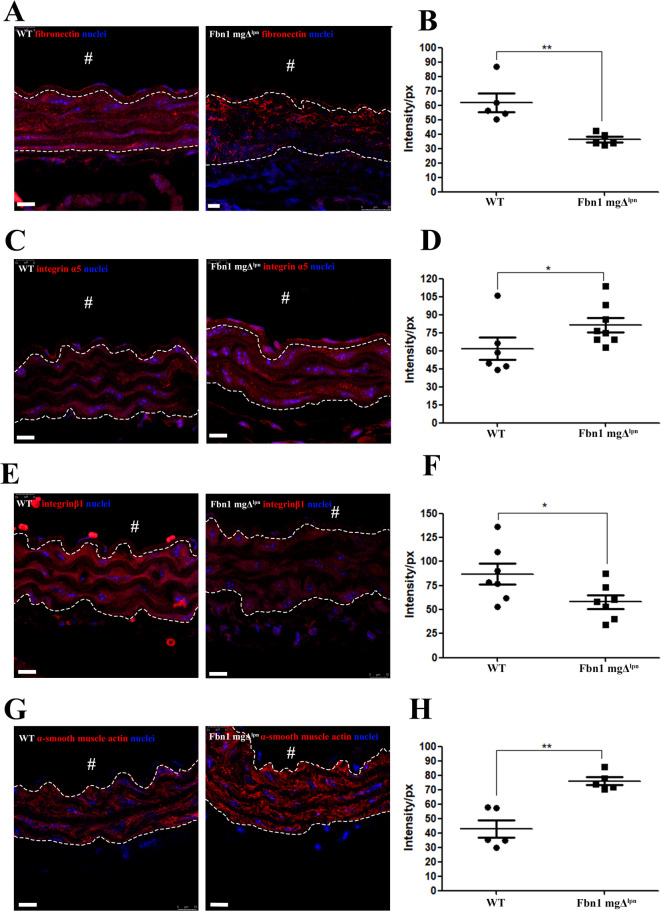
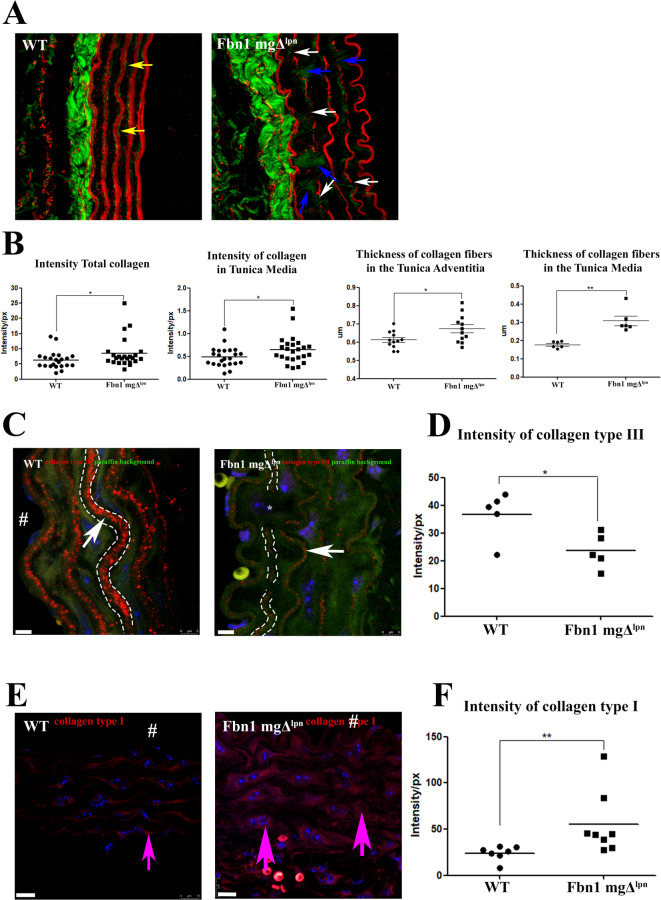
Marfan syndrome is a connective tissue disorder caused by FBN1 mutations, leading to aortic wall fragility and increased susceptibility to aneurysm and dissection. This study investigated microstructural and molecular alterations in the thoracic aorta of Fbn1mgΔlpn mice, with a focus on the tunica intima and media. Histological and ultrastructural analyses demonstrated elastic fiber fragmentation and reduced fibrillin-1 expression. In the intima, endothelial cells showed partial detachment and decreased levels of fibrillin-1, perlecan, collagen IV, and α5β1 integrins, suggesting compromised adhesion to the extracellular matrix. Serial block-face scanning electron microscopy revealed discontinuities in the internal elastic lamina. In the media, we observed reduced fibronectin, altered α5β1 integrin distribution, and increased α-smooth muscle actin, indicative of remodeling in elastin-contractile units. Second harmonic generation imaging revealed increased collagen deposition, and thickness in areas of elastic fiber disruption, along with reduced and disorganized type III collagen and increased type I collagen. Echocardiographic evaluation showed aortic root, and ascendant-aorta dilatation, altered blood flow, and diastolic dysfunction. Elastic fiber integrity correlated strongly with fibrillin-1 expression (r = 0.93, p = 0.0003) and aortic blood flow (r = 0.77, p = 0.0064). These results suggest that early alterations in matrix organization and endothelial-matrix interactions may contribute to aortic wall weakening in Fbn1mgΔlpn mice.

Keywords: Aneurysm; Aorta; Collagen; Extracellular matrix; Fibrillin-1; Marfan syndrome.


Conflict of interest statement

Declarations. Competing interests: The authors declare no competing interests. Ethics approval: All experiments were carried out in accordance with the relevant guidelines.

Figures

Fig. 1
Fig. 1
Histology and immunohistochemistry of the aorta (A). Representative images of aortic transverse sections stained with Toluidine Blue from both the WT group and the Fbn1 mgΔlpn mice group showed concentric elastic lamellae in white. In the Fbn1 mgΔlpn mice group tunica media fragmentation of the elastic fibers was observed (black arrows). Elastic Fiber Index (EFI) (B) showed a significant decrease of the elastic fiber integrity in the Fbn1 mgΔlpn mice group (0.63 ± 0.12) when compared to the WT group (0.93 ± 0.08). Fibrillin-1 immunofluorescence (C), showed the fibrillin-1 (red), the nuclei (blue), and the paraffin background (green). This indicated a reduction of fibrillin-1 distribution around of the elastic fibers in the Fbn1 mgΔlpn mice group, as well as a significant reduction of the fibrillin-1 intensity (WT 36.59intensity/px± 9.34intensity/px; MFS 24.06intensity/px± 8.79intensity/px) (D). E. Strong positive correlation between fibrillin-1 signal intensity and elastic fiber integrity (r = 0.93, p = 0.0003). (***) ρ < 0.001, and (*) ρ < 0.05; bar in A 10 μm, and in C 5 μm (Histological analysis WT n = 10; mgΔlpn n = 10, Fibrillin-1 immunofluorescence analysis: WT n = 10; Fbn1 mgΔlpn mice n = 9).
Fig. 2
Fig. 2
Histological analysis of the tunica intima (A, B). In the WT group (A), endothelial cells were observed resting on the tunica intima with a flat nucleus, characteristic of squamous epithelium (black arrow). In contrast, the Fbn1 mgΔlpn mice group (B) exhibited partially detached endothelial cells (green arrow). No significant difference was observed in the Endothelium Attached Index between groups (WT: 55.60 ± 19.01; Fbn1 mgΔlpn mice: 47.00 ± 17.77). However, the Endothelium Detached Index was significantly higher in the Fbn1 mgΔlpn mice group (WT: 2.25 ± 3.59; Fbn1 mgΔlpn mice: 15.69 ± 13.22). Transmission electron microscopy (TEM) analysis C. TEM images highlighted the presence of partially detached endothelial cells (red arrows) in the Fbn1 mgΔlpn mice group (C). Additionally, fragmentation of elastic fibers (*) was observed, along with extracellular matrix fibers located in regions of elastic fiber fragmentation (blue arrows) and endothelial cells exhibiting a more rounded morphology than normal. The white asterisk (*) indicates elastic fibers; (***) ρ < 0.001. Scale bars: 5 μm for A and B; 1900 nm for C. (Histological analysis: WT n = 10; Fbn1 mgΔlpn mice n = 10, TEM analysis Fbn1 mgΔlpn mice n = 3)
Fig. 3
Fig. 3
Fibrillin-1 immunofluorescence analysis in the Fbn1 mgΔlpn mice group revealed a reduction in fibrillin-1 distribution around the elastic fibers in tunica intima (white dotted line) (A). The intensity of fibrillin-1 staining in the tunica intima was significantly lower in the Fbn1 mgΔlpn mice group (8.90intensity/px± 2.3intensity/px) compared to the WT group (17.29intensity/px± 4.5intensity/px). (*) ρ < 0.05. Scale bar: 5 μm (A). (Fibrillin-1 immunofluorescence analysis: WT n = 5; Fbn1 mgΔlpn mice n = 5)
Fig. 4
Fig. 4
3D reconstruction of the internal elastic lamina (IEL). A Representative 2D images prior to reconstruction from the WT group (i) and the Fbn1 mgΔlpn mice group (ii). The dotted green line delineates the boundary between the tunica intima and the tunica media. Yellow asterisks indicate elastic lamellae, light blue arrows highlight the IEL, characterized by electron-dense fibers, and red arrows mark endothelial cells. In the 3D reconstructions (WT iii and v; Fbn1 mgΔlpn mice iv and vi), endothelial cells are shown in red, the IEL in light blue, and the remaining elastic lamellae in yellow. In the WT group (v), the IEL forms a well-organized tubular network (black arrow), whereas in the Fbn1 mgΔlpn mice group, a reduction of the IEL network is observed (blue arrow). The “#” indicate the aorta lumen, scale bar: 5 μm. Sample size: WT n = 2; Fbn1 mgΔlpn mice n = 2.
Fig. 5
Fig. 5
Basement membrane and tunica intima. Negative control (A) showed the secondary antibody (red), nuclei (blue), and green (green). Perlecan immunofluorescence (B) showed the perlecan (red), and alongside the nuclei (blue). The Fbn1 mgΔlpn mice group displayed a significant reduction of the perlecan intensity (WT 31.32intensity/px± 8.45intensity/px; Fbn1 mgΔlpn mice 18.38intensity/px± 4.68intensity/px) (C). Collagen type IV immunofluorescence (D), revealed the collagen type IV (red), and alongside the nuclei (blue). The Fbn1 mgΔlpn mice group showed a significant reduction of the collagen type IV intensity (WT 38.72intensity/px± 7.08intensity/px; Fbn1 mgΔlpn mice 21.19intensity/px± 7.30intensity/px) (E). Integrin α5 immunofluorescence (F), showed the integrin α5 (red), and alongside the nuclei (blue), The Fbn1 mgΔlpn mice group showed a significant reduction of the integrin α5 intensity (WT 24.21intensity/px± 3.87intensity/px; Fbn1 mgΔlpn mice 18.50intensity/px± 4.65intensity/px) (G). Integrin β1 immunofluorescence (H), showed the integrin β1 (red), and alongside the nuclei (blue)The Fbn1 mgΔlpn mice group showed a significant decrease of the integrin β1 (WT 18.02intensity/px± 7.14intensity/px; Fbn1 mgΔlpn mice 12.20intensity/px± 7.03intensity/px) (I). dotted white line separed the tunica intima and tunica media; The “#” white indicate the aorta lumen; (**) ρ < 0.001, and (*) ρ < 0.05; bar in A, B, D, F, and H 5 μm (immunofluorescence analysis: Perlecan WT n = 6; Fbn1 mgΔlpn mice n = 6, Collagen type IV WT n = 5; Fbn1 mgΔlpn mice n = 5, Integrin α5 and β1WT n = 9; Fbn1 mgΔlpn mice n = 7).
Fig. 6
Fig. 6
Thoracic aorta tunica media. Fibronectin immunofluorescence (A), showed the fibronectin (red), and the nuclei (blue). The Fbn1 mgΔlpn mice group showed a significant reduction of the fibronectin intensity (61.91intensity/px± 14.47intensity/px; Fbn1 mgΔlpn mice 36.00intensity/px± 4.27intensity/px) (B). Integrin α5 immunofluorescence (C), showed the Integrin α5 (red), and the nuclei (blue). The Fbn1 mgΔlpn mice group showed a significant increase in the integrin α5 intensity (WT 61.89intensity/px± 23.06intensity/px; Fbn1 mgΔlpn mice 81.39intensity/px± 17.06intensity/px) (D). Integrin β1 immunofluorescence (E), showed the integrin β1 (red), and the nuclei (blue). The Fbn1 mgΔlpn mice group showed a significant reduction of the integrin β1 intensity (WT 86.82intensity/px± 28.73intensity/px; Fbn1 mgΔlpn mice 57.99intensity/px± 18.18intensity/px) (F). α-smooth muscle actin immunofluorescence (G), showed the α-smooth muscle actin (red), and the nuclei (blue). The Fbn1 mgΔlpn mice group showed a significant increase in the α-smooth muscle actin intensity (WT 42.97intensity/px± 13.46intensity/px; Fbn1 mgΔlpn mice 75.97intensity/px± 6.26intensity/px) (H).The “#” white indicate the aorta lumen; (**) ρ < 0.005, and (*) ρ < 0.05; bar in A, C, E, and G 5 μm, space between dotted white lines is the tunica media. (immunofluorescence analysis: Fibronectin WT n = 5; Fbn1 mgΔlpn mice n = 5, Integrin α5 WT n = 6; Fbn1 mgΔlpn mice n = 8; Integrin β1WT n = 7; Fbn1 mgΔlpn mice n = 7, α-smooth muscle actin WT n = 5; Fbn1 mgΔlpn mice n = 5).
Fig. 7
Fig. 7
Collagen distribution in the aorta. A Collagen distribution by SHG (green) and tropoelastin (red); The WT group showed a uniform tropoelastin marker, and around tropoelastin the discrete presence of the collagen fibers (yellow arrows). Fbn1 mgΔlpn mice showed a discontinuous intensity of the tropoelastin marker (white arrows), and within the apparent fragmentation of elastic fibers, collagen deposition was observed (blue arrows). B The intensity of total collagen fibers (WT 6.3intensity/px± 2.9intensity/px; Fbn1 mgΔlpn mice 8.5intensity/px± 4.89intensity/px), and of collagen in the tunica media (WT 0.49intensity/px± 0.21intensity/px; Fbn1 mgΔlpn mice 0.64intensity/px± 0.30intensity/px) were both significantly increased in the Fbn1 mgΔlpn mice group. The thickness of collagen fibers in the tunica adventitia was observed the significantly increase in Fbn1 mgΔlpn mice group when compared to WT group (WT: 0.61 μm ± 0.04 μm; Fbn1 mgΔlpn: 0.67 μm ± 0.07 μm). Besides, in the tunica media, a significant increase in collagen fiber thickness was also observed in Fbn1 mgΔlpn mice compared to WT (WT: 0.17 μm ± 0.01 μm; Fbn1 mgΔlpn: 0.30 μm ± 0.064 μm). Collagen type III immunofluorescence (C), showed in red the collagen type III (white arrow), and in blue the nuclei. D The Fbn1 mgΔlpn mice group showed a significant reduction of the collagen type III intensity (WT 36.78intensity/px± 8.5intensity/px; Fbn1 mgΔlpn mice 23.57.57intensity/px± 6.2intensity/px). The distribution of collagen type III closely follows the contours of the elastic lamellae (dotted white line). In Fbn1 mgΔlpn mice, reduced collagen type III intensity and its absence in regions of elastic fiber fragmentation (*) were observed. Collagen type I immunofluorescence (E), showed the collagen type I (red – pink arrow), and the nuclei (blue). F The Fbn1 mgΔlpn mice group showed a significant increase of the collagen type I intensity (WT 24.01intensity/px± 7.79intensity/px; Fbn1 mgΔlpn mice 55.47intensity/px± 34.4intensity/px) (F). (*) ρ < 0.05 (***), ρ < 0.001; bar in C and E are 5 μm. The “ # ” indicates the aorta lumen (C and E), “ * ” indicates elastic fiber fragmentation; dotted white lines indicate elastic fibers. (SHG: WT n = 6; Fbn1 mgΔlpn mice n = 6, Collagen type III WT n = 5; Fbn1 mgΔlpn mice n = 5, Collagen type I WT n = 7; Fbn1 mgΔlpn mice n = 8).

Similar articles

References

    1. Souza, R. B. et al. Critical analysis of aortic dysmorphism in Marfan syndrome. J. Morphological Sci.34 (1), 1–6. 10.4322/jms.102516 (2017).
    1. Milewicz, D. M. et al. Marfan syndrome. Nat. Rev. Dis. Prim.7(1), 64. https://doi.org/10.1038/s41572-021-00298-7 (2021). - PMC - PubMed
    1. Kielty, C. M., Sherratt, M. J., Marson, A. & Baldock, C. Fibrillin microfibrils. Adv. Protein Chem.70, 405–436. 10.1016/S0065-3233(05)70012-7 (2005). - PubMed
    1. Zeyer, K. A. & Reinhardt, D. P. Engineered mutations in fibrillin-1 leading to Marfan syndrome act at the protein, cellular and organismal levels. Mutat. Res. Rev. Mutat. Res.765, 7–18. 10.1016/j.mrrev.2015.04.002 (2015). - PubMed
    1. Schmelzer, C. E. H. & Duca, L. Elastic fibers: formation, function, and fate during aging and disease. FEBS J.289 (13), 3704–3730. 10.1111/febs.15899 (2022). - PubMed

MeSH terms

LinkOut - more resources