

Construction and application of copula-based trivariate standardized river disconnection index for seasonal rivers in arid and semi-arid areas
- PMID: 40695910
- PMCID: PMC12284199
- DOI: 10.1038/s41598-025-11513-w
Construction and application of copula-based trivariate standardized river disconnection index for seasonal rivers in arid and semi-arid areas
Abstract
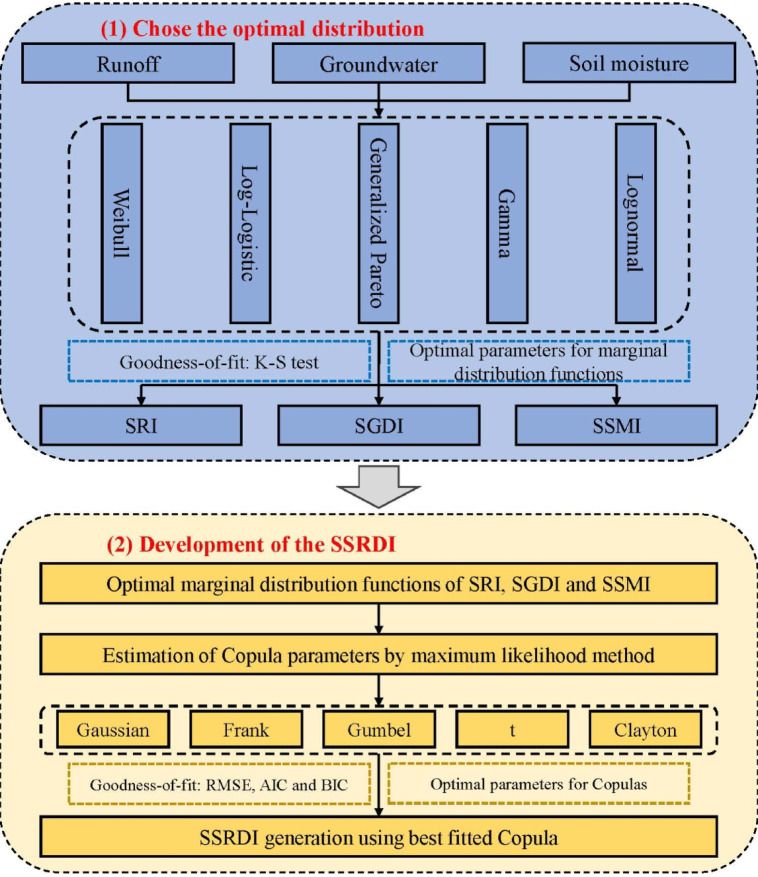
Traditional concepts of river health and methods for identifying ecological river disconnection are not applicable to seasonal rivers. Given the substantial negative impact of ecological river disconnection on river ecosystems and the importance of groundwater and soil moisture for the ecology of seasonal rivers in arid and semi-arid regions, developing a comprehensive index for accurately identifying ecological river disconnection in these rivers is crucial. This study introduces a new Standardized Seasonal River Disconnection Index (SSRDI), which is based on a Standardized Index (SCI) and a three-variable Copula function. The SSRDI integrates surface water, groundwater, and soil water information to reveal the true hydrological conditions of seasonal rivers and provides a comprehensive analysis of ecological river disconnection patterns in Tabu River from 2002 to 2020. The findings are as follows: (1) The Gaussian Copula is most suitable for constructing the SSRDI for Tabu River. Optimal distribution functions vary across regions, times, and datasets; therefore, using the best monthly distribution functions to compute SRI, SGDI, and SSMI provides a more scientifically robust mathematical and statistical basis. (2) The SSRDI, which combines surface water, groundwater, and soil water, is more consistent with the actual hydrological conditions of Tabu River compared to the three univariate indices. (3) From 2002 to 2020, the SSRDI for Tabu River shows a continuous declining trend, albeit at a slowing rate. The overall pattern exhibits a cyclical trend of worsening followed by improvement, with June being the month of most severe ecological river disconnection. (4) The seasonal component of the SSRDI from 2002 to 2020 displays cyclical changes, with a mutation in June 2004. The trend component shows a general decline, with two mutations observed in April 2005 and February 2007. This study provides valuable insights for identifying ecological river disconnection of seasonal rivers. The index can be applied to monitoring, forecasting, and mitigating ecological river disconnection in arid and semi-arid river systems, and can more accurately and comprehensively grasp the true health status of seasonal rivers, which is of great significance for the sustainable development of seasonal river ecological environment.
Keywords: Comprehensive river Disconnection index; Copula; Seasonal river; Tabu river.
© 2025. The Author(s).
Conflict of interest statement
Declarations. Competing interests: The authors declare no competing interests.
Figures


References
-
- Palmer, M. & Ruhi, A. Linkages between flow regime, biota, and ecosystem processes: implications for river restoration. Science365, eaaw2087 (2019). - PubMed
-
- Chen, W., Lu, S., Pan, N. & Jiao, W. Impacts of long-term reclaimed water irrigation on soil salinity accumulation in urban green land in Beijing. Water Resour. Res.49, 7401–7410 (2013).
-
- Best, J. Anthropogenic stresses on the world’s big rivers. Nat. Geosci.12, 7–21 (2019).
-
- Feng, K. et al. Three-dimensional perspective on the characterization of the Spatiotemporal propagation from meteorological to agricultural drought. Agric. Meteorol.353, 110048 (2024).
Grants and funding
LinkOut - more resources
Full Text Sources
Miscellaneous
