

Perillyl alcohol promotes autophagy by suppressing the PI3K-AKT-mTOR signalling pathway in osteoarthritic chondrocytes in vitro
- PMID: 40695916
- PMCID: PMC12283928
- DOI: 10.1038/s41598-025-12274-2
Perillyl alcohol promotes autophagy by suppressing the PI3K-AKT-mTOR signalling pathway in osteoarthritic chondrocytes in vitro
Abstract
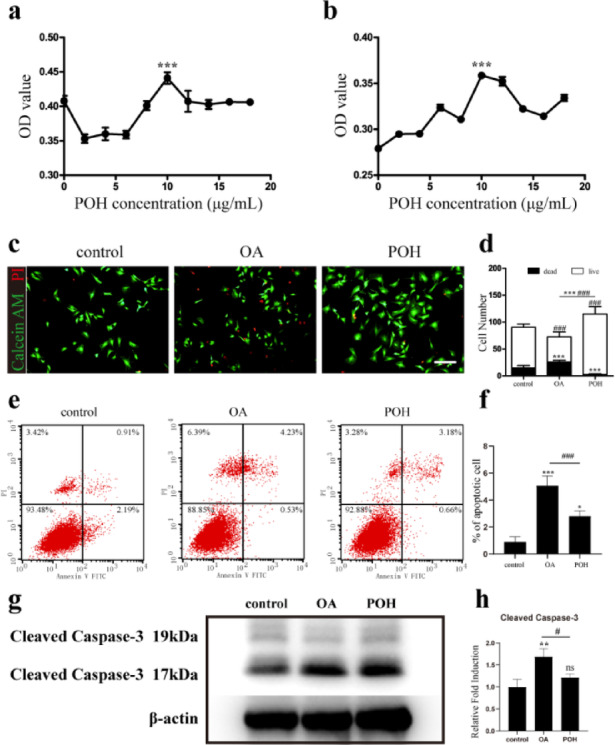
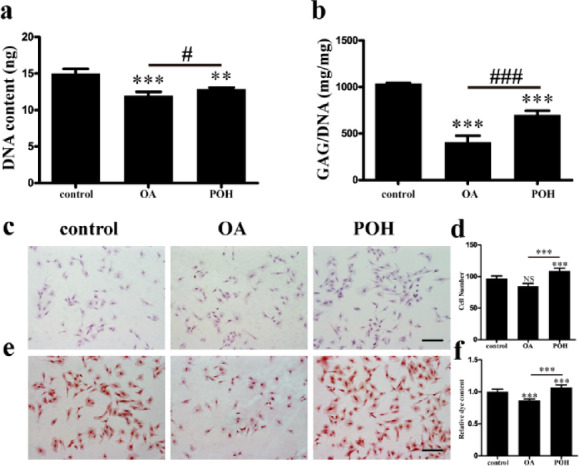
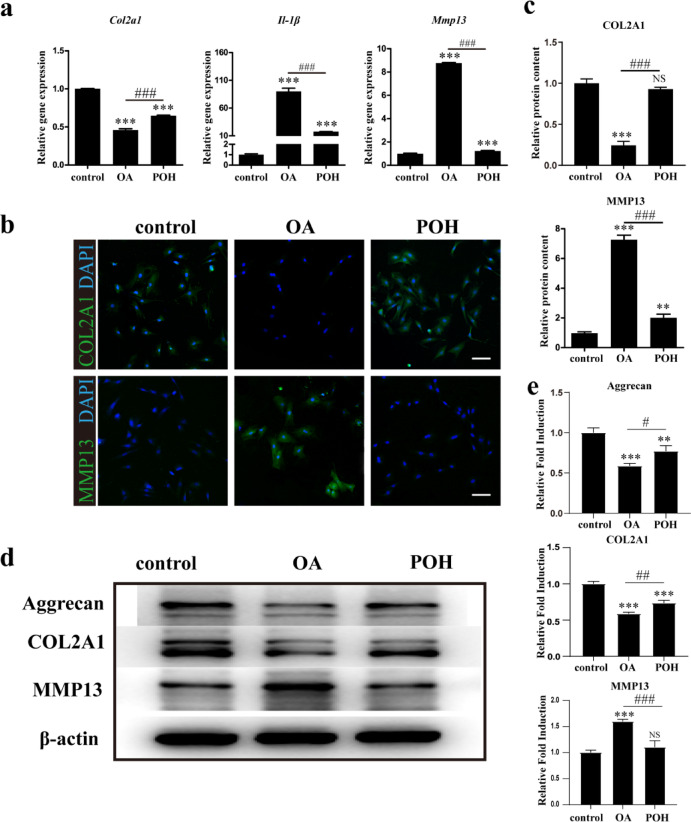
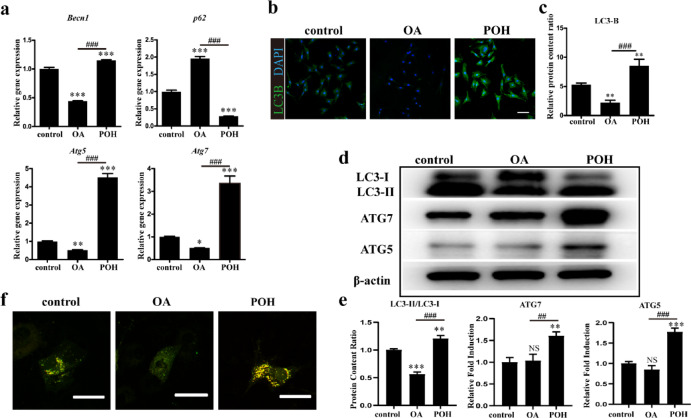
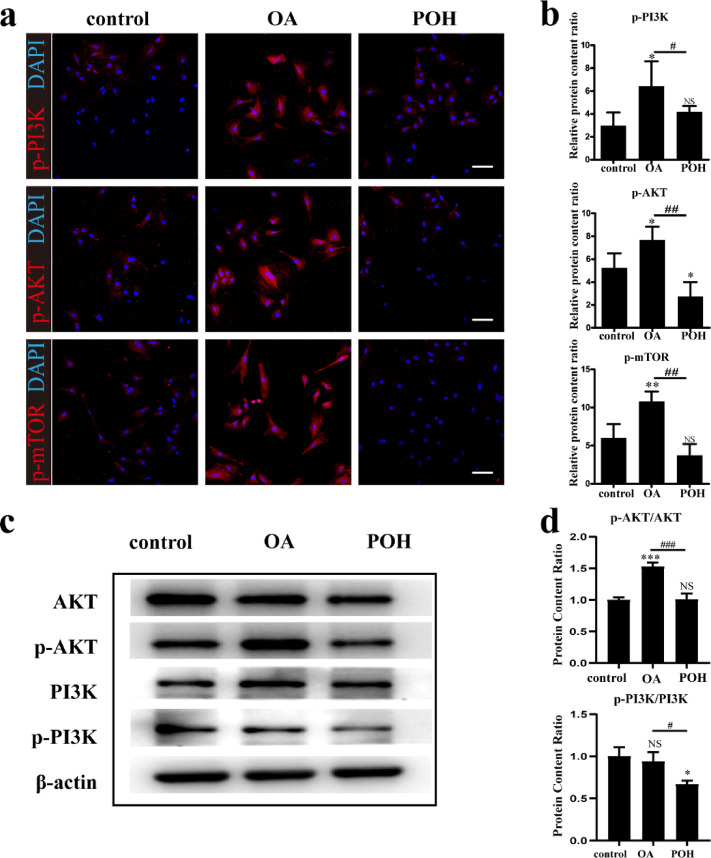
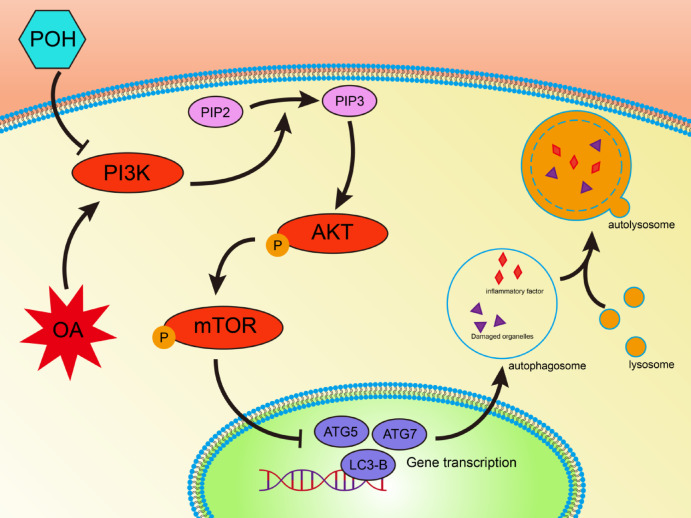
Osteoarthritis (OA) is a common degenerative disease characterized by chondrocyte death and extracellular matrix (ECM) degradation, but the present OA treatments are only symptomatic and not aetiologic. Autophagy is a key protective mechanism for OA through the inhibition of chondrocyte apoptosis and degeneration. Perillyl alcohol (POH) is a monomer derived from Chinese herbal medicines that can regulate autophagy and has anti-inflammatory effects. In this study, cell viability, chondrocyte phenotype and the expression of molecules involved in autophagy and the PI3K-AKT-mTOR signalling pathway were detected to explore the hypothesis that POH may decrease the progression of OA by regulating autophagy. We found that POH significantly inhibited the expression of inflammatory cytokines, maintained the chondrocyte phenotype, and protected against ECM degeneration. We also provide evidence that the anti-inflammatory effect of POH works by regulating autophagy via the PI3K-AKT-mTOR signalling pathway. This study demonstrates for the first time that POH has a therapeutic effect on arthritis, which suggests that POH may be a promising candidate for OA therapy.
Keywords: Autophagy; Osteoarthritis; PI3K-AKT-mTOR signalling pathway; Perillyl alcohol.
© 2025. The Author(s).
Conflict of interest statement
Declarations. Competing interests: The authors declare no competing interests. Ethics statement: The protocol for this work was approved by the Animal Ethics Committee of The Second Affiliated Hospital of Guangxi Medical University (study number 2023-KY-0935) and was in accordance with the NIH guidelines. The study was conducted in compliance with the ARRIVE guidelines ( https://arriveguidelines.org ), ensuring the transparency and detailed reporting of all the in vitro experiments.
Figures
Similar articles
-
Pulchinenoside C Attenuates the Development of Osteoarthritis by Inhibiting the PI3K/AKT/NF-κB Signalling Pathway.J Cell Mol Med. 2025 Aug;29(15):e70738. doi: 10.1111/jcmm.70738. J Cell Mol Med. 2025. PMID: 40746264 Free PMC article.
-
[Mechanism of regulating PI3K-Akt signaling pathway and inhibiting chondrocyte apoptosis to improve inflammation levels in rats with knee osteoarthritis by Shenzhuo Decoction].Zhongguo Zhong Yao Za Zhi. 2025 Jun;50(12):3389-3398. doi: 10.19540/j.cnki.cjcmm.20250213.704. Zhongguo Zhong Yao Za Zhi. 2025. PMID: 40686116 Chinese.
-
Modified Qianghuo Shengshi Decoction Ameliorates Osteoarthritis via Inhibiting PI3K/Akt Pathway-Related Ferroptosis.J Cell Mol Med. 2025 Jul;29(13):e70691. doi: 10.1111/jcmm.70691. J Cell Mol Med. 2025. PMID: 40586853 Free PMC article.
-
Current clinical regulation of PI3K/PTEN/Akt/mTOR signalling in treatment of human cancer.J Cancer Res Clin Oncol. 2015 Apr;141(4):671-89. doi: 10.1007/s00432-014-1803-3. Epub 2014 Aug 22. J Cancer Res Clin Oncol. 2015. PMID: 25146530 Free PMC article. Review.
-
The role of autophagy in mitigating osteoarthritis progression via regulation of chondrocyte apoptosis: A review.Joint Bone Spine. 2024 May;91(3):105642. doi: 10.1016/j.jbspin.2023.105642. Epub 2023 Sep 20. Joint Bone Spine. 2024. PMID: 37739213 Review.
References
-
- Wang, Y., Li, J., Zhou, J., Qiu, Y. & Song, J. Low-intensity pulsed ultrasound enhances bone marrow-derived stem cells-based periodontal regenerative therapies. Ultrasonics121, 106678 (2022). - PubMed
-
- Bao, Q., et al. αB-crystallin (CRYAB) regulates the proliferation, apoptosis, synthesis and degradation of extracellular matrix of chondrocytes in osteoarthritis. Exp Cell Res382, 111459 (2019). - PubMed
-
- Peng, Z. et al. The regulation of cartilage extracellular matrix homeostasis in joint cartilage degeneration and regeneration. Biomaterials268, 120555 (2021). - PubMed
-
- Li, Y. S., Xiao, W. F. & Luo, W. Cellular aging towards osteoarthritis. Mech. Ageing Dev.162, 80–84 (2017). - PubMed
-
- Hosseinzadeh, A. et al. Apoptosis signaling pathways in osteoarthritis and possible protective role of melatonin. J. Pineal Res.61, 411–425 (2016). - PubMed
MeSH terms
Substances
Grants and funding
LinkOut - more resources
Full Text Sources
Medical
Miscellaneous
