

Prediction of traffic accidents trend with learning methods: a case study for Batman, Turkey
- PMID: 40695918
- PMCID: PMC12284139
- DOI: 10.1038/s41598-025-11835-9
Prediction of traffic accidents trend with learning methods: a case study for Batman, Turkey
Abstract
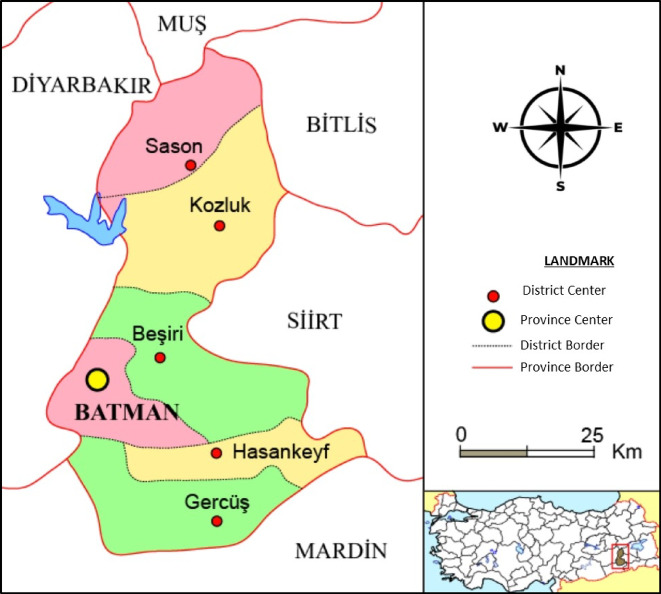
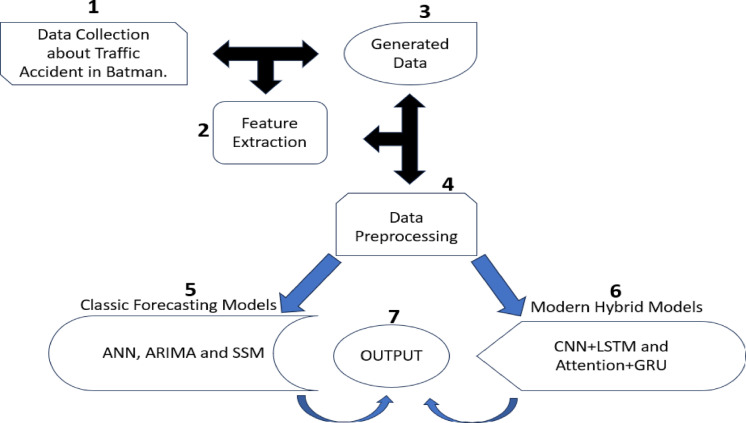
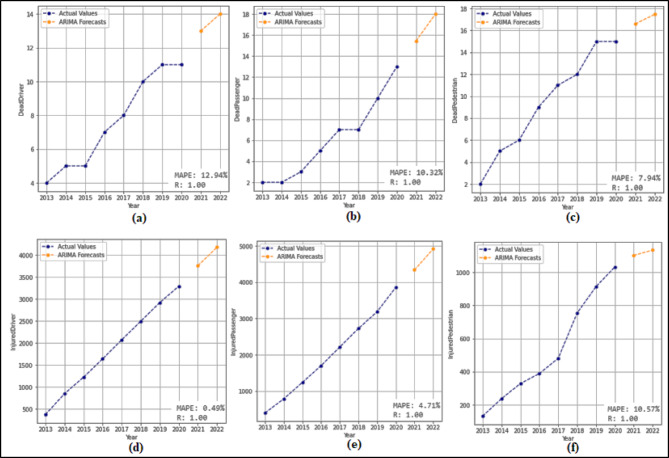
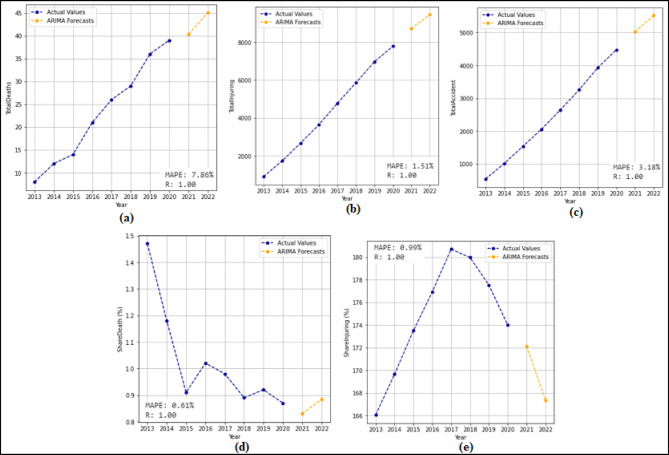
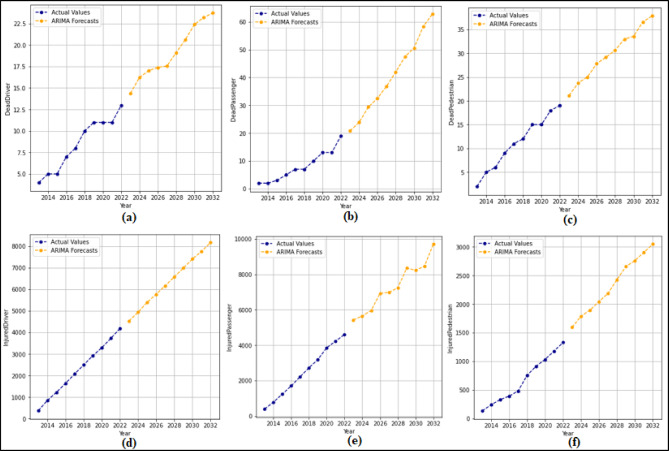
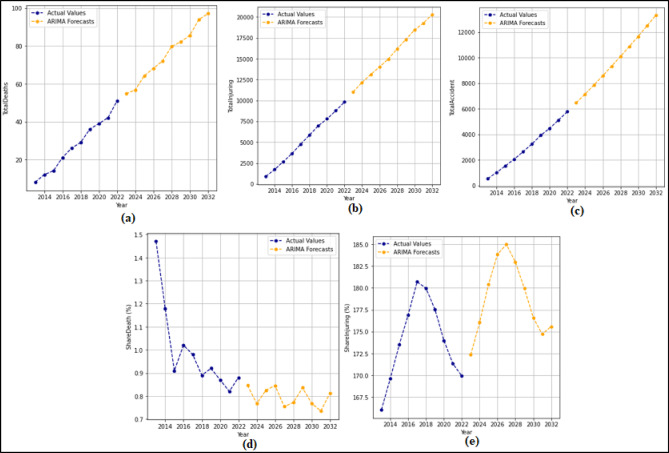
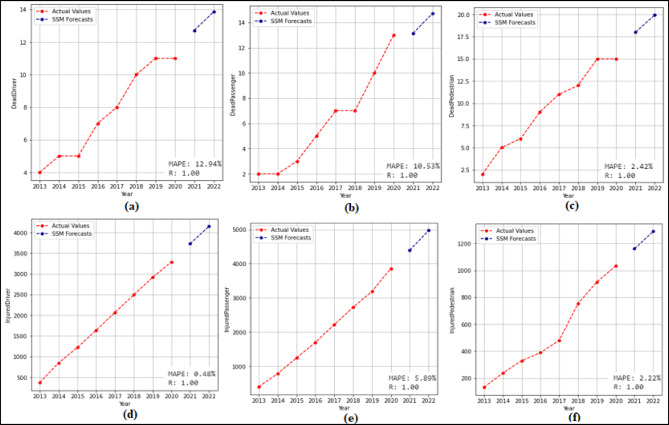
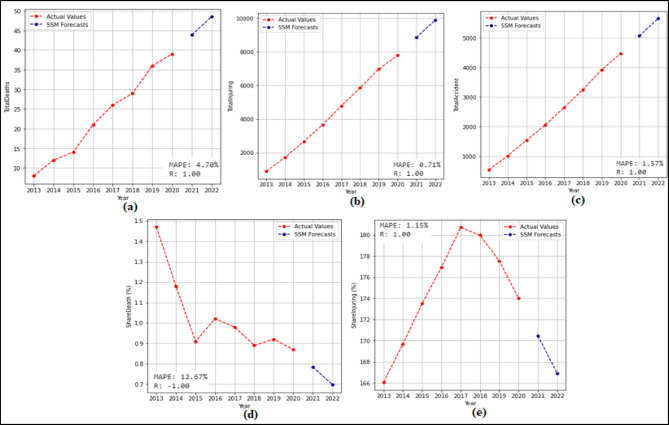
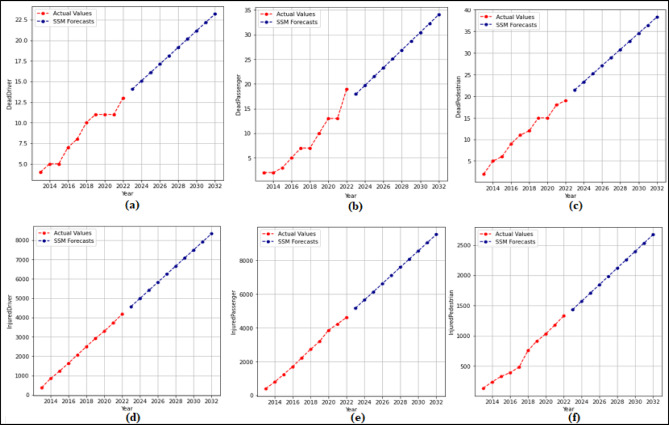
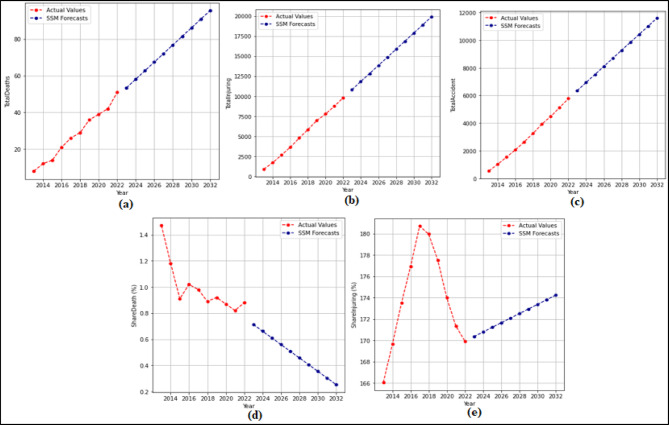
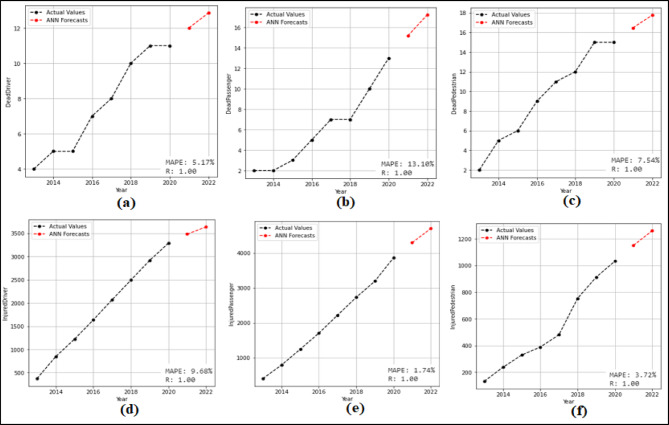
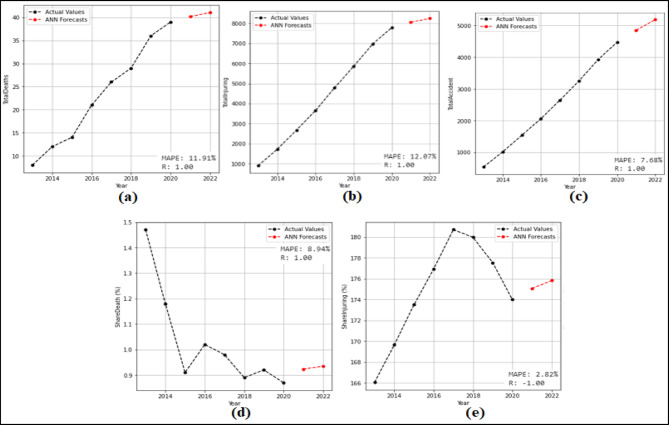
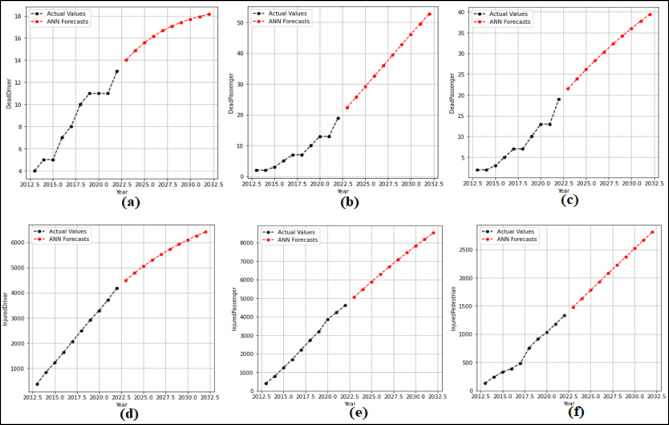
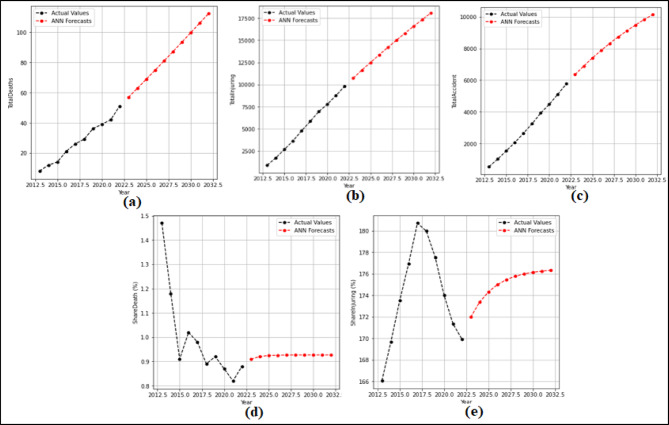
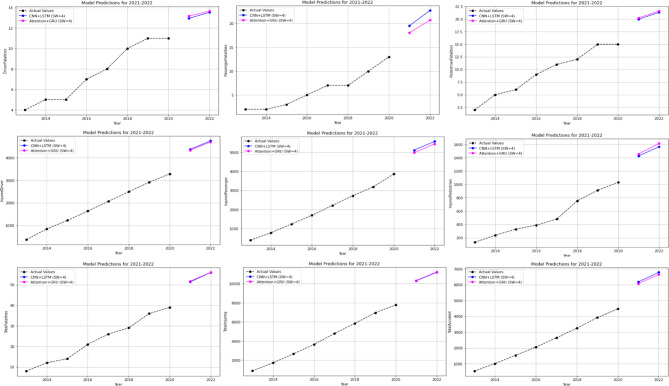
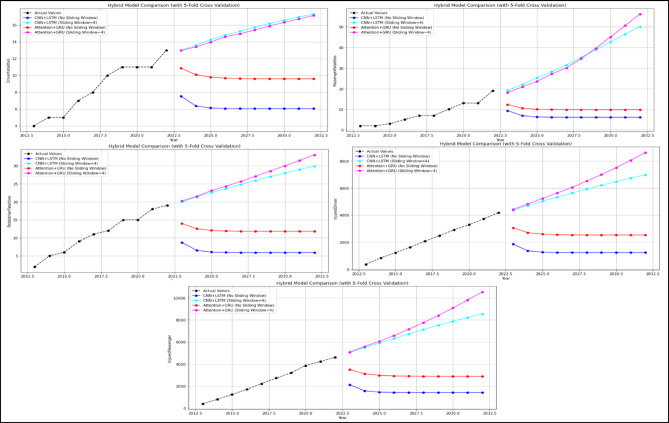
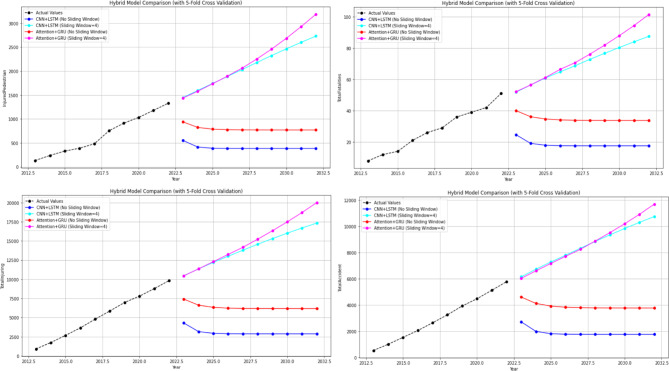
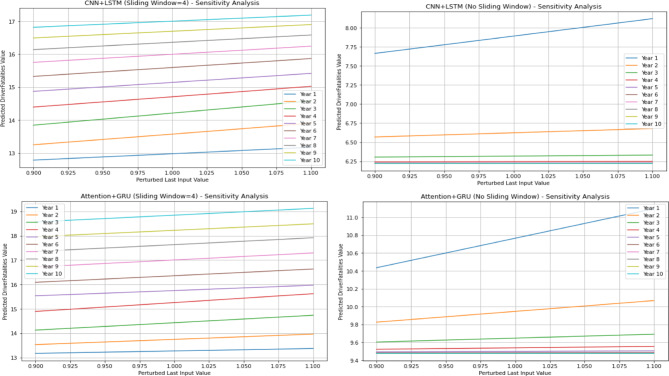
Assessing the trend of fatalities in recent years and forecasting road accidents enables society to make appropriate planning for prevention and control. This study analyses the road traffic accident data between the years 2013 and 2022 obtained for the province of Batman in Turkey, where it has not been considered before. The scope of the data analysed includes the fatalities and injuries of drivers, passengers and pedestrians. The road accident forecast for the next ten years up to 2032 is the focus of this study and numerous analyses using learning methods such as State Space Models (SSM), Artificial Neural Networks (ANN), Autoregressive Integrated Moving Average (ARIMA) and hybrid models (CNN + LSTM and Attention + GRU) have been performed on the available data. The predictions made with the above models give results with acceptable accuracy. However, they give different results depending on the parameters used. The models created with the data studied show that the number of road accidents and the related deaths and injuries will continue to increase over the next 10 years, starting in 2022. If the causes of road accidents are not eliminated and the situation remains stable as it is in 2022, the number of accidents, deaths and injuries is expected to double by 2032.
Keywords: Hybrid models; Learning methods; Prediction; Traffic accident.
© 2025. The Author(s).
Conflict of interest statement
Declarations. Competing interests: The authors declare no competing interests.
Figures
Similar articles
-
Vision screening of older drivers for preventing road traffic injuries and fatalities.Cochrane Database Syst Rev. 2014 Feb 21;2014(2):CD006252. doi: 10.1002/14651858.CD006252.pub4. Cochrane Database Syst Rev. 2014. PMID: 24563119 Free PMC article.
-
Speed enforcement detection devices for preventing road traffic injuries.Cochrane Database Syst Rev. 2006 Apr 19;(2):CD004607. doi: 10.1002/14651858.CD004607.pub2. Cochrane Database Syst Rev. 2006. Update in: Cochrane Database Syst Rev. 2010 Oct 06;(10):CD004607. doi: 10.1002/14651858.CD004607.pub3. Update in: Cochrane Database Syst Rev. 2010 Nov 10;(11):CD004607. doi: 10.1002/14651858.CD004607.pub4. PMID: 16625608 Updated.
-
Cycling infrastructure for reducing cycling injuries in cyclists.Cochrane Database Syst Rev. 2015 Dec 10;2015(12):CD010415. doi: 10.1002/14651858.CD010415.pub2. Cochrane Database Syst Rev. 2015. PMID: 26661390 Free PMC article.
-
Speed cameras for the prevention of road traffic injuries and deaths.Cochrane Database Syst Rev. 2010 Oct 6;(10):CD004607. doi: 10.1002/14651858.CD004607.pub3. Cochrane Database Syst Rev. 2010. PMID: 20927736
-
Speed cameras for the prevention of road traffic injuries and deaths.Cochrane Database Syst Rev. 2010 Nov 10;2010(11):CD004607. doi: 10.1002/14651858.CD004607.pub4. Cochrane Database Syst Rev. 2010. PMID: 21069682 Free PMC article.
References
-
- Tedjopurnomo, D. A. et al. A survey on modern deep neural network for traffic prediction: trends, methods and challenges. IEEE Trans. Knowl. Data Eng.34 (4), 1544–1561 (2020).
-
- Santos, K., Dias, J. P. & Amado, C. A literature review of machine learning algorithms for crash injury severity prediction. J. Saf. Res.80, 254–269 (2022). - PubMed
-
- WHO, W.H.O. Global status report on road safety 2023. [cited 13.12.2023; (2023). Available from: https://www.who.int/publications/i/item/9789240086517
-
- Chen, S. et al. The global macroeconomic burden of road injuries: estimates and projections for 166 countries. Lancet Planet. Health. 3 (9), e390–e398 (2019). - PubMed
-
- (TUİK). T.İ.K. Karayolu Trafik Kaza İstatistikleri,. 2023 [cited 5.012.2023; Available from,. 2023 [cited 5.012.2023; Available from: (2022). https://data.tuik.gov.tr/Bulten/Index?p=Karayolu-Trafik-Kaza-Istatistikl...
MeSH terms
LinkOut - more resources
Full Text Sources
