. 2025 Jul 22;8(1):1086.
doi: 10.1038/s42003-025-08473-2.

Analysis of histone modification interplay reveals two distinct domains in facultative heterochromatin in Pyricularia oryzae

Affiliations

Analysis of histone modification interplay reveals two distinct domains in facultative heterochromatin in Pyricularia oryzae

Thach A Dang et al. Commun Biol. .

Abstract

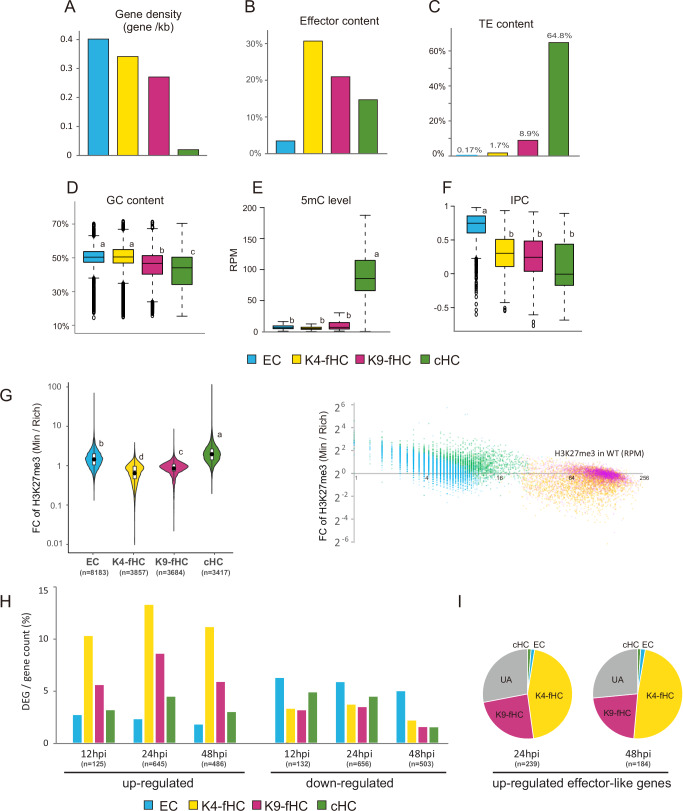
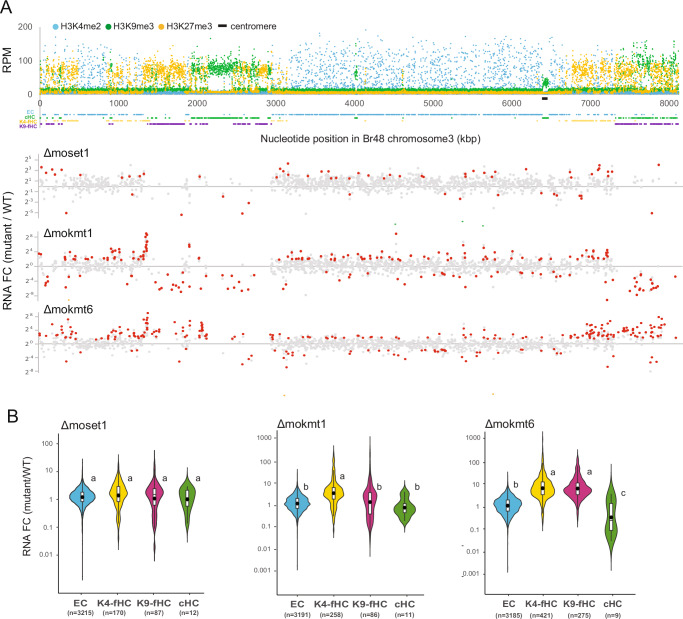
Histone post-translational modifications (PTMs) interact in complex ways to regulate chromatin structure and gene expression. To investigate this interplay, we analyze ChIP-seq and RNA-seq data from knock-out mutants lacking enzymes responsible for H3K4me2/3, H3K9me3, or H3K27me3 in the phytopathogenic fungus Pyricularia oryzae. Loss of specific PTMs alters other PTMs and gene expression in a compartment-specific manner, with distinct effects across H3K4me2-rich euchromatin (EC), H3K27me3-rich facultative heterochromatin (fHC), H3K9me3-rich constitutive heterochromatin (cHC), and centromeres. We identify two distinct fHC subcompartments: K4-fHC, adjacent to EC, and K9-fHC, adjacent to cHC. Both contain poorly conserved genes, but K9-fHC harbors more transposable elements, while K4-fHC is more enriched for genes upregulated during infection, including effector-like genes. H3K27me3 levels in K4-fHC respond to changes in other PTMs, especially H3K9me3, and to environmental conditions. These findings suggest that K4-fHC functions as a reservoir of genes highly responsive to chromatin context and environmental cues.


Conflict of interest statement

Competing interests: The authors declare no competing interests.

Figures

Fig. 1
Fig. 1. Gene deletion of a histone lysine methyltransferase in Pyricularia oryzae causes changes in the levels of histone modifications for which the enzyme itself is not primarily responsible.
A Read mapping data from ChIP-seq analysis of H3K4me2 (blue dots), H3K9me3 (green dots), and H3K27me3 (yellow dots) on chromosome 1 in the P. oryzae Br48 strain (WT). Each dot represents an RPM value of a 1 kb segment in the ChIP-seq analysis. The X-axis represents the genomic location, and the Y-axis represents the RPM value. Genomic compartments, EC, cHC, K4-fHC, and K9-fHC (see details in text) are indicated by blue, green, yellow, and purple lines, respectively, below the X-axis. B Changes in the levels of H3K4me2, H3K9me3, and H3K27me3 on chromosome 1 in the gene deletion mutants MoSet1 (Δmoset1), MoKmt1 (Δmokmt1), and MoKmt6 (Δmokmt6). Each dot represents an RPM fold change (FC) value of a 1 kb segment in the Br48 genome. Red, blue, and yellow dots represent RPM FC values of Δmoset1/WT, Δmokmt1/WT, and Δmokmt6/WT, respectively. The X-axis corresponds to the genome location shown in (A).
Fig. 2
Fig. 2. Analysis of the effect of the Δmokmt1 mutation on H3K4me2 and H3K27me3 reveals two sub-compartments in facultative heterochromatin.
Violin plots depicting fold change (FC) values of H3K4me2 (A) and H3K27me3 (B) RPM in Δmokmt1 relative to WT across different genomic compartments. Based on adjacent genomic regions (see Methods for details), the facultative heterochromatic (fHC) compartment was subdivided into two groups: K4-fHC and K9-fHC. Statistically significant differences are indicated by different letters (Tukey’s HSD test on logarithmically transformed data, P ≤ 0.01). Scatter plot showing RPM FC values of H3K27me3 (Δmokmt1/WT) (Y-axis) relative to H3K27me3 (C) or H3K9me3 (D) levels in WT (X-axis). Each dot represents an RPM FC value for a 1 kb segment in the Br48 genome. Genomic segments are color-coded as follows: EC (blue), K4-fHC (yellow), K9-fHC (purple), and cHC (green).
Fig. 3
Fig. 3. Characterization of two sub‑compartments of facultative heterochromatin, K4‑fHC and K9‑fHC.
Genomic features of each compartment: gene density (A), effector content (B), transposable element (TE) content (C), and GC content (D), 5-methylcytosine (5mC) level (E), and index of phylogenetic concordance (IPC)(F). Box plots show the GC content of segments (D), RPM values of segments from MeDIP analysis (E), and IPC values of genes (F) in each genomic compartment. Different letters indicated statistically significant differences (Tukey’s HSD test, P ≤ 0.01). G Changes in H3K27me3 levels under two culture conditions (minimal vs. rich media). Fold change values (Min/Rich) are displayed as violin plots (left) and scatter plots (right) relative to H3K27me3 levels in the wild-type (WT). Scatter plots showing the data for compartment separately are provided in Supplementary Fig. 4. Different letters indicated statistically significant differences (Tukey’s HSD test on logarithmically transformed data, P ≤ 0.01). H Differentially expressed genes (DEGs, FDR P < 0.05) during infection at 12, 24, and 48 h post-inoculation (hpi) compared to expression in rich media. DEGs were classified as up- or down-regulated and grouped by genomic compartment. DEG counts were normalized to the total number of genes in each compartment. I Pie charts showing the genomic compartments of effector-like genes up-regulated during infection.
Fig. 4
Fig. 4. The deletion of the MoSet1 gene primary induces alterations in H3K9me3 and H3K27me3 levels in the cHC compartment.
Fold change (FC) values of H3K9me3 (A) and H3K27me3 (B) RPMs in Δmoset1 relative to WT are presented in violin plots across four genomic compartments, euchromatin (EC), H3K4me2-associated facultative heterochromatin (K4-fHC), H3K9me3-associated facultative heterochromatin (K9-fHC), and constitutive heterochromatin (cHC) segments. Different letters indicate statistically significant differences (Tukey’s HSD test on logarithmic transformed data, P ≤ 0.01). RPM FC values (Δmoset1/WT) of H3K9me3 (C) and H3K27me3 (D) are presented in a scatter plot with reference to H3K9me3 levels in WT. Each dot represents an RPM FC value of a 1 kb segment in the Br48 genome. Segments in EC, K4-fHC, K9-fHC, and cHC are shown in blue, yellow, purple, and green, respectively.
Fig. 5
Fig. 5. The deletion of the MoKmt6 gene causes more global alterations in H3K9me3 levels than in H3K4me2 levels.
Fold change (FC) values of H3K4me2 (A) and H3K9me3 (B) RPMs in Δmokmt6 relative to WT are presented in violin plots with respect to five different genomic compartments. Different letters indicate statistically significant differences (Tukey’s HSD test on logarithmic transformed data, P ≤ 0.01). RPM FC values (Δmokmt6/WT) of H3K4me2 (C, E) and H3K9me3 (D, F) are presented in a scatter plot with reference to H3K9me3 (C, D) or H3K27me3 (E, F) levels in WT. Each dot represents an RPM FC value of a 1 kb segment in the Br48 genome. Segments in EC, K4-fHC, K9-fHC, and cHC are shown in blue, yellow, purple, and green, respectively.
Fig. 6
Fig. 6. Histone PTM interplay is more dependent on genomic compartments than on element types.
A Scatter plots showing fold-change (FC) values of H3K27me3 RPM in Δmokmt1 relative to WT, with reference to H3K27me3 levels in WT. Each gray dot represents the FC value of a 1 kb segment in the Br48 genome. A total of 564 genome segments were selected for each of the following categories: coding sequences (CD), centromeres (CEN), and transposable elements (TE), and are shown in blue, red, and yellow, respectively (see details in the text). B Box plots displaying FC values of H3K27me3 RPM in Δmokmt1 relative to WT across different genomic compartments, focusing on genomic elements such as CD (blue), CEN (red), and TE (yellow). Different letters indicate statistically significant differences (Tukey’s HSD test on log-transformed data, P ≤ 0.01). Scatter plots showing FC values of H3K9me3 RPM in Δmokmt6 (C) and Δmoset1 (D) relative to WT, with reference to H3K9me3 levels in WT. Color coding in BD is as described in (A).
Fig. 7
Fig. 7. The loss of MoKmt6 leads to remarkable compartment-specific changes in gene expression.
A Read mapping data from ChIP-seq analysis of H3K4me2 (blue dots), H3K9me3 (green dots), and H3K27me3 (yellow dots) on chromosome 3 in the P. oryzae Br48 strain. Each dot represents an RPM value of a 1 kb segment in the ChIP-seq analysis. Fold change (FC) values of gene expression in three kmt mutants relative to WT are plotted at the genomic locations of the genes below the ChIP-seq mapping data. Differentially expressed genes (DEGs, p < 0.01) are highlighted in red, and non-DEGs are shown as gray dots. The X-axis represents the genomic location, and the Y-axis represents the RPM value (upper panel) or FC values (lower panel). B RNA FC values in each kmt mutant relative to WT are presented in violin plots across four different genomic compartments. Different letters indicate statistically significant differences (Tukey’s HSD test on logarithmic transformed data, P < 0.01). Segments in EC, K4-fHC, K9-fHC, and cHC are shown in blue, yellow, purple, and green, respectively.
Fig. 8
Fig. 8. Gene upregulation in facultative heterochromatin is often accompanied by consistent alterations in histone modifications.
FC values of H3K4me2 or H3K27me3 RPM in Δmoset1 (A), Δmokmt1 (B), and Δmokmt6 (C) relative to WT are presented in a scatter plot, with reference to H3K4me2 or H3K27me3 levels in WT. Each dot represents an FC value of a 1 kb segment in the Br48 genome. The genomic segments containing genes that were up- or down-regulated in the kmt mutants are shown in different colors according to the levels of up- or down-regulation as follows: Red, FC ≧ 10; purple, 10 > FC ≧ 5; light pink, 5 > FC ≧ 2; pale gray, 2 > FC > 1/2; light green, 1/2 ≧ FC > 1/5; light blue, 1/5 ≧ FC > 1/10; dark blue, 1/10 ≧ FC.

Similar articles

References

    1. Bannister, A. J. & Kouzarides, T. Regulation of chromatin by histone modifications. Cell Res.21, 381–395 (2011). - PMC - PubMed
    1. Fischle, W., Wang, Y. & Allis, C. D. Histone and chromatin cross-talk. Curr. Opin. Cell Biol.15, 172–183 (2003). - PubMed
    1. Lee, J.-S., Smith, E. & Shilatifard, A. The language of histone crosstalk. Cell142, 682–685 (2010). - PMC - PubMed
    1. Zhang, T., Cooper, S. & Brockdorff, N. The interplay of histone modifications – writers that read. EMBO Rep.16, 1467–1481 (2015). - PMC - PubMed
    1. Greer, E. L. & Shi, Y. Histone methylation: a dynamic mark in health, disease and inheritance. Nat. Rev. Genet.13, 343–357 (2012). - PMC - PubMed

MeSH terms

Supplementary concepts

LinkOut - more resources