. 2025 Jul 22;15(1):26613.
doi: 10.1038/s41598-025-11209-1.

IgM+IgD- B cells in human gut-associated lymphoid tissue have memory features and give rise to IgM+ and IgA+ antibody-secreting cells

Affiliations

IgM+IgD- B cells in human gut-associated lymphoid tissue have memory features and give rise to IgM+ and IgA+ antibody-secreting cells

Ameera M Bukhari et al. Sci Rep. .

Abstract

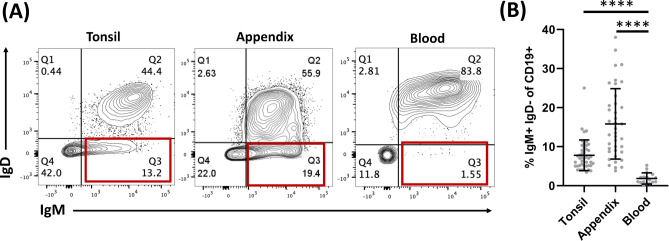
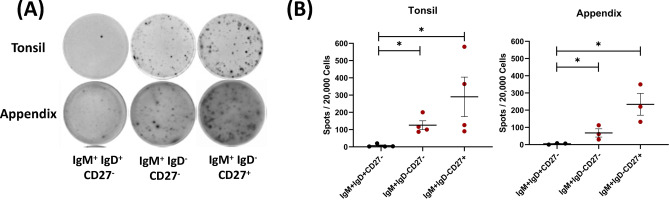
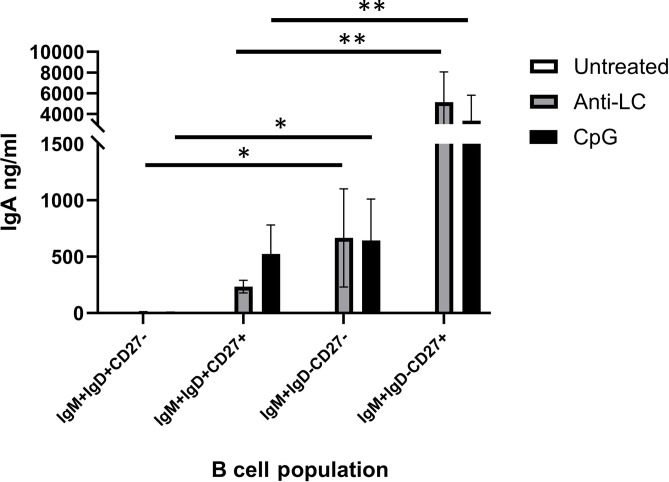
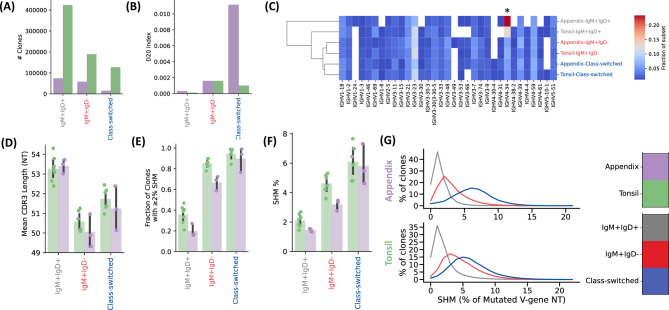
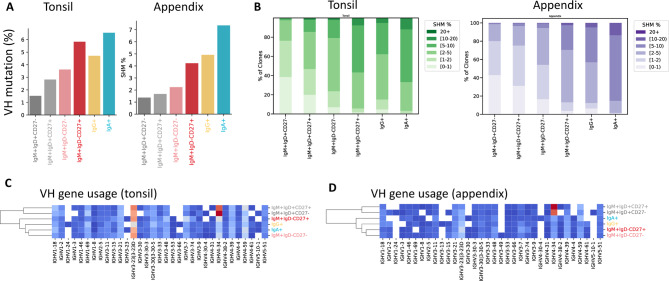
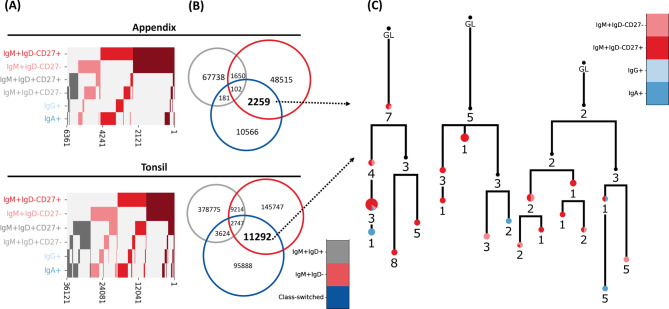
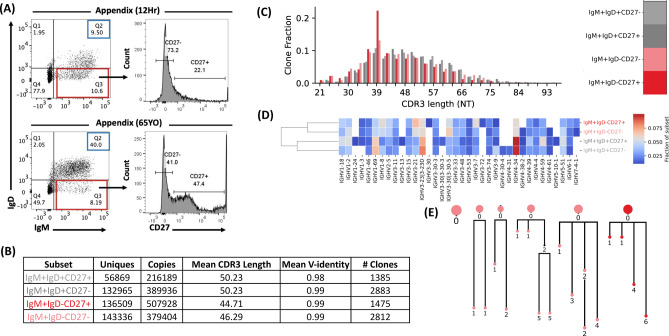
Human IgM+ B cells vary in their surface levels of IgD, with the major circulating population of IgM+IgD+ cells and a minor population (< 5%) of IgM+IgD- cells. In contrast, in gut-associated lymphoid tissue (GALT) derived from individuals undergoing tonsillectomy or appendectomy, IgM+IgD- B cells constitute ~ 30% of B cells. IgM+IgD- cells isolated from both tonsil and appendix lack plasma cell and B1 cell markers, and approximately 50% express the memory marker CD27. Functionally, GALT IgM+IgD- cells spontaneously secrete IgM, and class-switch to IgA in response to both T-dependent and T-independent stimulation ex-vivo. Immune repertoire profiling reveals that GALT IgM+IgD- cells exhibit lower levels of VH4-34 rearrangements, higher levels of somatic hypermutation, shorter CDR3 sequences and greater clonal overlap with switch memory cells than IgM+IgD+ cells. Furthermore, clonal lineage analysis reveals that IgM+IgD- clones can include class-switched sequence variants. These findings suggest a maturational scheme starting from CD27-IgM+IgD+ B cells to CD27+IgM+IgD+, and then to CD27-IgM+IgD-, and finally to CD27+IgM+IgD- B cells. In sum, IgM+IgD- B cells in the mucosa have memory features, give rise to class-switched memory B cells and antibody-secreting cells, and likely contribute significantly to the IgA repertoire in human GALT.

Keywords: B cells; Class-switching; Gut-associated lymphoid tissue (GALT); IgM+ B cells; Memory B cells; Somatic hypermutation (SHM).


Conflict of interest statement

Declarations. Competing interests: The authors declare no competing interests.

Figures

Fig. 1
Fig. 1
IgM+ IgD B cells in human GALT and peripheral blood (PB). (A) Representative flow cytometry plots of IgM and IgD expression on CD19+, CD38Low/− B cells from human tonsil, appendix, and PB. Gating strategy for cell surface phenotype analysis (Supplementary Fig. 1). (B) Frequency of IgM+IgD B cells in tonsil, appendix and PB. N (tonsil) = 44, (appendix) = 39, (PB) = 17. Results are presented as mean ± SEM; two-tailed unpaired Student’s t-test, ****P = 0.0001.
Fig. 2
Fig. 2
Spontaneous IgM secretion by tonsil and appendix B cells. (A) Representative images of ELISpot wells for spontaneous IgM secretion by tonsil and appendix IgM+ B cell subpopulations after 6 h of incubation. (B) Quantification of ELISpot data from tonsil (left) and appendix (right). Each dot represents a single subject. Results are presented as mean ± SEM; two-tailed unpaired Student’s t-test, *P < 0.05. Gating strategy for cell sorting (Supplementary Fig. 5). Population purity > 97%.
Fig. 3
Fig. 3
IgA class-switch of tonsil IgM+ B cell subpopulations in response to T-dependent and T-independent stimulation. IgM+IgD+CD27, IgM+IgD+CD27+, IgM+IgDCD27, IgM+IgDCD27+, were FACS-sorted and stimulated with CpG DNA or anti-LC + anti-CD40. Secreted IgA was measured by CBA on day 7 after stimulation. Results are presented as mean ± SEM; two-tailed unpaired Student’s t-test, n = 7, *P < 0.05, **P < 0.01. Gating strategy for cell sorting (Supplementary Fig. 5).
Fig. 4
Fig. 4
General repertoire features of appendix and tonsil B cell subsets. Donors and samples used for this analysis are shown in Tables S1 and S2 and exclude the 12-hr-old donor. N = 7 (A) Clone counts for each tissue and subset aggregated across donors (B) Fraction of sequence copies comprising the top 20 clones (D20 Index) for each tissue and subset (C) VH-gene usage by tissue/subset combination normalized by row. Each clone is counted only once per subset/tissue combination. White boxes indicate no data. VH genes occurring with a frequency of < 1% in all samples are excluded and V-ties for VH3-23 were combined. The frequency of VH4-34 (*) was significantly increased in IgM + IgD + compared to IgM + IgD- and class-switched (p < 0.001 by one-sided binomial test) (D) Average clonal CDR3 nucleotide length in each tissue and subset combination. Each dot indicates an individual. (E) Fraction of clones with at least 2% mutation in the VH region. Each dot indicates an individual. (F) Clonal mutation percentage. Each dot indicates an individual. Panels D-F show averages per person, but statistical tests were performed on the underlying data: differences between subsets are all significant (p < 0.0001) and all tissue comparisons within the same subset are significant (p < 0.001) except the CDR3 length for IgM + IgD+ (Mann-Whitney U-test). (G) Distribution of SHM for each tissue stratified by subset. The x-axis shows VH gene SHM percentage, the y-axis shows the fraction of clones with the given SHM level, and each trend line indicates subset. NT = nucleotide. Gating strategy for cell sorting (Supplementary Fig. 5).
Fig. 5
Fig. 5
Separate repertoire profiling of CD27- and CD27 + subsets. Donors and samples include individuals who have sorted subsets (see Supplementary Table 1) but exclude the 12-hr-old donor. (A) Mean level of somatic hypermutation (SHM) by clone within each sorted population; (B) Distribution of clonal SHM levels, by subset; (C) VH gene usage in tonsil; (D) VH gene usage in appendix. Data were filtered as described in the methods section. Gating strategy for cell sorting (Supplementary Fig. 5).
Fig. 6
Fig. 6
IgM+IgD clonal overlap analysis. (A) CDR3 AA overlap in each subset (see methods for filtering conditions) colored by IgM/IgD overlap. Each row indicates a subset, and each column represents a unique CDR3 AA sequence. Dark red indicates clonal presence in both IgM+IgDCD27+ and IgM+IgDCD27, bright red indicates presence in IgM+IgDCD27+ but not IgM+IgDCD27, and pink indicates presence in IgM+IgDCD27 but not in IgM+ IgD CD27+. Gray indicates lack of presence in either IgM+IgD subset. Only sequences that overlap in at least two subsets are shown. (B) Venn diagrams showing the numbers of clones in IgM+IgD+, IgM+IgD and class switched subsets. The bold numbers and dashed lines indicate the group of class-switched clones that overlap with IgM+IgD from which lineages in panel C were selected. (C) Three selected lineages from different donors showing individual clones that have IgM+IgD and IgA+ sequence variants. Nodes are colored by subset. Black nodes are inferred. Numbers under the nodes indicate the number of somatic mutations in the VH gene relative to the preceding vertical node. GL = germline. Data are limited to individuals with sorted subsets (Supplemental Table S3) and exclude the 12-hr old donor. Gating strategy for cell sorting (Supplementary Fig. 5).
Fig. 7
Fig. 7
12-hr-old repertoire analysis. (A) CD19+ B cell populations in normal appendix tissue of 12-hr old newborn compared to appendix from a 65 YO adult. (B) Metadata table for each B cell subset acquired from the 12-hr old donor. (C) CDR3 length distribution of 12-hr old donor stratified by subset. The clones in IgM + IgD + cells have longer CDR3 lengths than in IgM + IgD- cells (one-sided Mann-Whitney, p < 0.0001). Further, IgM + IgD-CD27- clones have longer CDR3s than IgM + IgD-CD27 + clones (one-sided Mann-Whiteney, p < 0.0001). (D) VH gene usage stratified by subset. Each clone counts only once. (E) Sample lineage trees of large clones with IgM+ IgD sequences. All three clones include the germline VH gene sequence (large node at the top of the tree with 0 mutations). Nodes are colored by subset using the same color scheme as in panel C. Gating strategy for cell sorting (Supplementary Fig. 5).

Similar articles

References

    1. Erika Claud, W. A. W. Chap. 5 - The intestinal microbiota and the microbiome. Gastroenterology and nutrition: neonatology questions and controversies, 73–92, ed. J.N. Richard Polin. W.B. Saunders: Elsevier Inc. (2008).
    1. Morbe, U. M. et al. Human gut-associated lymphoid tissues (GALT); diversity, structure, and function. Mucosal Immunol.14(4), 793–802 (2021). - PubMed
    1. Kagnoff, M. F. Immunology of the intestinal tract. Gastroenterology105(5), 1275–1280 (1993). - PubMed
    1. Spencer, J. & Sollid, L. M. The human intestinal B-cell response. Mucosal Immunol.9(5), 1113–1124 (2016). - PubMed
    1. Michaud, E. et al. Human secretory IgM: an elusive player in mucosal immunity. Trends Immunol.41(2), 141–156 (2020). - PubMed

MeSH terms

Substances

LinkOut - more resources