. 2025 Sep;28(9):1946-1958.
doi: 10.1038/s41593-025-02016-y. Epub 2025 Jul 22.

Voltage imaging reveals hippocampal inhibitory dynamics shaping pyramidal memory-encoding sequences

Affiliations

Voltage imaging reveals hippocampal inhibitory dynamics shaping pyramidal memory-encoding sequences

Jiannis Taxidis et al. Nat Neurosci. 2025 Sep.

Abstract

Hippocampal spiking sequences encode and link behaviorally relevant information across time. How inhibition sculpts these sequences remains unclear. We performed longitudinal voltage imaging of CA1 parvalbumin- and somatostatin-expressing interneurons in mice performing an odor-cued working memory task. Unlike pyramidal odor-specific sequences that encode odor and time throughout a delay period, interneurons encoded odor delivery, but not odor identity or delay time. Odor-triggered inhibition was exerted by stable numbers of interneurons across days, with constant cell turnover, independent of task training. At odor onset, brief spiking of parvalbumin interneurons was followed by widespread hyperpolarization and synchronized theta-paced rebound spiking across interneurons. Electrophysiology, optogenetics and calcium imaging corroborated that parvalbumin interneurons silenced most pyramidal cells during odor delivery, whereas somatostatin interneurons suppressed other interneurons. The few odor-selective pyramidal cells spiked together with interneuronal post-hyperpolarization rebound. Collectively, inhibition increases the signal-to-noise ratio of pyramidal cue representations, enabling efficient encoding of memory-relevant information.


Conflict of interest statement

Competing interests: The authors declare no competing interests.

Figures
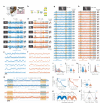
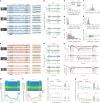
Fig. 1
Fig. 1. In vivo voltage imaging of CA1 PV and SST interneurons during DNMS.
a, Behavioral and experimental setup. Crtx, cortex; CC, corpus callosum. b, Schematic of the DNMS trial. Yellow indicates ‘odor A’. Green indicates ‘odor B’. Blue shows response window for assessing licking. c,d, Example traces from PV (c) and SST (d) interneurons during a DNMS trial. Average FOV with outlined region of interest (ROI) (left). Inverted ΔF/F, scaled by maximum value (middle). Black dots show detected spikes; red indicates licks; color boxes show odor cues and response window as in b. Gray traces indicate locomotion. Peri-spike ΔF/F during all (gray) and average (thick line) action potentials in the trial (right). e,f, Expanded traces from boxes in c and d. g,h, Example PV (g) and SST (h) interneuron recorded during 20 continuous DNMS trials, plotted as in c and d. i, Histogram of median interspike interval per cell and estimated probability density (solid lines). j,k, Mean firing rates (j) and burst index (k) in PV versus SST cells; P = 4.28 × 10−5, 8 × 10−4; two-sided Wilcoxon rank-sum test (WT). l. Histogram of mean speed score per cell. Dashed lines show mean shuffle baseline per cell group. m, Example raw and 4–10 Hz theta-bandpassed ΔF/F from PV and SS cells. n, Mean ± s.e. power spectral density of each cell group during motion versus immobility. No significant differences exist (P > 0.05; WT per frequency; false discovery rate (FDR)). o, Mean intracellular theta amplitude for PV versus SST cells; P = 1.47 × 10−9; two-sided WT. p, Mean firing rate of each PV and SST cell, normalized to maximum, over the intracellular theta cycle (black). q, Mean strength (vector length) versus preferred phase of theta modulation per cell. Black shows intracellular theta cycle. Distributions of preferred phase (top) and modulation strength (right) are similar for both cell groups (P > 0.05; parametric Watson–Williams multisample test and WT, respectively). Lines indicate distribution means. In all violin plots throughout figures, dots are median values, boxes are 25% and 75% quartiles and whiskers show 1.5× interquartile range. il and nq contain all cells pooled (n = 107 PV, 93 SST cells).
Fig. 2
Fig. 2. Interneurons encode cue presentation, not odor or delay time.
a, Example traces from PV odor field, displayed as in Fig. 1. b, Example PV odor fields, encoding both odor A and odor B presentation (left is same cell as in a). Each row is the neuron’s z-scored firing rate during a trial, with trials stacked by odor combination (left). Vertical lines show odor delivery (trial layout shown on top). Dashed line indicates firing field time bin. Mean ± s.e. rate over all odor A (yellow) and odor B trials (green) (bottom). c, Same for odor-specific PV interneurons encoding odor A (left) or odor B (right). Dashed lines cover preferred-odor trials. df, Same as ac for SST interneurons. g, Average z-scored firing rates of odor A-specific (top row) and odor B-specific (bottom row) PV cells over odor A (left) and odor B (right) trials, stacked by field time bin (dots) (top). Same for SST cells (bottom). h, Average firing rates of non-odor-specific PV (top) and SST cells (bottom) over odor A and odor B trials. i, Percentage field cells per mouse per session (P = 0.78, two-sided WT; n = 28 PV, 28 SST sessions) (top). Mean cumulative % of odor-specific, non-odor-specific and no-field cells (bottom). j, Odor selectivity (absolute values). P = 0.39, two-sided WT (n = 106, 93 cells, one outlier removed). Dashed lines show chance selectivity. Red *P = 7.32 × 10−6, 0.0026; two-sided WT against chance. k, Mean firing rate change from baseline, during the first odor, the delay, the second odor and the response window in field cells (n = 107 PV, 91 SST cells). ***P1st odor-delay = 6 × 10−7, 7.3 × 10−5 (PV, SST); P1st odor-post = 4.2 × 10−9, 9.8 × 10−5; P1st odor-2nd odor = 0.065, 0.323; two-sided WT. Red *P < 0.05, right-tailed t-test against zero; FDR corrected. l, Percentage odor versus delay fields per session. Small jitter added for clarity. Square indicates distribution means. ***P = 5.58 × 10−5, *P = 0.012; paired-sample two-sided t-test. m, Odor scores versus speed scores (n = 107 PV, 93 SST cells). ***P = 4.48 × 10−9, 1.58 × 10−9, paired-sample two-sided t-test. n, Odor-decoding accuracy with SVM decoders trained on odor-specific cells (n = 21 PV, 12 SST), non-odor-specific cells (n = 34, 25) or no-field cells (n = 39, 27), during odor presentation. ***P < 0.001, two-sided WT, FDR corrected. Dashed lines show mean shuffle baselines. Red *P = 0.0003, right-tailed WT against chance baseline; FDR corrected. o, Mean ± s.e. time-decoding error (absolute) across the odor-delay interval, with Bayesian decoders trained as in n. Dashed lines indicate mean shuffle baselines. Black bars show P < 0.05; two-sided WT, FDR corrected.
Fig. 3
Fig. 3. Interneuron stability across days and DNMS training.
a, Example PV cell during four DNMS trials before and after DNMS training. Expanded FOV (left). b, Firing rates per trial and odor-specific averages across the two recording sessions, plotted as in Fig. 2. c,d, Same as a,b for an SST cell. e, Average firing rates across trials for pooled PV (top) and SST cells (bottom) on any session X and following session X + 1. Cells stacked by maximum rate time bin on session X. Cells recorded for >2 sessions shown independently for each consecutive pair. White dots show significant fields. Black circles show nonsignificant firing peaks. f, Same for last naive session versus first trained session. g, Percentage cells recorded across two consecutive sessions that retained odor spiking (‘stable’), moved their firing peak into (‘inflow’) or out of the odor delivery time bins (‘outflow’). n = 7 and eight session pairs for PV and SST; *Pstable-inflow = 0.013; Pstable-outflow = 0.016; Pstable-stable = 0.049; all other P > 0.05; two-sided WT; FDR corrected. h, Mean cross-correlation of a cell’s firing rates across all trials between two sessions, as a function of distance between the sessions. Pre-Post, same between last naive versus first trained session (P > 0.05, two-sided WT for both cell groups). Small jitter added for clarity. ρS, Spearman correlation between distance of trained sessions and firing rate correlations (P > 0.05 for both cell groups). i,j, Performances of PV-Cre (i) and SST-Cre mice (j) per recording (dots) and mean ± s.e. per day (lines) (top). Naive and trained sessions indicated on top. Note that multiple training days exist between the two groups. Mean ± s.e. (middle). Percentage field cells over all PV (i) and SST cells (j) per session. Lines indicate individual mice. Mean ± s.e. odor selectivity of cells (absolute values) (bottom). Pooled distributions for naive versus trained sessions (right). For PV, from top, n = 31 versus 73 recordings, 10 versus 18 sessions, 31 versus 75 cells; ***P = 2.24 × 10−4, two-sided WT. For SST, from top, n = 35 versus 49 recordings, 10 versus 15 sessions, 36 versus 51 cells: ***P = 6.58 × 10−10, two-sided WT.
Fig. 4
Fig. 4. A hyperpolarization during odor onset resets intracellular theta.
a, Example trials from three PV cells (from three different mice) with odor-triggered hyperpolarization traces. Average FOV (left). ΔF/F, detected spikes and locomotion during four DNMS trials, displayed as before (middle). Expanded traces within box (right). b, Trial-average theta-bandpassed ΔF/F (gray) and odor A (yellow) and odor B (green) average ΔF/F across all corresponding trials, for the three cells shown in a. c,d, Same as a,b for three example SST cells (from three different mice). Licks shown for one trained session. e, Percentage of trials with a significant hyperpolarization per cell. Lines indicate median values (P = 0.9; WT). Insets show average odor-triggered ΔF/F over trials with significant and nonsignificant hyperpolarization. f, Distribution of mean amplitude of ΔF/F hyperpolarization per cell (z-score-scaled over baseline of 0.5 s before odor onset; P = 0.98; WT). gi, Distribution of hyperpolarization onset time (g), time of minimum ΔF/F (h) and hyperpolarization duration (i). Distributions truncated at 400 ms for clarity. P = 0.06, 2.4 × 10−4, 6.3 × 10−4; two-sided WT; FDR. j, Amplitude of maximum depolarized versus hyperpolarized ΔF/F during odor presentation. Lines show least square fit for each cell type. P = 0.004, 0.901 (PV, SST); F-test. One outlier removed for plotting clarity. k, Trial-average ΔF/F (top) and theta-bandpassed ΔF/F (bottom) for PV and SST cells. Insets show zoomed in segments around the first odor. l, Variance of theta phases across all trials. m,n, Average ΔF/F power spectral density for PV (m) and SST cells (n) across trials (top). Mean ± s.e. ΔF/F theta amplitude (bottom). o, Mean ± s.e. hyperpolarization amplitude across sessions and naive versus trained session averages (right) for PV and SST cells (n = 26 versus 57 PV recordings and 33 versus 36 SST). P = 0.0068, 1 (PV, SST); two-sided WT. p, Same for rate of hyperpolarization occurrence (n = 31 versus 76 PV recordings and 36 versus 51 SST). P = 0.022, 0.0005 (PV, SST), two-sided WT. ρS, Spearman correlation with imaging sessions, P = 0.0027, 0.0019 (PV, SST), random permutation test.
Fig. 5
Fig. 5. Brief synchronous spiking by PV cells, precedes PV and SST hyperpolarization and synchronizes rebound activity at theta peaks.
a, Example trace of a PV cell around the first odor of a series of DNMS trials, displayed as before. Note the brief ‘onset spiking’, preceding the hyperpolarization in some, but not all, trials. b, Spikes of pooled PV field cells (light blue) and no-field cells (dark) around the first odor across all trials (top). Average finescale firing rates (binned at 5 ms) of the two cell groups aligned to the mean ΔF/F of all PV cells (blue trace) and its theta power-bandpassed signal (gray trace) (bottom). The three vertical lines are aligned to the first spike peak and the two theta peaks, respectively. c, Same for pooled SST cells. The three vertical lines indicate the same time points as in b. d, Mean firing rates at onset spiking (30–50 ms after odor onset) in field cells versus no-field cells (PV, 58 versus 49 cells; SST, 45 versus 48 cells). P = 0.403, 0.388; two-sided WT. e, Same for rebound spiking (200–500 ms after odor onset). P = 0.0004, 0.004; two-sided WT. f, Firing increase from baseline (0.5 s pre-odor) at onset and rebound spiking in PV versus SST cells (n = 107, 93 cells). P = 4.97 × 10−4, 0.89; two-sided WT. Single outlier truncated at d and f for plotting clarity.
Fig. 6
Fig. 6. Inhibition shapes pyramidal odor responses.
a, Schematic of surgical preparation for Neuropixel recordings with GtACR2 optogenetic stimulation (image created with BioRender). Example brain slices from a PV-Cre and an SST-Cre mouse showing GtACR2 expression in PV and SST cells, respectively. Scale bar, 50 µm. Slice showing Neuropixel probe placement (stained with CM-DiI) in CA1 (bottom). b,c, Raster plots of putative pyramidal units across DNMS trials (b) or interneuronal and pyramidal units during the first odor (c). Only trials without optogenetic stimulation shown. Spikes colored according to each trial’s first odor (yellow, odor A; green, odor B). Lines in b depict odor A-specific fields. d, Average firing rates, relative to baseline, of pyramidal units (n = 5 mice, 17 sessions), stacked by mean odor response during the first DNMS odor (right). Dashed lines separate cells with positive and negative odor responses. Mean ± s.e. rates across cells with positive and negative odor responses (bottom). e, Top row shows mean ± s.e. firing rates throughout the first DNMS odor of pyramidal units with positive and negative odor responses and interneuronal units from PV-Cre mice (n = 19, 77, 10 units) in trials without versus with optogenetic stimulation (solid and dashed lines) applied during the interneuronal rebound window (blue bars). Interneuronal firing rates from voltage imaging shown for reference (black). Black marks indicate time points with significantly different rates (P < 0.05, two-sided WT, FDR across the odor). Right-side panels show mean ± s.e. rates across the odor, without and with stimulation (from left, P = 0.64, 0.002, 0.81; paired-sample two-sided t-test). Bottom row shows same for stimulation during the odor-onset window (n = 17, 79, 10 units. From left, P = 0.28, 0.008, 0.3). f, Same as e for SST-Cre mice (top row, n = 36, 103, 35 units. From left, P = 0.78, 0.1, 0.005. Bottom row, n = 34, 105, 35 units. P = 0.191, 0.014, 0.008). g, Pyramidal odor A (yellow) and odor B (green) fields, sorted as in d (only cells with fields shown). Dashed line as in d. Odor selectivity of field cells (dots; small jitter added for clarity) and mean ± s.e. across cells (line) (bottom). Odor selectivity of early fields versus post-hyperpolarization fields (<200 ms and >200 ms from odor-onset, respectively; n = 56, 124 units) (right). P = 1.13 × 10−5, left-tailed t-test. h, Mean ± s.e. firing rate around the first odor (dashed box in d), from pyramidal units with negative odor responses (red) and with positive odor responses and peak rates within (dark brown) or after the hyperpolarization window (light brown; <200 ms and >200 ms from odor-onset, respectively) (top). Mean ± s.e. interneuronal unit firing rates (middle). Mean ΔF/F and mean ± s.e. firing rates of pooled interneurons from voltage imaging (bottom). Vertical lines show same time points as in Fig. 5b,c.
Extended Data Fig. 1
Extended Data Fig. 1. Spiking, intracellular theta and locomotion in PV and SST cells.
a. Average action potential waveform and individual examples in PV and SST cells. b. Mean spike amplitude (top) and spike width (bottom) was higher in PV versus SST cells (P = 1.37 × 10⁻⁷ and 5.45 × 10⁻⁶ respectively; two-sided Wilcoxon test – ‘WT’). 1 PV outlier removed from a and b (bottom) for plotting clarity. c. Mean firing rates across locomotion, immobility, and immobility during the reward window in PV vs SST cells (only cells with both locomotion and immobility segments used for locomotion and immobility comparisons: n = 98 vs 95 cells. For third comparison all cells included: 107 vs 93 cells. From left: P = 0.122, 0.0001, 0.0048; two-sided t-test). d. Mean locomotion (a.u.) during odor delivery versus outside odor delivery in each trial in PV-Cre and SST-Cre mice. Black rectangle: Average across trials was significantly higher during odors in both cell groups (n = 1730 trials, P = 6.36 × 10⁻²¹ for PV; n = 1390, P = 0.014 for SST; paired-sample two-sided t-test). e. Mean firing rates of PV and SST cells during locomotion versus immobility segments in each trial. Black rectangle: Average across cells and trials was significantly higher for locomotion in both cell groups (only trials with both motion and immobility segments included, excluding time bins around trial onset and offset – see Methods. n = 985, P = 5.19 × 10⁻¹⁰ for PV, n = 746; P = 0.0003 for SST; paired-sample two-sided t-test). f. Top: Mean intracellular theta amplitude (a.u.) during odor delivery versus outside odor delivery per trial (n = 1730 trials, P = 4.89 × 10⁻¹⁷ for PV; n = 1390, P = 4.21×10⁻¹¹ for SST). Bottom: Mean intracellular theta amplitude during locomotion versus immobility segments in each trial (only trials with both motion and immobility segments included, excluding time points around trial onset and offset – see Methods. n = 1005, P = 0.0023 for PV; n = 763, P = 0.715 for SST; paired-sample two-sided t-test).
Extended Data Fig. 2
Extended Data Fig. 2. Spiking and subthreshold properties of field cells and their correlation with locomotion and odors-OFF.
a. Average de-spiked ΔF/F traces of odor-field cells (left) and delay-field cells (right) around their field time point for individual cells (thin lines) and averaged across cells (thick). b. Average de-spiked ΔF/F traces of PV and SST odor-field and delay-field cells during the first odor delivery (gray box). Top: Odor-specific cells. Bottom: Non-specific cells. No significant differences observed at any time point in the odor (P > 0.05, WT). c. Mean firing rates across trials, speed scores and ROI sizes (number of pixels of each ROI) for PV and SST field cells (n = 58 PV, 45 SST cells) versus non-field cells (n = 49 PV, 48 SST). * P = 0.0399, ** P = 0.001, all other P > 0.05, two-sided WT. d. Mean theta amplitude, strength of theta modulation of spiking (vector length) and theta phase (measured in 1/π, 0 corresponds to theta peaks for field cells versus non-field cells, plotted as in c. P = 0.0329 for SST theta power, P = 0.014 for PV theta phase, all other P > 0.05; parametric Watson–Williams test for theta phase and two-sided WT for power and modulation. e-f. Mean firing rates of individual PV (e) and SST (f) odor-field cells (thin lines) and averaged across cells (thick) during odor delivery for trials with immobility (left) and locomotion (right) during odors. Corresponding locomotion traces shown on top row. g. Example traces from a PV cell across 4 trials, displayed as in Fig. 1c. Gray boxes: Odor cue windows in trials where the odor was not delivered. h. Top row: Firing rates from 3 PV cells across trials with alternating odors ON and OFF (scaled by maximum average rate across odor/delay bins). Second row: Same firing rates rearranged over all odor ON and OFF trials (separated by white line). Third row: Mean ± SE firing rates across odor ON and OFF trials (black and red respectively). Bottom row: Average locomotion in the same trials. i. Mean ± SE firing rates (averaged across all odor/delay bins and all corresponding trials) of each cell (left) and corresponding mean locomotion (right) in odor ON versus odor OFF trials. n = 8 cells; P = 0.0108, 0.083; paired-sample two-sided t-test. j–l. Same as G-I for SST cells. In panel l: n = 6 cells; P = 0.0184, 0.683; paired-sample two-sided t-test.
Extended Data Fig. 3
Extended Data Fig. 3. Interneuron firing properties remain overall stable across days and over training.
a. Example PV cell recorded for 5 consecutive imaging sessions, plotted as in Fig. 3. Dashed lines: significant field over a specific odor (line covers corresponding trials) or through both odors (Day 4). b. Progression of firing peak time bins across days for PV (left) and SST cells (right) recorded across multiple sessions. Gray: Non-odor-specific fields. Yellow, green: odor A- or odor B-specific fields, respectively. Open circles: nonsignificant peaks. Lines connect a cell’s progression. c. Progression of odor selectivity index across days, displayed as in b (sessions on x axis). d. Odor-decoding accuracy of SVM decoders trained on odor-specific cells, non-odor-specific cells, or no-field cells, during odor-presentation, in naïve (top) and trained sessions (bottom), plotted as in Fig. 2n. e–g. Progression of average firing rate (e), theta power (f) and phase locking strength (mean vector length; g) across all trials, as in c (field-type not displayed). Right: Mean ± SE for last naïve vs first trained session and for every X vs X + 1 trained session. * P = 0.0068, paired-sample two-sided t-test (distributions of PV and SST cells were pooled for this comparison; n = 11. P > 0.05 for all other comparisons). h. From top: Evolution of mean locomotion per session, mean firing rate per cell over all trials, theta power and theta modulation of spiking (vector length) per cell across PV-Cre mice and PV cells (left) or SST-Cre mice and SST cells (right), plotted as in Fig. 3i, j. For PV: n = 31 vs 73 recordings, 31 vs 76 cells; from top: P = 9.44 × 10⁻¹⁰, 0.218, 0.0146, 0.0152; two-sided WT. For SST: n = 35 vs 49 recordings, 36 vs 51 cells; from top: P = 1.23 × 10⁻¹¹, 0.0123, 0.466, 0.543 for SST.
Extended Data Fig. 4
Extended Data Fig. 4. Odor-onset hyperpolarization is not artifactual and is reduced in PV cells after training.
a. Example traces across odor cues from a cell and average ΔF/F ± SE (bottom) when the odor air valve is on the rig versus detached. Bottom right: Mean hyperpolarization (ΔF/F minimum, z-score-scaled over baseline of 0.5 sec before odor onset) in the two conditions (n = 8, P = 0.95, paired-sample two-sided t-test). b. Top: Example traces from an SST cell expressing the positively deflected ASAP4 GEVI and average traces from 5 SST cells over the first odor cue (right). ΔF/F traces were not inverted, yet odor-onset deflections still indicate a hyperpolarization. c. Average traces from two example PV (top) and two example SST cells (bottom) across trials with the odors ON (black) vs OFF (red). Right: Mean hyperpolarization (scaled as before) for the two cell groups over the two conditions. n = 8, 6 cells; P = 0.052, 0.97 for PV and SST; paired-sample two-sided t-test. d. ΔF/F traces from individual PV (top) and SST (bottom) cells and corresponding averages (thick lines), during the first odor cue, in trials with lowest (left, 5th percentile) versus highest locomotion (right, 95th percentile of average locomotion during odor). Corresponding locomotion traces shown in red. e. Left: Mean hyperpolarization over preferred vs non-preferred trials for PV and SST odor-specific field cells (P > 0.5, paired-sample two-sided t-test). Middle: Mean hyperpolarization in odor-specific, non-specific field cells and no-field cells. Right: frequency of hyperpolarization occurrence for the three cell groups (P > 0.05; two-sided WT). f. Hyperpolarization amplitude (top) and rate of occurrence (bottom) in PV cells in correct versus error trials (left, P > 0.5, paired-sample two-sided t-test) and as a function of performance (right) across trained sessions. g. Same for SST cells. h. Hyperpolarization amplitude (top) and rate of occurrence (bottom) in PV cells, as a function of locomotion during the hyperpolarization (left), the firing rate after the hyperpolarization (middle) and theta amplitude during the hyperpolarization (right). i. Same for SST cells. Black lines in f-i: Least squares estimate. ** P < 0.01, *** P < 0.001, otherwise P > 0.05; F-test.
Extended Data Fig. 5
Extended Data Fig. 5. Fine-timescale spiking across different cell groups and odors, and its evolution across days.
a-b. Average wideband and theta-bandpassed ΔF/F aligned with mean firing rates of (from top) odor A, odor-B, non-odor-specific and no field PV cells (a) and SST cells (b) across odor A (yellow) and odor-B (green) trials. Bottom: Rates of odor-specific cells in their preferred (gray) and non-preferred trials. c. Evolution of odor-onset spiking in PV cells (SST cells did not exhibit onset spiking) plotted as before. P = 0.54; two-sided WT. d. Evolution of rebound spiking in PV and SST cells. From top: P = 0.57, 0.0085; two-sided WT.
Extended Data Fig. 6
Extended Data Fig. 6. Electrophysiology and optogenetics during DNMS.
a. Average action potential waveforms from all units identified as putative pyramidal cells and interneurons. b. Distribution of waveform peak-to-trough ratios versus peak-to-trough time distances versus mean firing rates for the two clusters. Right: Projection of peak-to-trough ratios versus distances. Dots: individual units, colored by cluster. c. Mean firing rates of putative pyramidal cells and interneurons (P = 7.3 × 10⁻⁹; two-sided WT). d. Average CA1 pyramidal layer LFP trace across the first odor in DNMS across mice. Top: Average ΔF/F from all interneurons recorded with voltage imaging. e. Top: Raster plot from putative interneuronal unit in a PV-Cre mouse, across DNMS trials without stimulation and with stimulation during the rebound window (blue bar). All trials shown were from same trial block (randomly mixed). Spikes colored by each trial’s first odor (yellow: odor A, green: odor-B). Superimposed interneuronal firing rates from voltage imaging shown for reference (black). Bottom: Same for interneuron from SST-Cre mouse and stimulation during odor-onset. f. Average firing rates of putative pyramidal cells from PV-Cre mice, during the first DNMS odor, with and without optogenetic inhibition of interneurons during the hyperpolarization window, plotted as in Fig. 6 (from left: P = 0.096, 0.956 for average odor responses; two-sided WT). g. Same for SST-Cre animals (from left: P = 0.69, 0.092 for average odor responses; two-sided WT).
Extended Data Fig. 7
Extended Data Fig. 7. Calcium imaging-based pyramidal odor responses are shaped by inhibition.
a. Example field of view from two-photon calcium imaging in CA1 pyramidal layer of a Gad2-Cre:Ai9 mouse expressing GCaMP6f (green) in all cells and tdTomato in all GABAergic cells (magenta). Right: Same FOV after ROI segmentation of pyramidal cells. b. Example traces of average deconvolved signal (‘spiking’) across all trials in cells with positive (left) and negative odor responses (right). c. Average z-scored spiking of pooled cells (N = 11 mice, 58 sessions), stacked by their mean response during the first odor. Note that many cells stop spiking during the odor. Right: z-scored odor responses averaged across the odor duration. Most cells exhibit a negative response. Bottom: Mean spiking across all cells with positive (brown) and negative (red) odor responses. d. Field time bins of pooled Odor A (yellow) and Odor-B (green) sequence-cells, sorted according to the order in C. Most time cells (70.8%) have negative odor responses. e. Average spiking (scaled) of pooled pyramidal sequence-cells, sorted by time field. Spiking is zoomed around the first odor in preferred (left) and non-preferred trials (right). Cells with fields after this time window are omitted. Note the response in non-preferred trials of early odor cells. f. Distribution of odor selectivity index from all sequence-cells (dots; small jitter added for plotting clarity) and average (thick trace). Multiple early odor cells have low selectivity index. Right: Selectivity index of early odor cells (field < 250 msec post odor-onset) vs the remaining sequence-cells (P = 1.82 × 10⁻¹⁸, left-tailed WT).

Update of

References

    1. Eichenbaum, H. Time cells in the hippocampus: a new dimension for mapping memories. Nat. Rev. Neurosci.15, 732 (2014). - PMC - PubMed
    1. Buzsáki, G., McKenzie, S. & Davachi, L. Neurophysiology of remembering. Annu. Rev. Psychol.73, 187–215 (2022). - PMC - PubMed
    1. Aronov, D., Nevers, R. & Tank, D. W. Mapping of a non-spatial dimension by the hippocampal-entorhinal circuit. Nature543, 719–722 (2017). - PMC - PubMed
    1. Eichenbaum, H., Kuperstein, M., Fagan, A. & Nagode, J. Cue-sampling and goal-approach correlates of hippocampal unit activity in rats performing an odor-discrimination task. J. Neurosci.7, 716–732 (1987). - PMC - PubMed
    1. Taxidis, J. et al. Differential emergence and stability of sensory and temporal representations in context-specific hippocampal sequences. Neuron108, 984–998 (2020). - PMC - PubMed

LinkOut - more resources