. 2025 Jul 23;15(1):26708.
doi: 10.1038/s41598-025-12415-7.

LncRNA NRAD1 regulates the triple-negative breast cancer transcriptome by miRNA biogenesis, localization, and predominately non-ceRNA interactions

Affiliations

LncRNA NRAD1 regulates the triple-negative breast cancer transcriptome by miRNA biogenesis, localization, and predominately non-ceRNA interactions

Hannah F Cahill et al. Sci Rep. .

Abstract

Breast cancer is a leading cause of cancer mortality in women with triple-negative breast cancer (TNBC) presenting greater treatment challenges due to its aggressive disease progression. Understanding TNBC's unique cell signaling and gene expression profiles will reveal novel therapeutic strategies. Non-coding RNAs, including microRNAs (miRNAs) and long non-coding RNAs (lncRNAs), have emerged as key regulators of gene expression and potential therapeutic targets. This study focuses on a TNBC-enriched lncRNA, non-coding RNA in the aldehyde dehydrogenase 1A pathway (NRAD1, previously LINC00284), which promotes progression in multiple cancers. Our analysis reveals that NRAD1 is central to miRNA-mRNA networks in TNBC cells, mediating cancer-promoting gene expression changes. Fractionation studies showed that NRAD1 is primarily located in the nucleus and mitochondria, with some cytoplasmic presence allowing for transcript-specific competitive endogenous RNA (ceRNA) interactions with miRNAs. However, NRAD1 primarily effects miRNAs independently of ceRNA activity, instead upregulating DICER (a miRNA biogenesis protein), altering sub-cellular distribution, and reducing biogenesis of mitochondria-localized miRNA (i.e., miR-4485-3p). These findings demonstrate novel regulatory interactions between the cancer-promoting lncRNA NRAD1 and miRNAs that alter gene expression in TNBC, expanding our understanding of regulatory lncRNA-miRNA effects, TNBC biology, and highlighting future therapeutic strategies for targeting non-coding RNAs.

Keywords: Breast cancer; Gene-expression; LINC00284; Long non-coding RNA; NRAD1; Triple-negative; microRNA.


Conflict of interest statement

Competing interests: J.V., M.C.D.W, and P.M. are co-founders of Oncolinc Therapeutics Inc., a startup aimed at developing targeted therapies against lncRNAs as novel immunotherapies. P.M. is also a co-founder of Theranib Inc. a startup aimed at developing small molecule drugs targeting ALDH1A3 for the treatment of cancer. H.F.C., J.M.B., M.L.T.,R.P.A.,M.E.M.,and D.V have no competing interests.

Figures
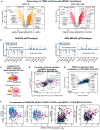
Fig. 1
Fig. 1
NRAD1 regulates the expression of hundreds of genes in TNBC (A) Log2 fold changes in gene expression following NRAD1 knockdown (GapmeR #4) compared to control in SUM149 (left) and MDA-MB-468 (right) cells, as determined by microarray (n = 3). A significance threshold pf p < 0.05 and fold change cutoffs of ± 1.4 are indicated by the dashed line. Genes of interest are labeled. The number of upregulated and downregulated genes meeting those cut-offs are indicated. (B) qPCR analysis of selected differentially expressed genes data represents relative expression in NRAD1 targeting GapmeR #4 and GapmeR #3 compared to GapmeR negative control in SUM149 and MDA-MB-468 (n = 5). Statistical significance was determined using one-way ANOVA followed by Dunnett’s multiple comparisons test. Error bars represent the standard deviation. Significant p-values are as follows: * < 0.05, ** p < 0.01, *** p < 0.001, **** p < 0.0001. (C) The total number of significant genes in each cell line were compared to one another and the overlapping upregulated and downregulated genes by NRAD1 knockdown by Gapmer #4 were identified by Venn diagrams. (D) Comparison between differentially expressed genes from microarrays (in A) in MDA-MB-468 (x-axis) and SUM149 (y-axis). Common genes that are also correlated with patient data from TCGA—Cell 2015 data set are highlighted. Genes upregulated with NRAD1 knockdown and negatively correlated with NRAD1 expression in patient data (light blue) and genes downregulated with NRAD1 knockdown and positively correlated with NRAD1 expression in patient data (Navy). Correlation between the two data sets was determined through spearman correlation analysis. (E) Pearson and Spearmen coefficients were calculated based on the co-expression of NRAD1 and all the genes in the TCGA Cell 2015 (n = 815); RNA-Seq RSEM log2. Genes are labeled based on their significance to NRAD1 microarray data (in A). Negatively correlated genes that are upregulated with NRAD1 knockdown in both cell lines are light blue, total number is indicated. Positively correlated genes that are downregulated with NRAD1 knockdown in both cell lines are Navy, total number is indicated. (F) Co-expression analysis between NRAD1 and DUSP5, SLC20A1, MAPK4 and UBASH3B in TCGA Cell 2015 dataset. Each point represents a patients expression profile, TNBC subtype patients are indicated in pink. Spearman correlation (R) and p-value significance are listed.
Fig. 2
Fig. 2
NRAD1 alters the microRNA landscape in TNBC. (A) Log2 fold changes of miRNAs following NRAD1 targeting GapmeR #4 compared to GapmeR negative control in SUM149 and MDA-MB-468 cells, as determined by miRNA microarray (n = 3). Significance cut-offs of p-value < 0.05 and fold-change cutoffs of ± 1.4 and miRNAs meeting these cutoffs are labeled. (B) Correlation between the miRNA microarrays (in S2A and A) comparing NRAD1 targeting GapmeR #3 (x-axis) versus GapmeR #4 (y-axis) SUM149 or MDA-MB-468. Commonly regulated miRNAs are indicated by color (light blue downregulated and blue upregulated) and labeled. Spearman correlation and p-value are indicated. (C) Correlation between the miRNA microarrays comparing MDA-MB-468 (x-axis) and SUM149 (y-axis) in GapmeR #4 treated cells versus negative control. Commonly regulated genes are indicated by color (light blue downregulated and blue upregulated) and labeled. Bolded miRNA names have also been assessed by TaqMan qPCR assays (D). Spearman and p-value are listed. (D) Venn diagrams comparing the number of miRNAs upregulated or downregulated upon NRAD1 knockdown by GapmeR #4 in MDA-MB-468 and SUM149 (E) TaqMan qPCR of selected miRNAs identified in the miRNA microarray (in A). The data represents relative expression of NRAD1 targeting GapmeR #3 or GapmeR #4 compared to GapmeR negative control (n = 5). Statistical significance was determined using one-way ANOVA followed by Dunnett’s multiple comparisons test. Error bars represent the standard deviation. Significant p-values are as follows: * < 0.05, **p < 0.01, ***p < 0.001, ****p < 0.0001.
Fig. 3
Fig. 3
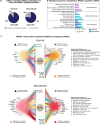
NRAD1-miRNA-mRNA networks and gene ontology analysis (A) Pie charts illustrating the percentage of NRAD1-regulated mRNAs predicted to be regulated by NRAD1-regulated miRNAs. (B) Biological processes identified through gene ontology enrichment of NRAD1 regulated miRNAs. (C) Cystoscope network plots depicting NRAD1-miRNA–mRNA relationships.
Fig. 4
Fig. 4
MDA-MB-468 and SUM149 have differing NRAD1 transcript abundance and GapmeR knockdown efficiencies which affects potential ceRNA interactions with miRNAs (A) NRAD1 chromosomal locations and transcript maps as described in ensembl. The binding locations of the GapmeRs and primers are indicated on transcripts. (B) NRAD1 transcript abundance in SUM149 and MDA-MB-468 cells using primers specific to NRAD1-201, NRAD1-202, or NRAD1-201,-202, -204, and -206 (n = 7). Expression is relative to reference genes. Error bars indicate standard deviation. Statistical significance was determined by two-way Anova followed by multiple comparisons post-test. Significant p values are indicated as follows: **p < 0.01, ****p < 0.0001. (C) Relative abundance of NRAD1-201, NRAD1-202, or NRAD1-201, -202, -204, and -206 in SUM149 and MDA-MB-468 cells treated with NRAD1-targeting GapmeR #3 or GapmeR #4 compared to negative control GapmeR. Values are relative to reference genes and negative control treated samples. Error bars indicate standard deviation. Statistical significance was determined using one-way ANOVA followed by Dunnett’s multiple comparisons test, ns = not significant, ****p < 0.0001. (D) The number of unique miRNAs that were predicted to bind NRAD1 transcript variants are plotted against the transcript’s identifier and a Venn diagram identifies the number of overlapping and distinct miRNAs predicted to bind the transcripts. (E) A Euler plot identifies the overlap of regulated miRNAs that are predicted to bind the NRAD1 transcript identified through lncBook. The dots indicate which NRAD1 transcript(s) is predicted to be bound by the regulated miRNAs in the bars above. The bargraphs above indicate the miRNAs regulated by the NRAD1-targeting GapmeRs (top) and in each cell line (middle). (F) The miRNAs predicted to bind NRAD1 through lncBook, are divided into groups; those that are not regulated by NRAD1 and those that regulated by NRAD1 knockdown by GapmeR #3 or GapmeR #4 and the no treatment abundance of the miRNA from miRNA microarrays are compared. Significance was determined by unpaired t-test.
Fig. 5
Fig. 5
The majority of miRNA regulation by NRAD1 is through ceRNA-independent mechanisms. (A) Venn diagrams summarize the number of miRNAs predicted to bind NRAD1, the miRNAs regulated by NRAD1, and those that are both regulated by and predicted to bind NRAD1 in SUM149 and MDA-MB-468 cells. (B) The predicted bindings sites and binding energy of miRNAs (from lncBook) that are regulated in the miRNA microarray in SUM149 or MDA-MB-468 cells upon targeting of NRAD1 transcripts 201, 202, 204 and 206 by GapmeR #4. Heatmaps indicate predicted binding energy of miRNAs along the NRAD1 transcript (top plots). The common region between all four transcript is indicated by a navy bar. (C) Potential non-canonical binding site of miR-4485-3p to NRAD1 transcripts, lines indicate sequence binding complementarity. (D) Relative luciferase activity generated by MDA-MB-468 cells transfected with pmirGLO dual-luciferase miRNA target expression vector bearing the potential non-canonical NRAD1 target sequence for miR-4485-3p (wildtype) or mutated version and treated with mimic-miR-4485-3p or mimic negative control (n = 4). Luciferase activity is normalized to the cells treated with the mimic negative control and wildtype vector. Significance was determined by paired t-test, ns not significant.
Fig. 6
Fig. 6
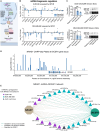
NRAD1 knockdown reduces protein levels of key miRNA biogenesis player, DICER. (A) Summary of the microRNA biogenesis pathway and where the players act in the pathway. (B) QPCR assessment of effects of NRAD1 knockdown on the miRNA biogenesis pathway regulators in SUM149 and MDA-MB-468 cells. Data represents relative expression in NRAD1 knockdown (GapmeR #3 and GapmeR #4) compared to GapmeR negative control (n = 5). Statistical significance was determined using one-way ANOVA followed by Dunnett’s multiple comparisons test. Significant p-values are as follows: *< 0.05, **p < 0.01. Error bars represent the standard deviation. (C) DICER protein western blot analysis in SUM149 (n = 4) and MDA-MB-468 (n = 6). The bar graphs represent the quantified fold change in the DICER band induced by GapmeR #3 or GapmeR #4 compared to the negative control GapmeR and normalized to the total protein for each sample. Representative images of one of the multiple independent experiments are shown. Statistical significance was determined using one-way ANOVA followed by Dunnett’s multiple comparisons test. Significant p-values are as follows: *< 0.05, **p < 0.01, ***p < 0.001 (D) NRAD1 ChIRP-seq peaks at the DICER1 locus. (E) A network plot of the miRNAs regulated by NRAD1 that are predicted/validated to target DICER1 mRNA.
Fig. 7
Fig. 7
Subcellular localization of NRAD1 and the effect of NRAD1 knockdown on miRNA localization and biogenesis in the mitochondria. (A) The relative percentage of COX1, MT-12S, DANCR, and NRAD1 transcripts in nuclear and cytoplasmic fractions of SUM149 and MDA-MB-468 (n = 4) as quantified by qPCR. (B) The relative percentages of NRAD1, COX1, MT-12S, and DANCR transcripts in the mitochondria and mitochondria-depleted cytoplasmic fractions of SUM149 and MDA-MB-468 cells (n = 4) as quantified by pPCR. (C) The relative percentage of miR-4485-3p, miR-1303, miR-4521, miR-484, RNU48, and miR-25-3p in nuclear and cytoplasmic fractions of SUM149 and MDA-MB-468 (n = 4) as quantified by TaqMan qPCR assay. (B) The relative percentage of miR-4485-3p, miR-1303, miR-4521, miR-484, RNU48, and miR-25-3p in the mitochondria and mitochondria-depleted cytoplasmic fractions of SUM149 and MDA-MB-468 cells (n = 4) as quantified by TaqMan qPCR assays. (E) The mitochondrial origin of miR-4485-3p is derived from the degradation of antisense mitochondrial RNA-2 (ASncmtRNA-2) transcript. (F) The levels of ASncmtRNA-2 are quantified by qPCR in SUM149 and MDA-MB468 cells treated with NRAD1-targetting GapmeR #3 or GapmeR #4 relative to levels in the GapmeR negative control samples (n = 3). Statistical significance was determined using one-way ANOVA followed by Dunnett’s multiple comparisons test. Error bars represent the standard deviation. P value indicated as follows: * < 0.05, ns = not significant. (G) The effect of NRAD1 knockdown (by GapmeR #3 or GapmeR #4) compared to negative control GapmeR on the percentages of miR-4485-3p, miR-1303, miR-4521, miR-484, RNU48, and miR-25-3p in mitochondrial fraction. Data represents the percentage of whole cytoplasmic RNA fraction that is cytoplasmic. Statistical significance was determined using one-way ANOVA followed by Dunnett’s multiple comparisons test. Error bars represent the standard deviation. Significant p-values are as follows: *< 0.05, **p < 0.01, ns not significant.

Similar articles

References

    1. Arnold, M. et al. Current and future burden of breast cancer: Global statistics for 2020 and 2040. Breast66, 15 (2022). - PMC - PubMed
    1. Waks, A. G. & Winer, E. P. Breast cancer treatment: A review. JAMA J. Am. Med. Assoc.321, 288–300 (2019). - PubMed
    1. Bianchini, G., De Angelis, C., Licata, L. & Gianni, L. Treatment landscape of triple-negative breast cancer—expanded options, evolving needs. Nat. Rev. Clin. Oncol.19, 91–113 (2021). - PubMed
    1. Cejalvo, J. M. et al. Intrinsic subtypes and gene expression profiles in primary and metastatic breast cancer. Cancer Res.77, 2213–2221 (2017). - PMC - PubMed
    1. Bernard, P. S. et al. Supervised risk predictor of breast cancer based on intrinsic subtypes. J. Clin. Oncol.27, 1160 (2009). - PMC - PubMed

MeSH terms

Grants and funding

LinkOut - more resources