. 2025 Jul 22;8(1):1089.
doi: 10.1038/s42003-025-08518-6.

Beyond the nuclear border: single-cell analysis of in situ sequenced human brain tissue using cellular features

Affiliations

Beyond the nuclear border: single-cell analysis of in situ sequenced human brain tissue using cellular features

Janssen M Kotah et al. Commun Biol. .

Abstract

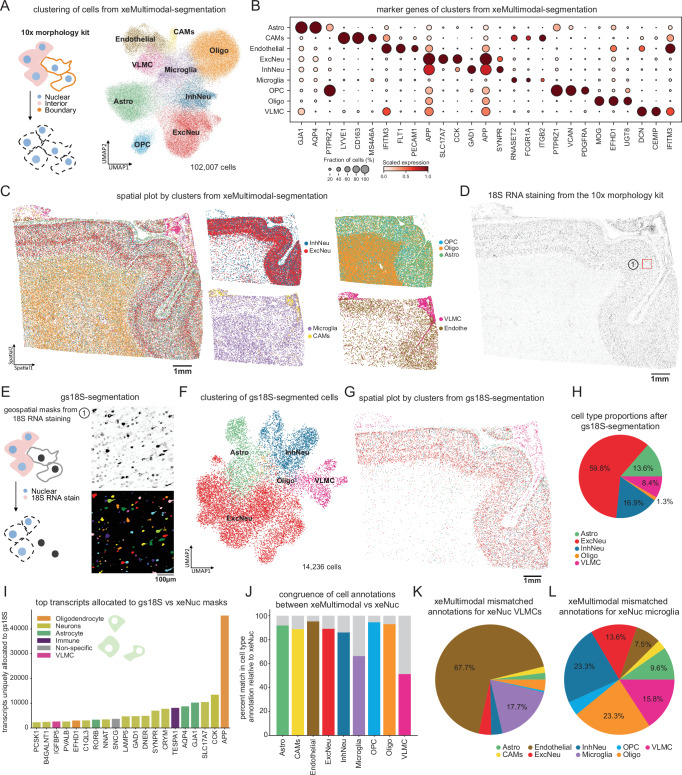
Spatial transcriptomics has advanced our understanding of cellular heterogeneity at single-cell resolution. Here, we assess the suitability of in situ sequencing (ISS) for analyzing formalin-fixed, paraffin-embedded (FFPE) postmortem human brain tissue. A key challenge in ISS data analysis is optimizing transcript allocation while minimizing misallocation, particularly in the morphologically complex central nervous system (CNS). We compared geospatial methods using nuclear and expanded nuclear boundaries for segmentation and transcript allocation. While overall cell-type proportions remained comparable, transcript allocation methods affected specific cell types, including microglia, neurons, and neurovascular cells. To enhance specificity, we integrated fluorescent imaging data targeting 18S RNA and IBA1 protein to direct transcript allocation toward RNA-rich cells (e.g., neurons) and microglia, respectively. We demonstrate how this approach, paired with secondary allocation of transcripts outside imaging masks, improved both the number of microglia detected and the specificity of microglial transcripts assigned. Our method offers a flexible and efficient strategy for targeted transcript allocation based on cellular morphology, optimizing CNS cell segmentation in FFPE-preserved human brain tissue.


Conflict of interest statement

Competing interests: The authors declare no competing interests.

Figures

Fig. 1
Fig. 1. Nuclear allocation of Xenium data identifies brain cell types in postmortem FFPE human brain.
A Schematic representation of geospatial allocation of transcripts to cells based on cell masks segmented by the Xenium and construction of the cell-by-gene count matrices. We used both masks generated from strict nuclear segmentation (xeNuc) and masks that approximated cell borders based on a 5 µm nuclear expansion (xeCell). Created in BioRender, https://BioRender.com/2e6thte. B UMAP of cells (n = 74,521) from xeNuc-segmentation and transcript allocation in sample XE1, colored by cell type. C Dot plot of the top three most enriched genes per cluster, as calculated by a two-tailed Wilcoxon rank-sum test, in xeNuc-segmented cells in sample XE1. D Spatial plots of xeNuc-segmented cells, colored by annotated cell types (left). Insets on the right depict the same spatial plot, showing only two cell types at a time. E UMAP (left) and spatial plot (right) of cells (n = 88,651) from xeCell-segmentation and transcript allocation, colored by cell type. F Histogram of the top 20 genes with the most transcripts allocated to xeCell masks that were not allocated to xeNuc masks in sample XE1. Genes are colored based on the gene annotation in Supplementary Fig. 1F. G Comparison of cell type annotations in xeCell- (centroid, colored by cell type) and xeNuc-segmentation (nuclear mask outline, colored by cell type). H Bar plot of cell type annotation congruence in matched cells between xeCell- and xeNuc-segmentation. Each bar shows the percentage of cells in xeCell-segmentation with the same (colored) or different annotation (gray) in xeNuc-segmentation. Pie chart of cell type proportions for xeNuc- (I) and xeCell-segmentation (J) in sample XE1. K Pie chart of xeCell annotations for nuclei classified as VLMCs based on xeNuc-segmentation. Astro astrocytes, ExcNeu excitatory neurons, InhNeu inhibitory neurons, Oligo oligodendrocytes, OPC oligodendrocyte precursor cells, PVM perivascular macrophages, VLMC vascular leptomeningeal cells.
Fig. 2
Fig. 2. Xenium multimodal segmentation improves transcript allocation based on morphological information.
A Schematic representation of stainings included in the Xenium Multi-Tissue Stain Mix kit that were used to create segmented (xeMultimodal) masks in sample XE2. The right panel shows the UMAP of cells (n = 102,007) obtained from xeMultimodal-segmentation, colored by cell type. B Dot plot of the top three most enriched genes, as calculated by a two-tailed Wilcoxon rank-sum test, per cell type. C Spatial plots of xeMultimodal-segmented cells, colored by cell types (left). Insets on the right depict the same spatial plot, showing only selected cell types. D Greyscale image of the 18S RNA staining obtained with the Xenium Multi-Tissue Stain Mix kit. E Schematic representation of the mask-based segmentation based on the 18S image (gs18S) used in geospatial transcript allocation (left). Box 1 shows a zoomed-in area from (D), with cells colored randomly to highlight segmentation masks (right). F UMAP of cells (n = 14,236) obtained by gs18S-segmentation, colored by cell type. G Spatial plot of gs18S-segmented cells, colored by cell type. H Pie chart of cell type proportions for gs18S-segmented cells in sample XE2. I Histogram of the top 20 genes with the most transcripts allocated to the gs18S masks that were not allocated to the xeNuc masks in sample XE2. Genes are colored based on the gene annotation in Supplementary Fig. 1F. J Bar plot of cell type annotation congruence in matched cells between xeMultimodal- and xeNuc-segmentation. Each bar shows the percentage of cells in xeMultimodal-segmentation with the same (colored) or different annotation (gray) in xeNuc-segmentation. Pie chart of discordant cell type annotations in xeMultimodal-segmented cells from nuclei classified as VLMCs (K) or microglia (L) based on xeNuc-segmentation. Astro astrocytes, CAMs CNS-associated macrophages, ExcNeu excitatory neurons, InhNeu inhibitory neurons, Oligo oligodendrocytes, OPC oligodendrocyte precursor cells, VLMC vascular leptomeningeal cells. Parts of panels (A, E, and F) were created in BioRender, https://BioRender.com/ra1sr9b.
Fig. 3
Fig. 3. Cell segmentation using post-run immunostainings provides specificity to transcript allocation.
A Greyscale image of post-run IBA1 immunofluorescence staining in sample XE1. B Schematic representation of the mask-based segmentation based on the IBA1 image (gsIBA) used in geospatial transcript allocation (left). Box 1 shows a zoomed-in area from (A), with cells colored randomly to highlight segmentation masks (right). C Histogram of the top 20 genes with the most transcripts allocated to gsIBA masks that were not allocated to xeNuc masks in sample XE1. Genes are colored based on the gene annotation in Supplementary Fig. 1F. D Bar plot of transcripts allocated to a cell as a percentage of all decoded transcripts. Genes are grouped based on the gene annotation in Supplementary Fig. 1F. E Schematic representation of secondary re-allocation of transcripts, which were not allocated to gsIBA masks, to xeCell masks. Created in BioRender. F UMAP of merged cells (n = 91,515 cells) obtained by sequential gsIBA/xeCell-segmentation. G Depiction of where cells from either segmentation method (xeCell, n = 83,013, or gsIBA, n = 8502) landed on the UMAP space. H Spatial plot of merged cells obtained by sequential gsIBA/2°xeCell-segmentations, colored by cluster. I Pie chart of cell type proportions obtained by sequential gsIBA/2°xeCell-segmentations. J Violin plots of unique genes and transcripts in microglia obtained by sequential gsIBA/2°xeCell-segmentations, split by segmentation method. K Violin plots comparing microglial cell mask area between gsIBA/2°xeCell-segmentations. L Scatter plot of gene expression (average transcript count per number of genes in each gene set) by cell mask area (µm²) for microglial and non-microglial genes in microglia obtained per segmentation method. M Top 10 differentially expressed genes, as calculated by a two-tailed Wilcoxon rank-sum test, between gsIBA- and 2°xeCell-segmented microglia showed increased specificity of microglial genes in gsIBA-segmentation. Astro astrocytes, ExcNeu excitatory neurons, InhNeu inhibitory neurons, Oligo oligodendrocytes, OPC oligodendrocyte precursor cells, PVM perivascular macrophages. Parts of panels (B and E) were created in BioRender, https://BioRender.com/ra1sr9b.

References

    1. Masuda, T., Sankowski, R., Staszewski, O. & Prinz, M. Microglia heterogeneity in the single-cell era. Cell Rep.30, 1271–1281 (2020). - PubMed
    1. Gerrits, E., Heng, Y., Boddeke, E. W. G. M. & Eggen, B. J. L. Transcriptional profiling of microglia; current state of the art and future perspectives. Glia68, 740–755 (2020). - PMC - PubMed
    1. Pozojevic, J. & Spielmann, M. Single-cell sequencing in neurodegenerative disorders. Mol. Diagn. Ther.27, 553–561 (2023). - PMC - PubMed
    1. Keren-Shaul, H. et al. A unique microglia type associated with restricting development of Alzheimer’s disease. Cell169, 1276–1290.e17 (2017). - PubMed
    1. Krasemann, S. et al. The TREM2-APOE pathway drives the transcriptional phenotype of dysfunctional microglia in neurodegenerative diseases. Immunity47, 566–581.e9 (2017). - PMC - PubMed

LinkOut - more resources