Clinical Trial
. 2025 Oct;6(10):1676-1692.
doi: 10.1038/s43018-025-01018-w. Epub 2025 Jul 22.

Combination of pembrolizumab and radiotherapy induces systemic antitumor immune responses in immunologically cold non-small cell lung cancer

Affiliations
Clinical Trial

Combination of pembrolizumab and radiotherapy induces systemic antitumor immune responses in immunologically cold non-small cell lung cancer

Justin Huang et al. Nat Cancer. 2025 Oct.

Abstract

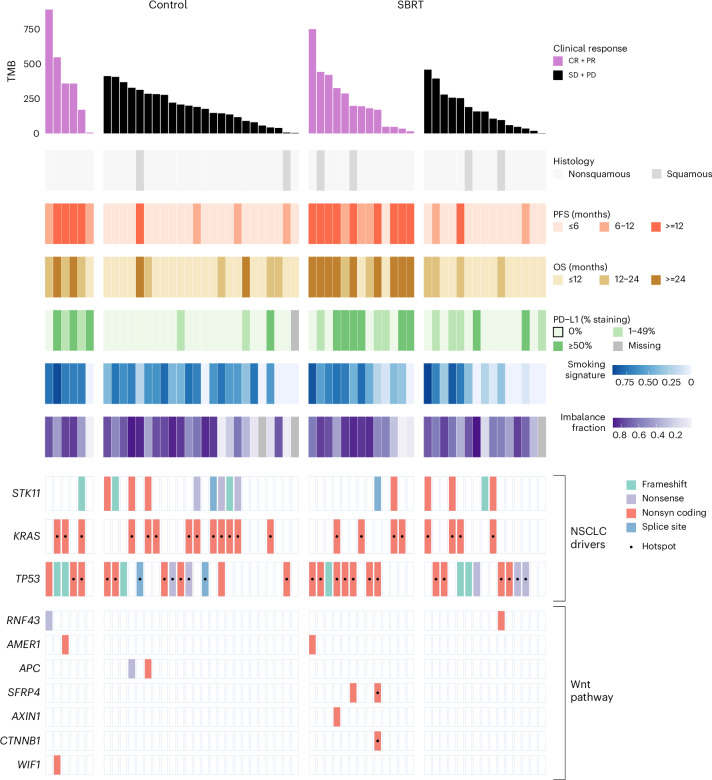
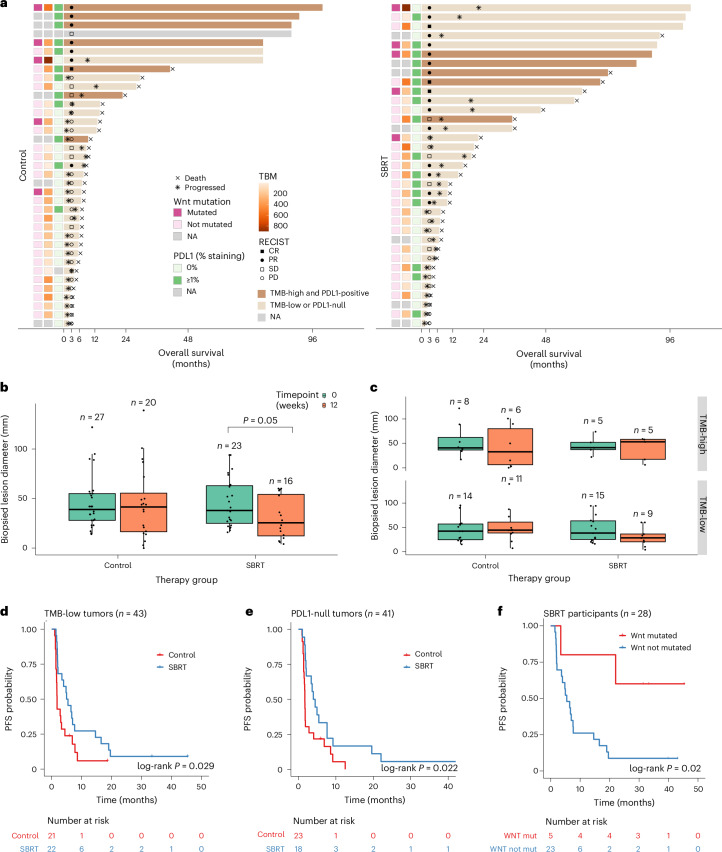
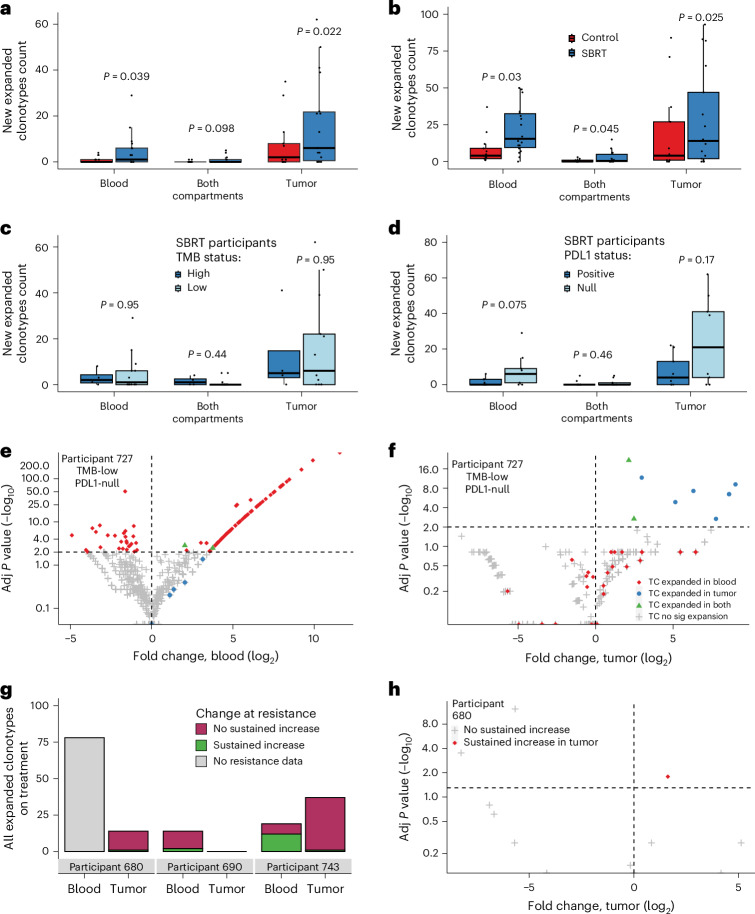
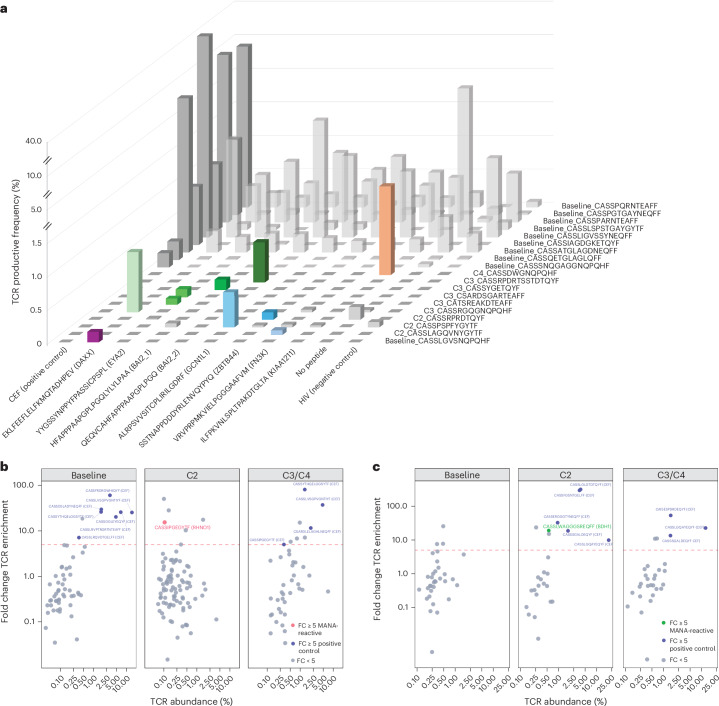
The abscopal effects of radiation may sensitize immunologically cold tumors to immune checkpoint inhibition. We investigated the immunostimulatory effects of radiotherapy leveraging multiomic analyses of serial tissue and blood biospecimens (n = 293) from a phase 2 clinical trial of stereotactic body radiation therapy (SBRT) followed by pembrolizumab in metastatic non-small cell lung cancer ( NCT02492568 ). Participants with immunologically cold tumors (low tumor mutation burden, null programmed death ligand 1 expression or Wnt pathway mutations) had significantly longer progression-free survival in the SBRT arm. Induction of interferon-γ, interferon-α and antigen processing and presentation gene sets was significantly enriched after SBRT in nonirradiated tumor sites. Significant on-therapy expansions of new and pre-existing T cell clones in both the tumor (abscopal) and the blood (systemic) compartments were noted alongside clonal neoantigen-reactive autologous T cell responses in participants with long-term survival after radioimmunotherapy. These findings support the systemic immunomodulatory and antitumor effects of radioimmunotherapy and may open a therapeutic window of opportunity to overcome immunotherapy resistance.


Conflict of interest statement

Competing interests: V.A. receives research funding to Johns Hopkins University from Astra Zeneca and Personal Genome Diagnostics, has received research funding to Johns Hopkins University from Bristol-Myers Squibb and Delfi Diagnostics in the past 5 years, is an advisory board member for Astra Zeneca and Neogenomics (compensated), and receives honoraria from Foundation Medicine, Guardant Health and Personal Genome Diagnostics; these arrangements have been reviewed and approved by Johns Hopkins University in accordance with its conflict-of-interest policies. V.A. is an inventor on patent applications (63/276,525, 17/779,936, 16/312,152, 16/341,862, 17/047,006 and 17/598,690) submitted by Johns Hopkins University related to cancer genomic analyses, circulating tumor DNA therapeutic response monitoring and immunogenomic features of response to immunotherapy that have been licensed to one or more entities. Under the terms of these license agreements, the university and inventors are entitled to fees and royalty distributions. W.S.M.E.T. receives research funding to the Netherlands Cancer Institute from MSD, AZ and Regeneron. N.N. is an inventor on patent application 17/598,690 submitted by Johns Hopkins University related to genomic features of response to immunotherapy. C.C. is the founder of CM Cherry Consulting. J.R.W. is the founder of Resphera Biosciences. K.N.S. has filed for patent protection on the MANAFEST technology (16/341,862), has received travel support/honoraria from Illumina, receives research funding from Bristol-Myers Squibb, Abbvie and Astra Zeneca, and owns founder’s equity in Clasp Therapeutics. V.E.V. is a founder of Delfi Diagnostics, serves on the board of directors and as a consultant for this organization, and owns Delfi Diagnostics stock, which is subject to certain restrictions under university policy. Additionally, Johns Hopkins University owns equity in Delfi Diagnostics. V.E.V. divested his equity in Personal Genome Diagnostics to LabCorp in February 2022. V.E.V. is an inventor on patent applications submitted by Johns Hopkins University related to cancer genomic analyses and cell-free DNA for cancer detection that have been licensed to one or more entities, including Delfi Diagnostics, LabCorp, Qiagen, Sysmex, Agios, Genzyme, Esoterix, Ventana and ManaT Bio. Under the terms of these license agreements, the university and inventors are entitled to fees and royalty distributions. V.E.V. is an advisor to Viron Therapeutics and Epitope; these arrangements have been reviewed and approved by the Johns Hopkins University in accordance with its conflict-of-interest policies. The other authors declare no competing interests.

Figures

Fig. 1
Fig. 1. Genomic and molecular features of differential responses to immunotherapy and radioimmunotherapy.
Participants are stratified by control versus SBRT arm and therapy response within each arm (CR + PR versus SD + PD); rows represent distinct features and columns represent individual participants. TMB correlated with radiographic response in the control arm (Mann–Whitney U-test, P = 0.023) but not the SBRT arm (Mann–Whitney U-test, P = 0.53). Similarly, PDL1 expression was associated with therapy response in the control arm (Mann–Whitney U-test, P = 0.00041), with a trend noted in the SBRT arm (Mann–Whitney U-test, P = 0.07). In line with the TMB findings, a mutational smoking signature was enriched in responding tumors in the control arm (Mann–Whitney U-test, P = 0.019) but not the SBRT arm (Mann–Whitney U-test, P = 0.12). Tumor aneuploidy (represented as the fraction of genome with allelic imbalance) was not correlated with response in the control or SBRT arms (Mann–Whitney U-test, P = 0.43 and P = 0.87, respectively). Key NSCLC driver genes are shown together with annotations for hotspot mutations. We did not identify a differential enrichment in the overall number or in oncogenic mutations in STK11, KRAS or TP53 by treatment arm; however, KRAS;TP53 comutations were enriched in responding tumors in the control arm. A total of 16 tumors harbored STK11 mutations, 13 of which are characterized as oncogenic in the literature (10 in the control arm and 3 in the SBRT arm). Of these 13 participants, there was 1 responding participant with an STK11-mutant tumor in the control arm and 1 responding participant with an STK11-mutant tumor in the SBRT arm (1/10, 10% versus 1/3, 33%; Fisher’s exact test, P = 0.42). Notably, we observed an enrichment of Wnt pathway mutations in participants with tumors responding to SBRT (OS > 12 months; Fisher’s exact test, P = 0.047). Source data
Fig. 2
Fig. 2. TME reshaping with radioimmunotherapy.
a, Bar plot of the most upregulated gene sets in on-therapy tumors by treatment arm as ranked by adjusted P values from GSEA. A number of inflammatory gene sets were differentially upregulated in on-therapy tumors in the SBRT arm (n = 14 samples) compared with the control arm (n = 12 samples), including interactions between lymphoid and nonlymphoid cells (FDR-adjusted P = 7.35 × 1035 in the SBRT arm and P = 3.16 × 1015 in the control arm), neutrophil degranulation (FDR-adjusted P = 1.46 × 1034 in the SBRT and P = 2.67 × 1011 in the control arm), IFNγ response (FDR-adjusted P = 1.03 × 1025 in the SBRT and P = 8.72 × 1017 in the control arm) and overall inflammatory response (FDR-adjusted P = 5.31 × 1017 in the SBRT arm and P = 4.58 × 109 in the control arm). A detailed description of all upregulated gene sets can be found in Supplementary Tables 9 and 10. b, Differentially downregulated gene sets in on-therapy tumors by treatment arm included cell-cycle targets of E2f transcription factors (FDR-adjusted P = 9.13 × 109 in the SBRT arm and P = 5.65 × 10−1 in the control arm) and genes regulated by Myc (FDR-adjusted P = 6.63 × 107 in the SBRT arm and P = 9.78 × 101 in the control arm). A detailed description of all downregulated gene sets can be found in Supplementary Tables 9 and 10. c, Heat map of GSEA results showing greater enrichment of immune programs from baseline to on therapy in the SBRT arm (n = 14 samples) compared with the control arm (n = 12 samples) across a broad range of immune gene sets. Each row represents a gene set; gene sets are grouped into ten categories shown in the legend. Enrichment scores were normalized by row to a maximum value of 1. d, Enrichment plot showing the leading edge of the IFNγ gene set, clearly upregulated on therapy in the SBRT arm (FDR-adjusted P = 1.03 × 1025). e, Enrichment plot showing the leading edge of the inflammatory response gene set, clearly upregulated on therapy in the SBRT arm (FDR-adjusted P = 5.31 × 1017). f, Investigation of differences in B cell density in SBRT responders, who showed a numerically greater BCR CDR3 count on therapy than at baseline (mean: 3.24 × 106 versus 2.45 × 105; Mann–Whitney U-test, P = 0.19). g, Bar plot of the gene sets most enriched on therapy in SBRT long-term survivors (OS ≥ 3 years) versus SBRT short-term survivors (OS < 3 years), including interactions between lymphoid and nonlymphoid cells (FDR-adjusted P = 1.09 × 1029), BCR signaling (FDR-adjusted P = 9.42 × 1016) and IFNγ response (FDR-adjusted P = 5.28 × 106). Extensive results can be found in Supplementary Table 15. h, Bar plot of the gene sets most downregulated on therapy in SBRT long-term survivors (OS ≥ 3 years) versus SBRT short-term survivors (OS < 3 years), including cell-cycle targets of E2f transcription factors (FDR-adjusted P = 3.64 × 1014), G2/M checkpoint progression (FDR-adjusted P = 1.61 × 1010), glycolysis (FDR-adjusted P = 1.20 × 108) and double-stranded DNA break repair (FDR-adjusted P = 1.95 × 105). Extensive results can be found in Supplementary Table 15. All statistical results are FDR-adjusted and two-sided P values. Box plots depict the median value and hinges correspond to the first and third quartiles. The whiskers extend from the corresponding hinge to the furthest value within 1.5× the interquartile range from the hinge. Dotted black horizontal lines indicate the FDR-adjusted P = 0.05. EMT, epithelial–mesenchymal transition; ID, immunodeficiency; Ag, antigen; iC, intracellular; RT, Reactome; HM, Hallmark; KG, Kegg. Source data
Fig. 3
Fig. 3. TME reshaping with radioimmunotherapy in immune cold tumors.
a, Bar plot of the 10 most upregulated gene sets from baseline to 3–6 weeks on therapy in TMB-low tumors in the SBRT (n = 12 samples) and control (n = 11 samples) arms, including neutrophil degranulation (FDR-adjusted P = 4.93 × 1030 in the SBRT arm and P = 1.58 × 109 in the control arm), IFNγ response (FDR-adjusted P = 1.69 × 1012 in the SBRT arm and P = 5.97 × 1012 in the control arm), chemokine signaling (FDR-adjusted P = 7.94 × 1011 in the SBRT arm and P = 9.79 × 106 in the control arm), overall inflammatory response (FDR-adjusted P = 1.12 × 109 in the SBRT arm and P = 2.68 × 107 in the control arm), and antigen processing and presentation (FDR-adjusted P = 5.40 × 108 in the SBRT arm and P = 1.92 × 105 in the control arm). Extensive findings can be found in Supplementary Table 16. b, Bar plot of the 10 most upregulated gene sets from baseline to 3–6 weeks on therapy in PDL1-null tumors in the SBRT (n = 9 samples) and control (n = 9 samples) arms, including IFNγ response (FDR-adjusted P = 3.94 × 1034 in the SBRT arm and P = 5.52 × 106 in the control arm), IFNα response (FDR-adjusted P = 1.29 × 1017 in the SBRT arm and P = 1.08 × 102 in the control arm), NK cell cytotoxicity (FDR-adjusted P = 3.28 × 1016 in the SBRT arm and P = 6.43 × 106 in the control arm), BCR signaling (FDR-adjusted P = 6.47 × 1015 in the SBRT arm and P = 0.84 in the control arm), and antigen processing and presentation (FDR-adjusted P = 1.15 × 1014 in the SBRT arm and P = 3.73 × 105 in the control arm). Extensive findings can be found in Supplementary Table 16. ce, Heat map of GSEAs showing the most upregulated immune gene sets from baseline to 3–6 weeks on therapy in TMB-high tumors in the SBRT arm (n = 4 samples), TMB-low tumors in the SBRT arm (n = 11 samples) and TMB-low tumors in the control arm (n = 10 samples) (c), in PDL1-positive tumors in the SBRT arm (n = 6 samples), PDL1-null tumors in the SBRT arm (n = 8 samples), PDL1-positive tumors in the control arm (n = 4 samples) and PDL1-null tumors in the control arm (n = 8 samples) (d), and in Wnt wild-type tumors in the SBRT arm (n = 12 samples), Wnt-mutated tumors in the SBRT arm (n = 2 samples) and Wnt wild-type tumors in the control arm (n = 10 samples) (e). Each row represents a gene set; gene sets are grouped into nine categories shown in the legend. Enrichment scores were normalized by row to a maximum value of 1. For every cohort stratification (TMB-high versus TMB-low, PDL1-positive versus PDL1-null and Wnt-mutated versus Wnt wild-type tumors), we observed greater enrichment of immune gene sets in the SBRT arm than the control arm across a broad range of immune gene sets. f, Enrichment plot of the IFNγ gene set in on-therapy tumors with low TMB in the SBRT arm (n = 12 samples; FDR-adjusted P = 1.69 × 1012). g, Enrichment plot of the IFNγ gene set in on-therapy PDL1-null tumors in the SBRT arm (n = 9 samples; FDR-adjusted P = 3.94 × 1034). h, Enrichment plot of the IFNγ gene set in on-therapy Wnt-mutated tumors in the SBRT arm (n = 5 samples) from baseline to 3–6 weeks on therapy (FDR-adjusted P = 4.78 × 1013). All statistical results are two-sided P values. Dotted black horizontal lines indicate FDR-adjusted P = 0.05. Source data
Fig. 4
Fig. 4. Differential outcomes and abscopal site tumor regression with radioimmunotherapy for participants with TMB-low, PDL1-null and Wnt-mutated tumors.
a, Swimmer’s plot showing OS and clinical and pathological features for each participant in the control (left) and SBRT (right) arms. Participants with TMB-low, PDL1-null or Wnt-mutated tumors were observed to attain the longest clinical outcomes in the SBRT arm. NA, not applicable. b, The abscopal (biopsied) tumor sites in the SBRT arm had a notable decrease in RECIST measurements between 0 and 12 weeks (mean: 45.52 mm to 30.44 mm; Mann–Whitney U-test, P = 0.054), whereas rebiopsied tumor sites showed no change in RECIST measurements in the control arm (Mann–Whitney U-test, P = 0.64). Extensive findings can be found in Supplementary Table 21. c, In TMB-low and PDL1-null participants, we observed a notable regression in RECIST measurements of the biopsied abscopal site in the SBRT arm (TMB-low mean: 47.93 mm to 30.44 mm, Mann–Whitney U-test, P = 0.13; PDL1-null mean: 50.78 mm to 32 mm; Mann–Whitney U-test, P = 0.29), which was not evident in the control arm. Interestingly, the SBRT-associated abscopal site tumor regression was not as pronounced in TMB-high and PDL1-positive tumors; these had similar regressions in the SBRT and control arms. Extensive findings can be found in Supplementary Table 21. d, Kaplan–Meier curve of probability of PFS in TMB-low participants (n = 43 participants) treated in the control arm (n = 21 participants) and SBRT arm (n = 22 participants). TMB-low participants had longer PFS in the SBRT arm than in the control arm (median PFS: 5.21 versus 1.81 months; log-rank test, P = 0.029). e, Kaplan–Meier curve of probability of PFS in PDL1-null participants (n = 41 participants) treated in the control arm (n = 23 participants) and SBRT arm (n = 18 participants). PDL1-null participants had longer PFS in the SBRT arm than in the control arm (median PFS: 4.22 versus 1.71 months; log-rank test, P = 0.022). f, Kaplan–Meier curve of probability of PFS in the SBRT arm (n = 28 participants) in the Wnt-mutated (n = 5 participants) and Wnt wild-type (n = 23 participants) groups. In the SBRT arm, participants with Wnt-mutated tumors had longer PFS compared with the wild-type subgroup (median PFS: not reached versus 5.45 months; log-rank test, P = 0.02). Box plots depict the median value and hinges correspond to the first and third quartiles. The whiskers extend from the corresponding hinge to the furthest value within 1.5× the interquartile range from the hinge. Source data
Fig. 5
Fig. 5. TCR clonotypic reshaping with radioimmunotherapy and longitudinal monitoring of the peripheral blood and intratumoral repertoire during therapy and at the time of acquired resistance.
a, Counts of clonotypes expanded on therapy that were not observed at baseline in the blood and/or tumor compartments. There were significantly more newly expanded clones in blood alone and in tumor alone, with a trend of more newly expanded clones in both compartments (SBRT arm, n = 18 samples versus control arm, n = 13 samples; blood mean: 4.56 versus 1.00; Wald test (two-sided), P = 0.039; tumor mean: 16.17 versus 7.54; Wald test (two-sided), P = 0.022; both compartments mean: 1.00 versus 0; Wald test (two-sided), P = 0.098) in the SBRT cohort than control cohort. b, Counts of all clonotypes expanded on therapy relative to baseline in the blood and/or tumor compartments. There were significantly more expanded clones in all compartments in the SBRT cohort than control cohort (SBRT, n = 18 samples versus control arm, n = 13 samples; blood mean: 21.61 versus 8.15; Wald test (two-sided), P = 0.030; tumor mean: 34.83 versus 18.69; Wald test (two-sided), P = 0.025; both compartments mean: 2.61 versus 0.54; Wald test (two-sided), P = 0.045). c, Counts of new clonotypes expanded on therapy within the SBRT arm, stratified by TMB status. Counts of newly expanded clones were not significantly different between TMB-low (n = 13 samples) and TMB-high (n = 4 samples) tumors in the SBRT arm in either compartment (blood: Mann–Whitney U-test (two-sided), P = 0.95; tumor: Mann–Whitney U-test (two-sided), P = 0.95; both compartments: Mann–Whitney U-test (two-sided), P = 0.44). d, Counts of new clonotypes expanded on therapy within the SBRT arm, stratified by PDL1 status. Counts of newly expanded clones were not significantly different between PDL1-null (n = 9 samples) and PDL1-positive (n = 9 samples) tumors in the SBRT arm in either compartment (blood: Mann–Whitney U-test (two-sided), P = 0.075; tumor: Mann–Whitney U-test (two-sided), P = 0.17; both compartments: Mann–Whitney U-test (two-sided), P = 0.46). e,f, TCR dynamics of newly expanded TCR clones in blood (e) and tumor (f) compartments for a participant with low TMB (0.9 mutations per Mb) and PDL1-null expression (0% on IHC) who exhibited PR in the SBRT cohort. Participant 727 had 14 total and 6 new clones expanded in the tumor and 34 total and 29 new clones expanded in the blood following SBRT and 2 cycles of pembrolizumab (Mann–Whitney U-test, two-sided). g, Clonotype dynamics at the time of resistance for clones that expanded on therapy in three PR tumors: two in the SBRT (participants 680 and 690) and one in the control arm (participant 743). Approximately 39% (12/31) of the clonotypes that expanded in blood and 4% (2/51) that expanded in the tumor on treatment across the 3 participants showed sustained increase at the time of resistance. At the participant level, most clones that expanded on treatment showed no sustained increase at the time of resistance (93% (13/14), 86% (12/14) and 77% (43/56) for the 3 participants). h, Expansion dynamics of all T cell clones that expanded in the tumor on treatment for participant 680 (PR in SBRT cohort; Mann–Whitney U-test, two-sided). Most clones did not show sustained increase at the resistance time point. Box plots depict the median value and hinges correspond to the first and third quartiles. The whiskers extend from the corresponding hinge to the furthest value within 1.5× the interquartile range from the hinge. Source data
Fig. 6
Fig. 6. Neoantigen-reactive T cell responses in participants with long-term survival after radioimmunotherapy.
We assessed neoantigen-specific T cell responses in three participants who attained radiographic response and long-term OS benefit in the SBRT arm. a, For participant CGLU680 who attained PR and an OS of 104 months, 10 neoantigen-reactive TCRs were detected specific to 8 MANAs across 4 time points (colored bars). Neopeptide sequences are listed on the horizontal axis with mutated genes in parentheses. TCR CDR3 amino acid sequences are listed along the depth axis with the time point of significant expansion prepended to each TCR sequence. Opaque dark-gray columns represent a significant expansion of T cell clones in response to the positive control peptide, while colored columns represent a significant expansion of T cell clones in response to cancer neopeptides. Opaque light-gray columns represent a nonsignificant expansion of T cell clones in response to mutation-associated neopeptides. Translucent gray columns represent nonspecific clonotypic T cell expansions. b, For participant CGLU727 who attained PR and an OS of 46 months in the SBRT arm, the RHNO1 MANA-reactive TCR clone CASSIPGEGYTF was detected expanding at cycle 2. The TCR sequence is highlighted in red in the volcano plot, with the mutated gene in parentheses. c, For participant CGLU690 who attained PR with an OS of 102 months in the SBRT arm, the BDH1 MANA-reactive TCR clone CASSLWAGGGSREQFF was detected expanding at cycle 2. The TCR sequence is highlighted in green in the volcano plot, with the mutated gene in parentheses. C2, cycle 2 day 1; C3, cycle 3 day 1; C4, cycle 4 day 1; C3/C4, pooled PBMCs from cycle 3 day 1 and cycle 4 day 1. Source data
Extended Data Fig. 1
Extended Data Fig. 1. Tumor aneuploidy shows variable correlation with response in patients in the SBRT arm depending on the aneuploidy metric used.
(a) Copy number ratios and aneuploidy scores across all patients. There was no significant difference between responders and non-responders in the SBRT cohort for any of the seven metrics (ploidy SBRT responders mean = 2.82, SBRT non-responders mean = 2.72, Mann-Whitney U test two-sided P = 0.68; entropy SBRT responders mean = 1.50, SBRT non-responders mean = 1.74, Mann-Whitney U test two-sided P = 0.52; non modal fraction SBRT responders mean = 0.45, SBRT non-responders mean = 0.48, Mann-Whitney U test two-sided P = 0.87; loss of heterozygosity fraction SBRT responders mean = 0.28, SBRT non-responders mean = 0.30, Mann-Whitney U test two-sided P = 0.79; genomic imbalance fraction SBRT responders mean = 0.56, SBRT non-responders mean = 0.58, Mann-Whitney U test two-sided P = 0.83; nondiploid fraction SBRT responders mean = 0.53, SBRT non-responders mean = 0.53, Mann-Whitney U test two-sided P = 0.87; ASCETS score SBRT responders mean = 0.41, SBRT non-responders mean = 0.49, Mann-Whitney U test two-sided P = 0.38) (b) Comparison of ASCETS score between responders (CR or PR) and non-responders (SD or PD) in each therapy arm. There was no difference in ASCETS score between response groups in either arm (SBRT results reported under (a); control responders mean = 0.40, control non-responders mean = 0.45, Mann-Whitney U test two-sided P = 0.69). Box plots depict the median value and hinges correspond to the first and third quartiles. The whiskers extend from the corresponding hinge to the furthest value within 1.5* the interquartile range from the hinge. (c) Kaplan-Meier analyses for PFS in SBRT patients with whole exome sequencing data (n = 28 patients) who were classified according to the Spurr et al. paper as high aneuploidy (ASCETS > = 0.42, n = 16 patients) versus low aneuploidy (ASCETS < 0.42, n = 12 patients) showed a numerically shorter PFS for patients with highly aneuploid tumors (median PFS high aneuploidy 4.39 months vs low aneuploidy 15.56 months, log-rank P = 0.29). (d) Kaplan-Meier analyses for OS in SBRT patients with whole exome sequencing data (n = 28 patients) who were classified according to the Spurr et al. paper as high aneuploidy (ASCETS > = 0.42, n = 16 patients) versus low aneuploidy (ASCETS < 0.42, n = 12 patients) revealed a numerically shorter OS in the high aneuploidy group which was statistically insignificant (median OS high aneuploidy 9.89 months vs low aneuploidy 40.50 months, log-rank P = 0.13). Source data
Extended Data Fig. 2
Extended Data Fig. 2. Patients with STK11 mutated tumors in the SBRT and control arms show no difference in upregulation of immune programs or T cell expansion.
(a) We did not observe significant upregulation of immune response related gene sets in on-therapy tumors among patients with STK11 mutations in the SBRT arm (n = 5 samples) versus the control arm (n = 5 samples). (b) Among patients with STK11 mutations, cellular proliferation and cell cycle progression gene sets were significantly more downregulated in on-therapy tumors in the SBRT (n = 5 samples) compared to the control arm (n = 5 samples; E2f targets, GSEA (two-sided) FDR-adjusted P = 1.62e-10, NES = −2.33; g2m checkpoint, GSEA (two-sided) FDR-adjusted P = 6.14e-7, NES = −2.07). (c, d) There were no significant differences in T cell expansion between patients with STK11 mutations in the SBRT (n = 4 samples) and control (n = 5 samples) arms for all clones (c) or only newly expanded clones (d) (Mann-Whitney U test, two-sided). While limited by the small number of STK11-mutant tumors per arm, these findings do not support an enhancement of anti-tumor immune responses in the SBRT arm compared to the control arm for tumors harboring STK11 mutations. Box plots depict the median value and hinges correspond to the first and third quartiles. The whiskers extend from the corresponding hinge to the furthest value within 1.5* the interquartile range from the hinge. Source data
Extended Data Fig. 3
Extended Data Fig. 3. Differences in absolute abundance of immune cell subsets derived from RNAseq deconvolution from baseline to on-therapy in the SBRT and control groups.
(av) A significantly greater abundance of CD8 T cells (mean SBRT baseline 0.244, mean SBRT on-therapy 0.765, Mann Whitney-U test (two-sided) P = 0.027) and M1 macrophages (mean SBRT baseline 0.099, mean SBRT on-therapy 0.292, Mann Whitney-U test (two-sided) P = 0.013) were noted on-therapy in the SBRT arm. We also observed a trend towards a higher abundance of activated CD4 memory T cells (mean SBRT baseline 0.008, mean SBRT on-therapy 0.083, Mann Whitney-U test (two-sided) P = 0.074) and activated NK cells (mean SBRT baseline 0.134, mean SBRT on-therapy 0.361, Mann Whitney-U test (two-sided) P = 0.090) on-therapy compared to baseline in the SBRT arm. These differences were less pronounced in the control arm (CD8 T cells mean control baseline 0.320, mean control on-therapy 0.525, Mann Whitney-U test (two-sided) P = 0.248; activated CD4 memory T cells mean control baseline 0.010, mean control on-therapy 0.087, Mann Whitney-U test (two-sided) P = 0.732; activated NK cells mean control baseline 0.156, mean control on-therapy 0.259, Mann Whitney-U test (two-sided) P = 0.222; M1 macrophages mean control baseline 0.135, mean control on-therapy 0.275, Mann Whitney-U test (two-sided) P = 0.121). A trend towards a higher abundance of M2 macrophages in on-therapy compared to baseline samples was noted in the control group, while such a difference was not noted in the SBRT group (mean control baseline 0.506, mean control on-therapy 0.883, Mann Whitney-U test (two-sided) P = 0.069; mean SBRT baseline 0.562, mean SBRT on-therapy 0.943, Mann Whitney-U test (two-sided) P = 0.274). Absolute abundance values and statistics related to all other cell types determined by RNA-seq deconvolution are listed in Supplementary Table 12. Sample sizes for all panels are: SBRT Baseline n = 14 samples, SBRT on-therapy n = 12 samples, control baseline n = 12 samples, control on-therapy n = 10 samples. Box plots depict the median value and hinges correspond to the first and third quartiles. The whiskers extend from the corresponding hinge to the furthest value within 1.5* the interquartile range from the hinge. Source data
Extended Data Fig. 4
Extended Data Fig. 4. B cell expansion is associated with improved response, with notably greater expansion observed in a subset of patients in the SBRT arm.
(a) B cell CDR3 count at baseline was similar between responders and non-responders (mean 3.39e5 non-responders, 2.03e5 responders, Mann-Whitney U test (two-sided) P = 0.395), but significantly greater on-therapy in responders (mean 0.429e6 non-responders, 2.65e6 responders, Mann-Whitney U test (two-sided) P = 0.015). Non-responding tumors showed no difference in BCR CDR3 count between baseline and on-therapy samples in the control [mean 3.30e5 vs 1.63e5, Mann-Whitney U test (two-sided) P = 0.97] or SBRT arms [mean 3.46e5 vs 7.28e5, Mann-Whitney U test (two-sided) P = 0.74]. Box plots depict the median value and hinges correspond to the first and third quartiles. The whiskers extend from the corresponding hinge to the furthest value within 1.5* the interquartile range from the hinge. (b) B cell CDR3 count on-therapy for each patient with RNAseq data available, with 3 patients in the SBRT arm (CGLU737, CGLU745, CGLU680) demonstrating notably greater B cell count on-therapy than any patient in the control arm. Of note, although CGLU745 is a radiographic non-responder (stable disease), this patient also experienced a durable response (durable clinical benefit, PFS 7.6 months, OS 35 months, compared to average PFS of 3.8 months and OS of 10.6 months among non-responders). Source data
Extended Data Fig. 5
Extended Data Fig. 5. Tertiary Lymphoid Structure (TLS) gene set enrichment analysis from baseline to on-therapy in immunologically cold tumors.
(a) The TLS gene set was upregulated on-therapy in PDL-1 null tumors in the SBRT arm (GSEA (two-sided) FDR-adjusted P = 0.02). (b) GSEA analyses did not reveal an enrichment of the TLS gene set in PDL-1 null tumors in the control arm (GSEA (two-sided) FDR-adjusted P = 0.45). (c) Similarly, the TLS gene set was significantly upregulated on-therapy in WNT-mutated tumors in the SBRT arm (GSEA (two-sided) FDR-adjusted P = 0.002). Source data
Extended Data Fig. 6
Extended Data Fig. 6. Comparison of biopsy lesion diameter between baseline and 12 weeks on therapy.
(a) Among PD-L1 null patients, there was a numerical reduction in biopsy lesion diameter from baseline to on-therapy in SBRT patients, but a numerical increase in diameter in control patients (PD-L1 null SBRT mean diameter at baseline 50.78 mm, mean diameter on therapy 32 mm, Mann-Whitney U test (two-sided) P = 0.29; PD-L1 null control mean diameter at baseline 50.31 mm, mean diameter on therapy 60.7 mm, Mann-Whitney U test (two-sided) P = 0.49). Numerical reductions were observed in biopsy lesion diameter between baseline and 12 weeks on therapy for PD-L1 positive patients in both treatment arms (PD-L1 positive control mean diameter at baseline 42.33, mean diameter on therapy 28.63, Mann-Whitney U test (two-sided) P = 0.11; PD-L1 positive SBRT mean diameter at baseline 42.14 mm, mean diameter on therapy 29.73 mm, Mann-Whitney U test (two-sided) P = 0.15). (b) Both SBRT and control patients with Wnt-mutated tumors show numerical reductions in biopsy lesion diameters from baseline to on-therapy (Wnt-mutated SBRT mean diameter at baseline 43.2 mm, mean diameter on therapy 27.8, Mann-Whitney U test (two-sided) P = 0.42; Wnt-mutated control mean diameter at baseline 57.8 mm, mean diameter on therapy 44 mm, Mann-Whitney U test (two-sided) P = 0.73). No notable changes are observed for patients with Wnt-wild type tumors in either treatment arm (Wnt-wild type SBRT mean diameter at baseline 46.6 mm, mean diameter on therapy 36.44 mm, Mann-Whitney U test (two-sided) P = 0.36; Wnt-wild type control mean diameter at baseline 45.47, mean diameter on therapy 51.31, Mann-Whitney U test (two-sided) P = 0.72). Box plots depict the median value and hinges correspond to the first and third quartiles. The whiskers extend from the corresponding hinge to the furthest value within 1.5* the interquartile range from the hinge. Green denotes the baseline timepoint, while the on-therapy timepoint is shown in orange. Source data
Extended Data Fig. 7
Extended Data Fig. 7. Survival outcomes with radio-immunotherapy for patients with TMB-high, PD-L1-positive (immunohistochemistry (IHC) staining >=1%), PD-L1 low (IHC staining 1-49%) and PD-L1 high (IHC staining >=50%) tumors by treatment arm and for patients with Wnt-mutant tumors in the control arm.
(a) Kaplan–Meier analyses for PFS in TMB-high tumors (n = 15 patients) in the control arm (n = 9 patients) and SBRT arm (n = 6 patients) did not reveal significant differences between patients in the SBRT versus control arms (median PFS 22.05 months vs 9.16 months, log-rank P = 0.36). (b) Kaplan–Meier analyses for PFS in PD-L1 positive tumors (n = 29 patients) in the control arm (n = 12 patients) and SBRT arm (n = 17 patients) did not demonstrate significant differences (median PFS 14.62 vs 7.79 months, log-rank P = 0.68). (c) Kaplan–Meier analyses for PFS in PD-L1 low tumors (n = 14 patients) in the control arm (n = 7 patients) and SBRT arm (n = 7 patients) did not reveal significant differences between patients in the SBRT versus control arms (median PFS SBRT arm 7.56 months, control arm 6.90 months, log-rank P = 0.81). (d) Kaplan–Meier analyses for PFS in PD-L1 high tumors (n = 15 patients) in the control arm (n = 5 patients) and SBRT arm (n = 10 patients) did not reveal significant differences between patients in the SBRT versus control arms (median PFS SBRT arm 16.8 months, control arm median not reached, log-rank P = 0.55). (e) Kaplan–Meier analyses for PFS by Wnt-mutation status in the control arm (n = 30 patients) did not reveal significant differences between patients with Wnt-mutated (n = 5 patients) versus Wnt-not mutated tumors (n = 25 patients; log-rank P = 0.17). PFS: Progression Free Survival. Source data
Extended Data Fig. 8
Extended Data Fig. 8. Overall survival outcomes for patients with tumors that are TMB-low, PD-L1-null, or harboring mutations in the Wnt pathway.
(a) Kaplan–Meier curve of probability of OS in PD-L1 null patients (n = 41 patients) treated in the control arm (n = 23 patients) and SBRT arm (n = 18 patients). PD-L1 null patients have a trend of longer OS in the SBRT arm than in the control arm (median OS SBRT arm 7.21 months, control arm 6.05 months, log-rank P = 0.084). (b) Kaplan–Meier curve of probability of OS in TMB low patients (n = 43 patients) treated in the control arm (n = 21 patients) and SBRT arm (n = 22 patients). TMB low patients have numerically longer OS in the SBRT arm than patients in the control arm, though the difference is statistically insignificant (median OS SBRT arm 9.89 months, control arm 6.70 months, log-rank P = 0.16) (c) Kaplan–Meier curve of probability of OS in the SBRT arm in Wnt Mutated patients (n = 5 patients) and non-Wnt Mutated patients (n = 23 patients). Among patients in the SBRT arm, Wnt-mutated patients have longer OS than non-Wnt mutated patients (median OS Wnt mutated not reached, Wnt-wild type 9.92 months, log-rank P = 0.013). OS: overall survival. Source data
Extended Data Fig. 9
Extended Data Fig. 9. Expansion dynamics of TCR clones that significantly expanded from baseline to on therapy in a partial responder in the SBRT cohort harboring a tumor with low TMB and null PD-L1 expression.
Patient 727 had 6 new clones with significant baseline-to-on-therapy expansion in tumor, 19 new clones expanded in blood, and 2 new clones expanded in both compartments. This patient’s TMB and PD-L1 statuses suggest they likely would not respond to ICI monotherapy. Thus, patient 727, who achieved partial response in the SBRT cohort, may represent a group of patients who could benefit most from SBRT-pembrolizumab dual therapy. Source data
Extended Data Fig. 10
Extended Data Fig. 10. Expansion dynamics of TCR clones from baseline to on-therapy to time of resistance in 2 partial responders in the SBRT arm and 1 partial responder in the control arm who developed resistance to treatment.
Patients 680 and 690 were in the SBRT cohort, while patient 743 was in the control arm. All clones that significantly expanded from baseline to on therapy samples are visualized, stratified by location of on-therapy expansion (tumor vs blood, columns), then by expansion status at time of resistance relative to baseline abundances (no sustained increase vs sustained increase in tumor vs sustained increase in blood, rows). Most clones that expanded on treatment in SBRT patients showed no sustained expansion at time of acquired resistance (7% sustained intra-tumoral TCR expansion, 14% sustained blood TCR expansion). Similar patterns were noted for the patient in the control arm regarding intra-tumoral TCR clones, though notably more clones remained expanded in the blood compartment at time of resistance (3% sustained intra-tumoral TCR expansion, 63% sustained blood TCR expansion). Source data

References

    1. Demaria, S., Golden, E. B. & Formenti, S. C. Role of local radiation therapy in cancer immunotherapy. JAMA Oncol.1, 1325–1332 (2015). - PubMed
    1. Kroemer, G., Galassi, C., Zitvogel, L. & Galluzzi, L. Immunogenic cell stress and death. Nat. Immunol.23, 487–500 (2022). - PubMed
    1. McLaughlin, M. et al. Inflammatory microenvironment remodelling by tumour cells after radiotherapy. Nat. Rev. Cancer20, 203–217 (2020). - PubMed
    1. Formenti, S. C. & Demaria, S. Systemic effects of local radiotherapy. Lancet Oncol.10, 718–726 (2009). - PMC - PubMed
    1. Rodriguez-Ruiz, M. E. et al. Abscopal effects of radiotherapy are enhanced by combined immunostimulatory mAbs and are dependent on CD8 T cells and crosspriming. Cancer Res.76, 5994–6005 (2016). - PubMed

Publication types

MeSH terms

Substances