. 2025 Jul 22:10.1038/s41587-025-02734-5.
doi: 10.1038/s41587-025-02734-5. Online ahead of print.

Combined single-cell profiling of chromatin-transcriptome and splicing across brain cell types, regions and disease state

Affiliations

Combined single-cell profiling of chromatin-transcriptome and splicing across brain cell types, regions and disease state

Wen Hu et al. Nat Biotechnol. .

Abstract

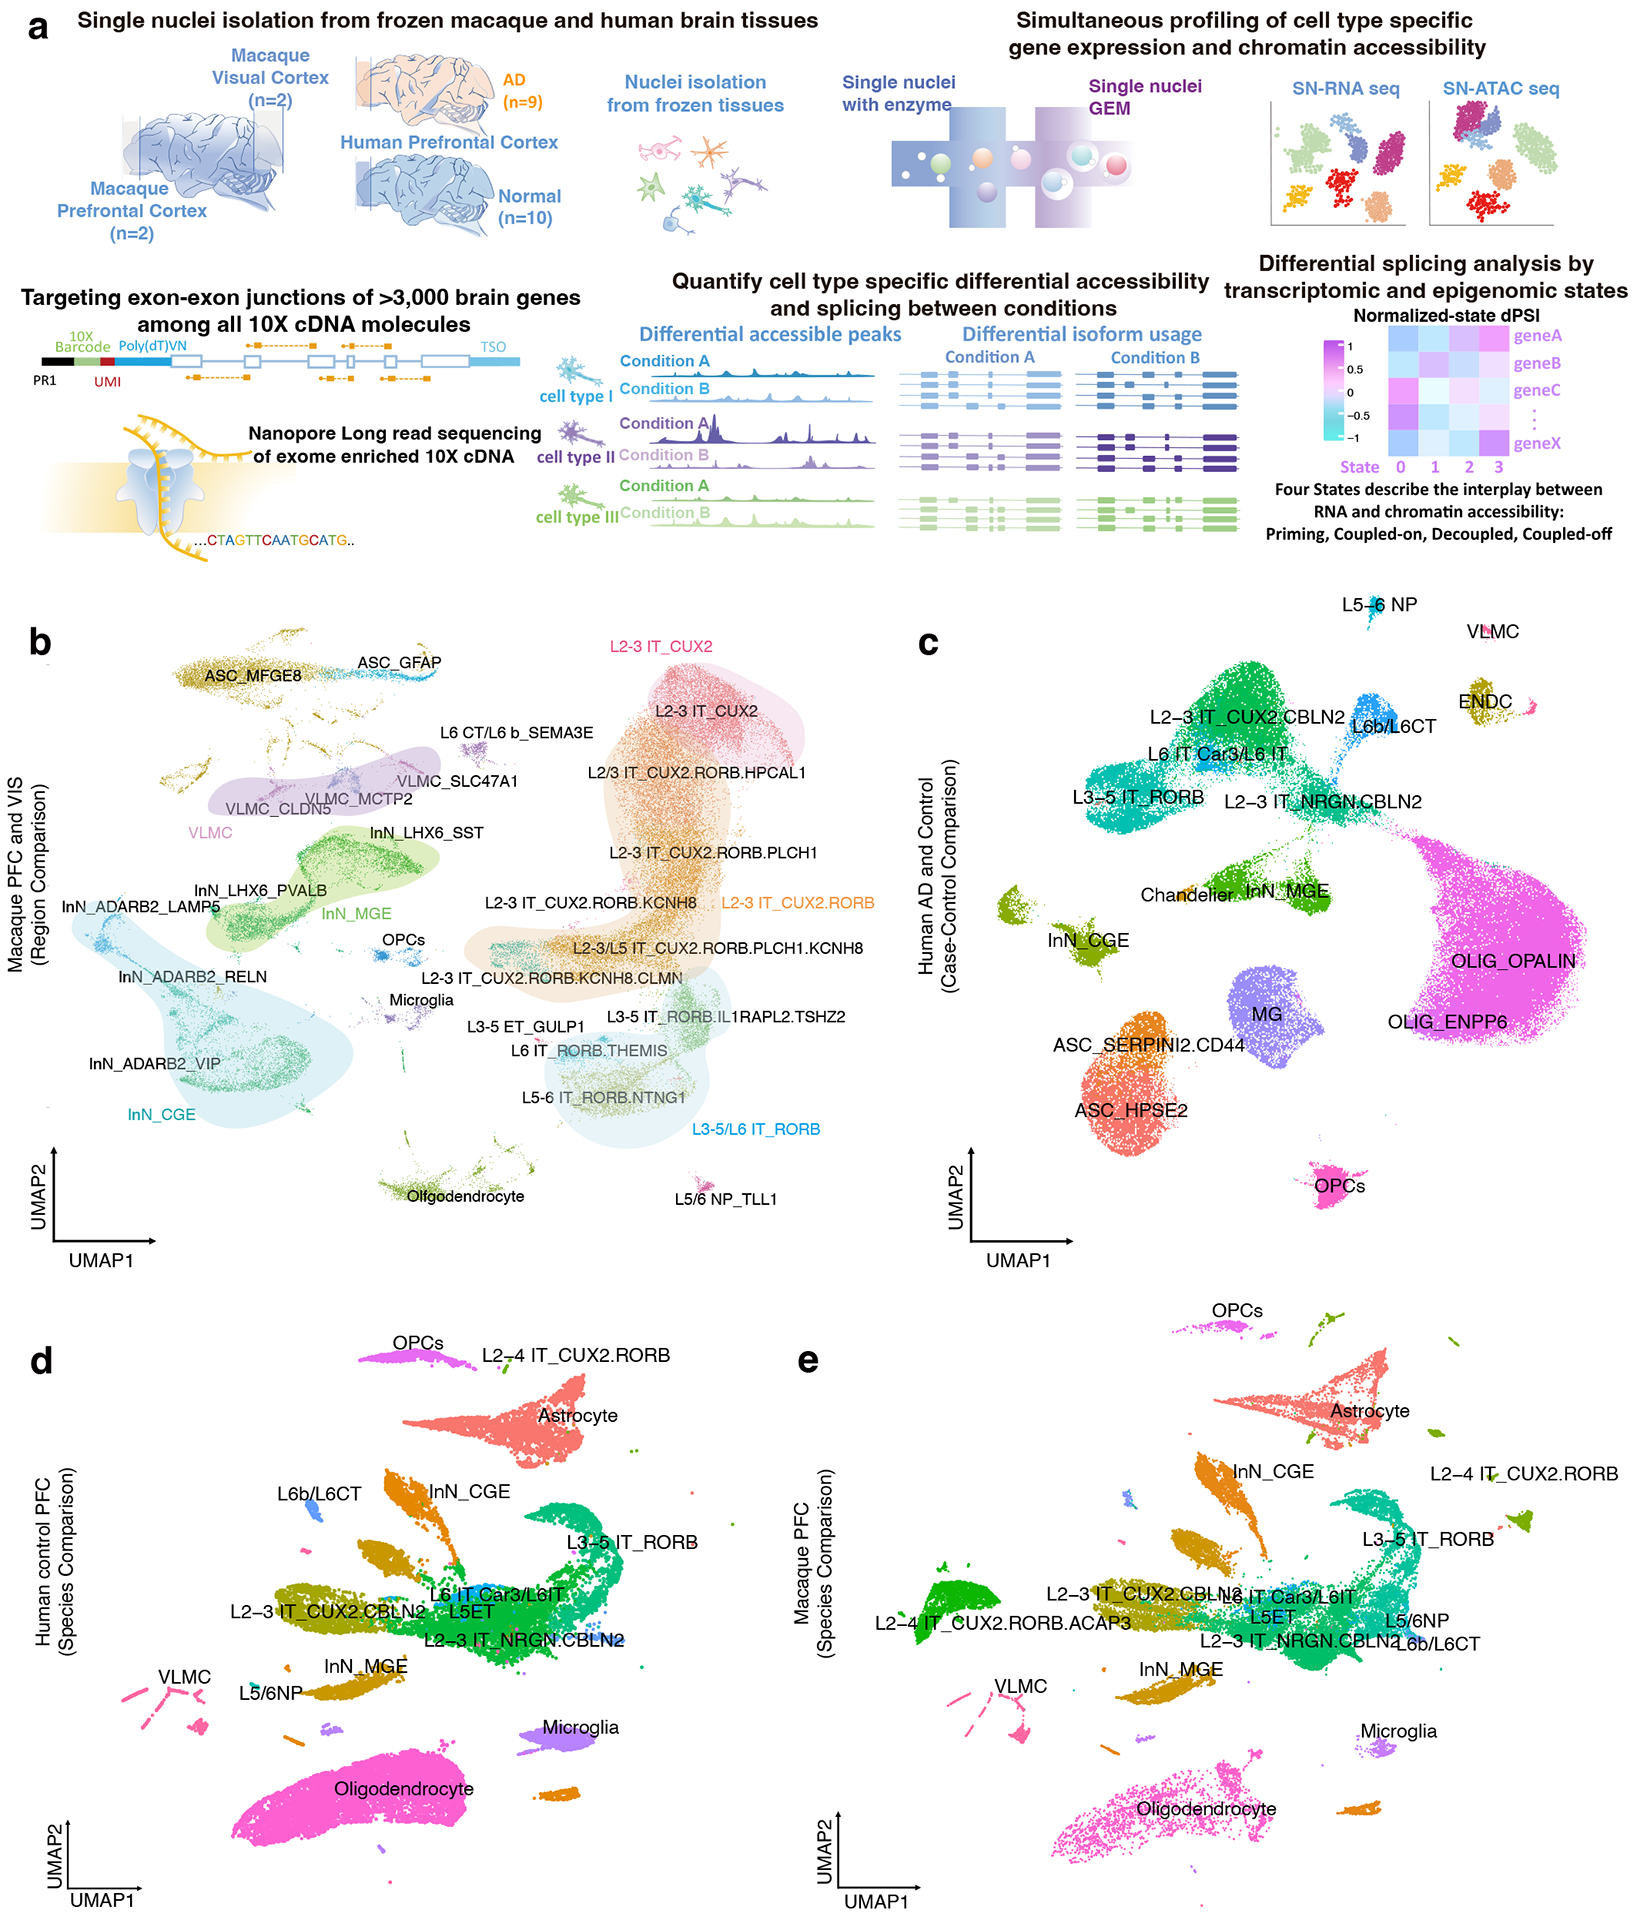
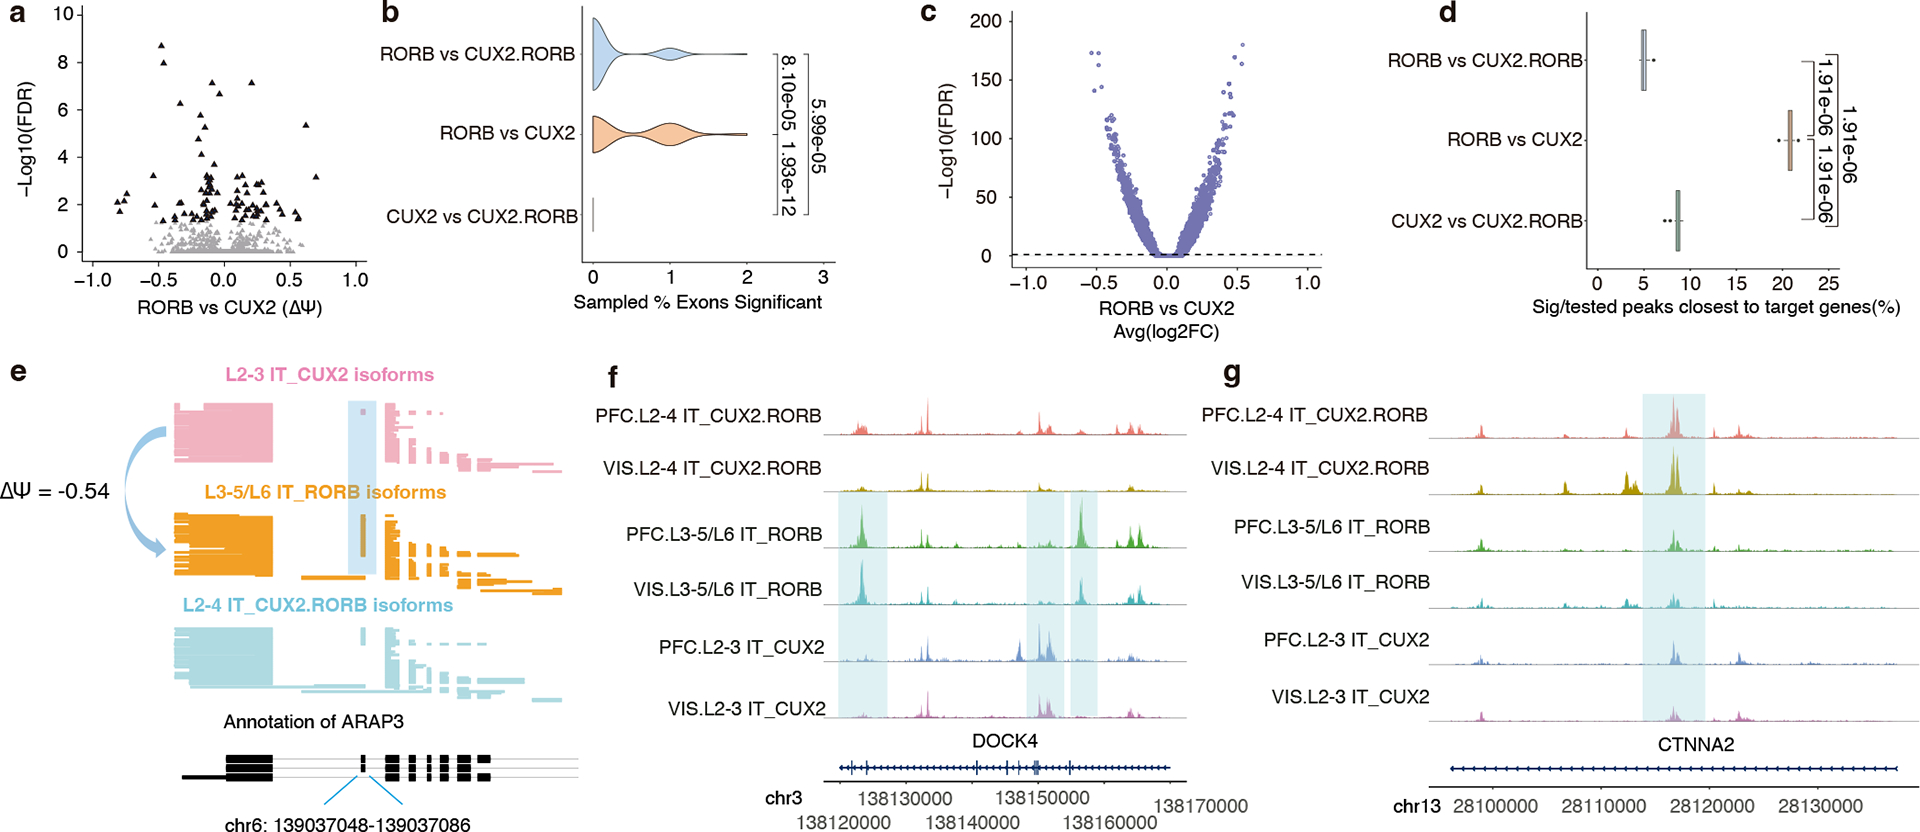
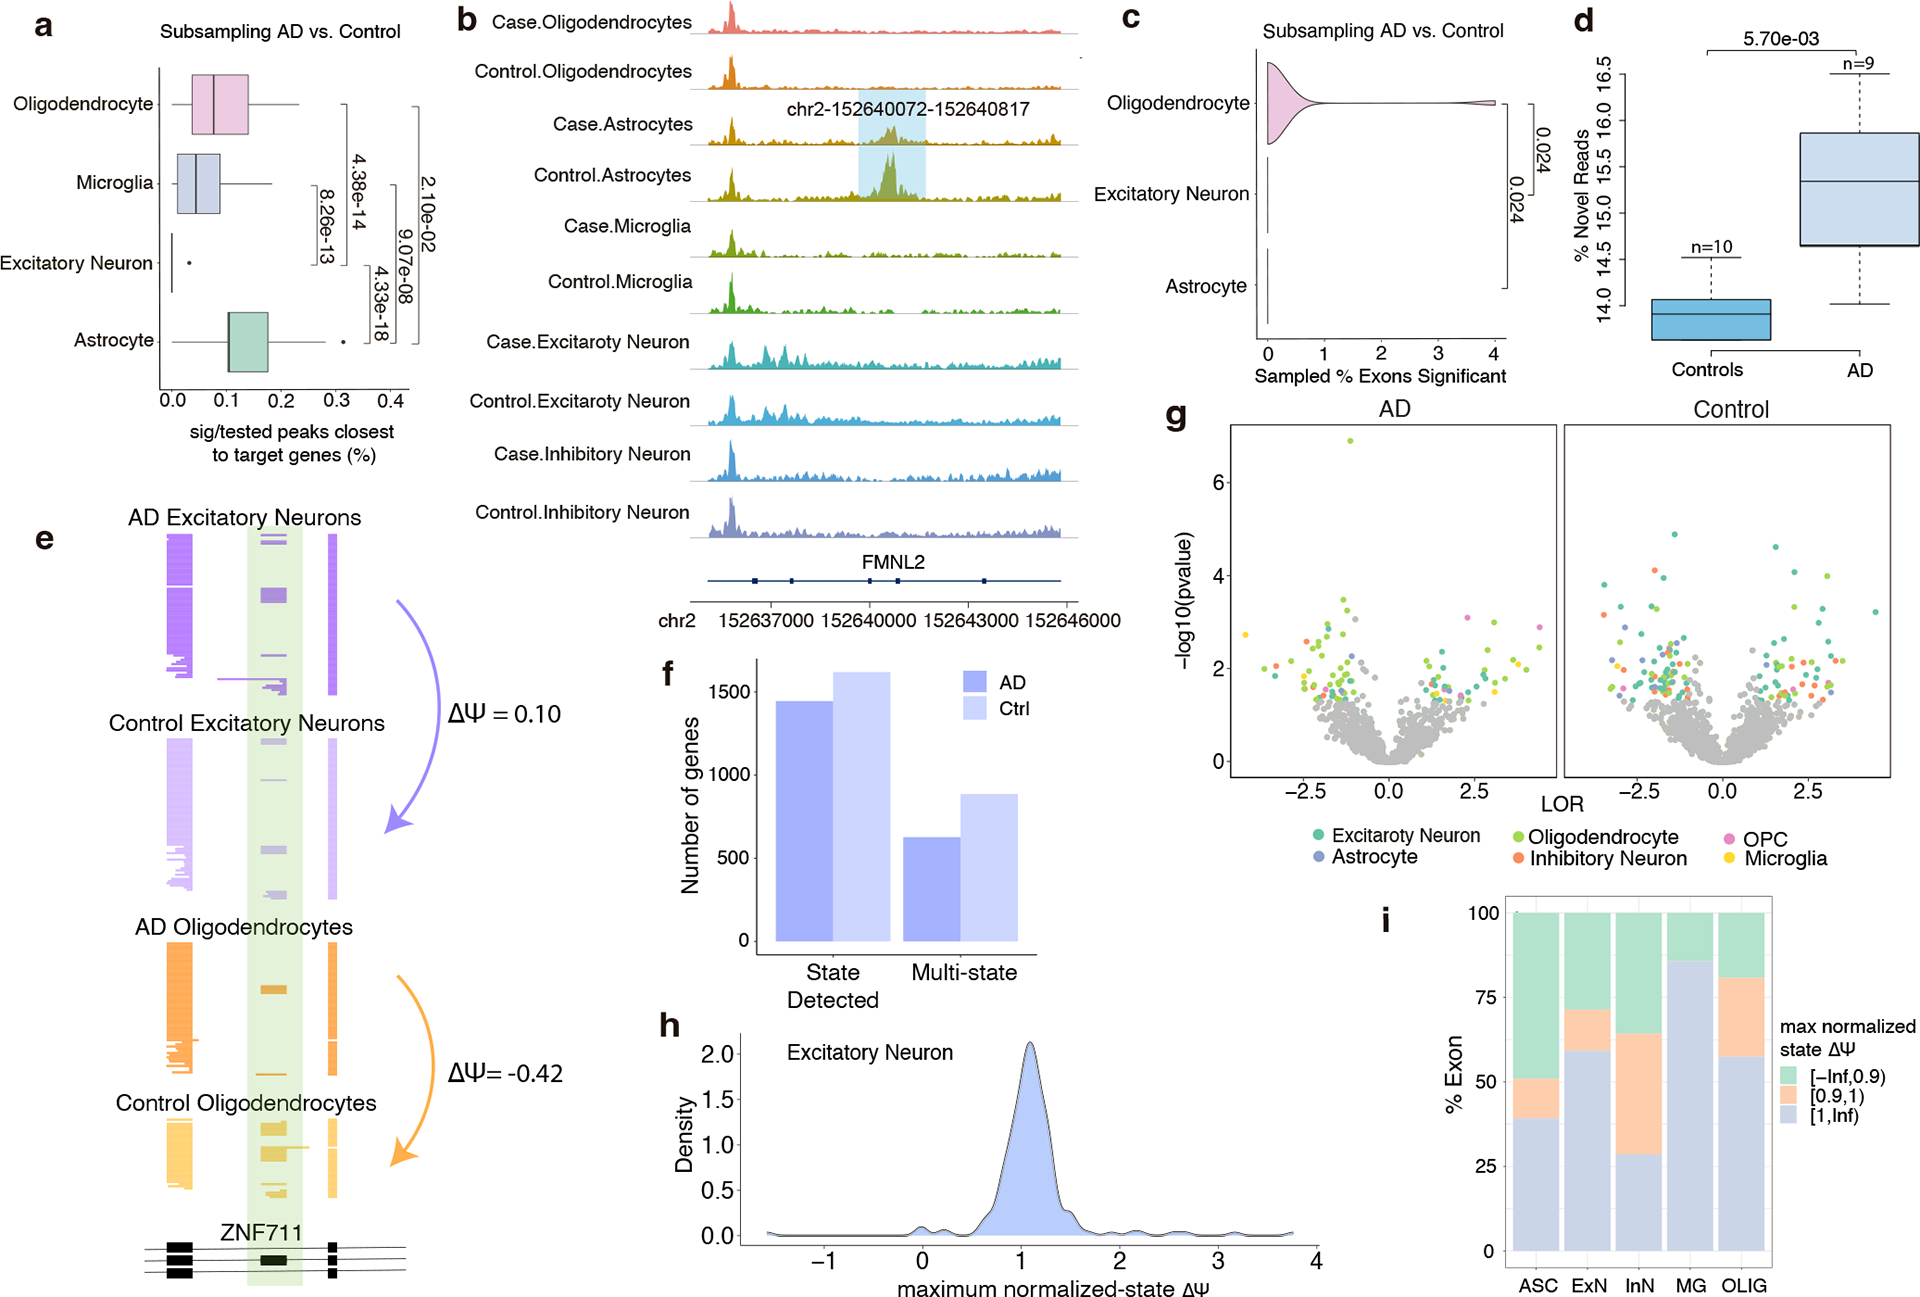
Measuring splicing and chromatin accessibility simultaneously in frozen tissues remains challenging. Here we combined single-cell isoform RNA sequencing and assay for transposase accessible chromatin (ScISOr-ATAC) to interrogate the correlation between these modalities in single cells in human and rhesus macaque frozen cortical tissue samples. Applying a previous definition of four 'cell states' in which the transcriptome and chromatin accessibility are coupled or decoupled for each gene, we demonstrate that splicing patterns in one cell state can differ from those of another state within the same cell type. We also use ScISOr-ATAC to measure the correlation of chromatin and splicing across brain cell types, cortical regions and species (macaque and human) and in Alzheimer's disease. In macaques, some excitatory neuron subtypes show brain-region-specific splicing and chromatin accessibility. In human and macaque prefrontal cortex, strong evolutionary divergence in one molecular modality does not necessarily imply strong divergence in another modality. Finally, in Alzheimer's disease, oligodendrocytes show high dysregulation in both chromatin and splicing.


Conflict of interest statement

Competing interests: L.C.N. is a scientific advisor to Abbvie and ViiV Healthcare and a board director member for Cytodyn and has financial interests in Ledidi, all for work unrelated to this study. H.U.T. has presented at user meetings of 10x Genomics, ONT and Pacific Biosciences, which, in some cases, included payment for travel and accommodations. The other authors declare no competing interests.

Figures

Figure 1.
Figure 1.
a, Outline of ScISOr-ATAC experimental and analysis pipeline. b, UMAP of Macaque PFC and visual-cortex samples. ASC: Astrocytes; INN: Inhibitory Neurons; VLMC: vascular and leptomeningeal cells; MG: Microglia; OLIG: Oligodendrocytes; OPCs: Oligodendrocyte precursor cells. Excitatory Neurons are indicated by cortical layer (L), intratelencephalic (IT) or extratelencephalic (ET), and gene markers. c, UMAP of human Alzheimer’s Disease and control PFC samples. d, UMAP of human nuclei from integrated control human PFC and macaque samples. e, UMAP of macaque nuclei from integrated control human PFC and macaque samples.
Figure 2.
Figure 2.
a, Volcano plot of brain-region specific splicing for excitatory neurons. b, Cell-type resolved single-cell long reads for POLN gene. Each line represents a single cDNA molecule. 2 tracks: Excitatory Neurons in PFC and VIS (visual cortex). Bottom black track: chr5:2,190,541–2,265,209. c, Number of genes which include exons tested with ≥ 1 and ≥ 2 cell states detected in PFC and visual cortex samples. d, Volcano plot of state-specific exons across multiple cell types in PFC and visual cortex (only the exons with ≥ 10 reads in ≥ 2 states were tested and shown(n= 382,108). Exons with p-value<=0.05 and |LOR|>1 are labeled in colors while the others in grey. LOR represents log odds ratio. One-sided Chi-square test followed by Benjamini–Yekutieli correction was applied to evaluate the significance of splicing-cell-state association (Methods). e, Distribution of the maximum normalized-state Δψ per exon. Normalized-state Δψ = state Δψ/overall Δψ. f, Pie chart showing the maximum normalized-state Δψ split by value into 3 groups: < 0.9, between 0.9 and 1, or >=1. g, Downsampling experiment. Distribution of % exons significant in brain region comparison per subtype (Methods; n=100). h, Downsampling experiment. Distribution of % exons significant targeted by disease probes (D+S-), synaptic probes (D−S+), or overlapping (D+S+) (Methods; n=100). i, Downsampling experiment. Percentage of peaks that are significantly different for each excitatory neuron subtype between brain regions in the vicinity of genes targeted for splicing analysis (Methods; n=20). j, Breakdown of the percent significant peaks by peak location (UTR, Exon, Intron, or Intergenic)(Methods; n=20). k, Example peak in the vicinity of the RCL1 gene is specific to the visual cortex only in L2–4 IT_CUX2.RORB excitatory neurons. l, Motif enrichment of transcriptional regulator NEUROG1 for excitatory neuron subtypes in PFC and visual cortex. Each boxplot shows the median (middle line), interquartile range (top and bottom line of the box), and adjacent values (whiskers extending to 1.5× the IQR). Dots represent outliers beyond this range. Two-sided Wilcoxon-rank-sum test was applied to all the comparisons shown in g, i, j, l. FDR correction was applied to multiple comparisons and corrected p-values(<0.05) were presented.
Figure 3.
Figure 3.
a, Volcano plot of excitatory neuron subtype specific splicing comparison of L3–5/L6 IT_RORB vs. L2–3 IT_CUX2. b, Downsampling experiment. Distribution of percentage of exons significant in the pairwise subtype comparison in both brain regions(Methods, n=100). c, Volcano plot of excitatory-neuron subtype specific comparison of L3–5/L6 IT_RORB vs. L2–3 IT_CUX2 open-chromatin regions for three types of excitatory cells. d, Downsampling experiment. Distribution of the percentage of peaks that are significantly different for each pairwise subtype comparison in the vicinity of genes targeted for splicing analysis(Methods, n=20). e, Cell-type resolved single-cell long reads for ARAP3 gene plotted with Top 3 tracks: L2–3 IT_CUX2, L3–5/L6 IT_RORB, and L2–4 IT_CUX2.RORB. Bottom black track: chr6:139,037,048–139,037,086. f, 2 outer-most peaks that are specific to L3–5/L6 IT_RORB in both PFC and visual cortex but absent in L2–3 IT_CUX2. The center peak is present in PFC and visual cortex L2–3 IT_CUX2, but not L3–5/L6 IT_RORB. These peaks are in the vicinity of DOCK4. g, Example peak is in the vicinity of the CTNNA2 gene shows increased accessibility only in L2–4 IT_CUX2.RORB in both brain regions. Each boxplot shows the median (middle line), interquartile range (top and bottom line of the box), and adjacent values (whiskers extending to 1.5× the IQR). Dots represent outliers beyond this range. Two-sided Wilcoxon-rank-sum test was applied to all the comparisons shown in b and d. Adjustments were applied to multiple comparisons and corrected p-values(<0.05) were presented.
Figure 4.
Figure 4.
a, Downsampling experiment. Distribution of percentage of peaks that are significantly different between human and macaque in the vicinity of genes targeted for splicing analysis per cell type(n=20). b, Downsampling experiment for subtypes with the same method described in a. c, 2 peaks within TRRAP. Left peak specific to human astrocytes but absent in macaque astrocytes. Right peak shows increased chromatin accessibility in human inhibitory neurons. ‘H’ represents human and ‘M’ represents macaque. d, A peak in CEP250 specific to Human L5 IT_RORB but absent in Macaque L5 IT_RORB. e, Correlation between Δψs(neuron vs. glia) of tested exons targeted by both exome probes and exon-exon junction probes indicated by regression using linear model, the shade represents the 95% CI (n=414). f, Downsampling experiment. Distribution of % exons showing significant difference between human and macaque per cell type (Methods, n=100). g, Cell-type resolved isoform expression for NUBP2 plotted with top 3 tracks being excitatory neurons, inhibitory neurons, and astrocytes. Left: macaque. Right: human. h, Downsampling experiment for subtypes with the same method described in f (n=100). i, Number of genes with ≥1 and ≥2 cell states detected in both species. Only the genes with testable exons are considered. j, Volcano plot of state specific exon across cell types in human and macaque. Only the exons with ≥10 reads in ≥2 states were tested(n=238,116). Exons having p-value<=0.05 and |LOR|>1 are labeled in colors, while the others in grey. LOR represents the log odds ratio. One-sided Chi-square test followed by Benjamini–Yekutieli correction was applied to evaluate the significance of splicing-cell state association. k, Distribution of the maximum-normalized-state Δψ per exon. Normalize-state Δψ = state Δψ/overall Δψ. l, Pie chart showing the maximum-normalized-state Δψ per exon split by value into 3 groups: < 0.9, between 0.9 and 1, or >=1. Each boxplot shows the median (middle line), interquartile range (box), and adjacent values (whiskers extending to 1.5× the IQR). Dots represent outliers. Two-sided Wilcoxon-rank-sum test was applied to all the comparisons shown in a,b,f,h. FDR correction was applied to multiple comparisons and corrected p-values(<0.05) were presented.
Figure 5.
Figure 5.
a, Downsampling experiments. Distribution of percentage of peaks that are significantly different between AD and control in the vicinity of genes targeted for splicing analysis(Methods, n=20). b, A peak which is highlighted within FMNL2 present in control astrocytes but not in AD astrocytes. c, Downsampling experiment. The distribution of %exons showing significant differential inclusion per cell type in AD vs. control (Methods, n=100). d, Percent of novel reads found within control(n=10) and AD(n=9) datasets. e, Cell-type resolved single-cell long reads for ZNF711. Top 2 tracks: AD excitatory neurons and control excitatory neurons, followed by AD oligodendrocytes and control oligodendrocytes. Bottom black track: chrX:85,264,898–85,268,508. f, Number of genes with ≥1 and ≥2 cell states detected in AD and control. Only the genes with testable exons are considered for cell state detection. g, Volcano plot of state specific exons across multiple cell types in AD and control group (only the exons with ≥10 reads in ≥2 cell states were tested(n=494, 726). Exons having p-value<=0.05 and |LOR|>1 are labeled in colors, while the others in grey. LOR represents the log odds ratio. One-sided Chi-square test followed by Benjamini–Yekutieli correction was applied to evaluate the significance of splicing-cell state association. h, Density plot of distribution of the maximum normalized state Δψ per exon. Normalized state Δψ = state Δψ/overall Δψ. i, Stacked bar plot showing the proportion of maximum normalized-state Δψ per exon split by value into 3 groups: < 0.9, between 0.9 and 1, or >=1. The “>=1” group representing the fraction of disease-associated overall Δψs which can be seen in specific cell states by cell type. Each boxplot shows the median (middle line), interquartile range (box), and adjacent values (whiskers extending to 1.5× the IQR). Dots represent outliers. Two-sided Wilcoxon-rank-sum test was applied to all the comparisons shown in a,c,d. FDR correction was applied to multiple comparisons and corrected p-values(<0.05) were presented.

References

    1. Ma S et al. Chromatin potential identified by shared single-cell profiling of RNA and chromatin. Cell 183, 1103–1116.e20 (2020). - PMC - PubMed
    1. Zhu C et al. An ultra high-throughput method for single-cell joint analysis of open chromatin and transcriptome. Nat. Struct. Mol. Biol 26, 1063–1070 (2019). - PMC - PubMed
    1. Luo C et al. Single nucleus multi-omics identifies human cortical cell regulatory genome diversity. Cell Genom. 2, 100107 (2022). - PMC - PubMed
    1. Stoeckius M et al. Simultaneous epitope and transcriptome measurement in single cells. Nat. Methods 14, 865–868 (2017). - PMC - PubMed
    1. Ben-Chetrit N et al. Integration of whole transcriptome spatial profiling with protein markers. Nat. Biotechnol 41, 788–793 (2023). - PMC - PubMed

LinkOut - more resources