

Associations of a healthy beverage pattern with all-cause and cause-specific mortality among US adults: a nationwide cohort study
- PMID: 40696344
- PMCID: PMC12281692
- DOI: 10.1186/s12937-025-01179-5
Associations of a healthy beverage pattern with all-cause and cause-specific mortality among US adults: a nationwide cohort study
Abstract
Background: Not all beverage items are necessarily beneficial for health, but the potential impact of an overall beverage pattern on health remains unknown. We aimed to examine associations of adherence to an overall healthy beverage pattern with all-cause and cause-specific mortality in a prospective cohort of US populations.
Methods: We included 8,894 adults from the National Health and Nutrition Examination Survey (2001-2019), a nationally representative cohort of US populations. Dietary data were collected at baseline based on the 24-h recall dietary interview. Using the data, we calculated a healthy beverage score (HBS), where coffee, tea, and low-fat milk received positive scores, while alcohol, fruit juice, artificially sweetened beverages, sugar-sweetened beverages, and whole-fat milk received reverse scores. A higher HBS reflected a healthier beverage pattern. We used Cox proportional hazards models to calculate hazard ratios (HRs) and 95% confidence intervals (CIs) for the associations of HBS with mortality, adjusting for demographics, dietary and lifestyle factors, and medical history.
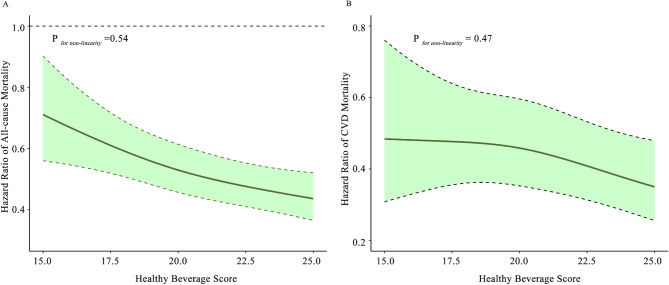
Results: During a mean follow-up of 15.5 years, we recorded 2,363 all-cause deaths, including 761 cardiovascular disease (CVD) deaths, 511 cancer deaths, and 1,091 other deaths. Compared with the lowest quartile of HBS, the HRs and 95%CIs of the highest quartile of HBS were 0.79 (0.68, 0.92) for all-cause mortality, 0.75 (0.60, 0.95) for CVD mortality, 0.92 (0.70, 1.22) for cancer mortality, and 0.75 (0.58, 0.98) for other mortality. Inverse linear relationships of HBS with all-cause, and CVD mortality were observed using restricted cubic splines (Pnon-linearity >0.05). These results were consistent across subgroups predefined by age, sex, smoking status, dietary fiber consumption, hypertension, hyperlipidemia, daily energy intake, and Healthy Eating Index-2015. Results were robust in several sensitivity analyses.
Conclusions: Greater adherence to HBS was associated with a substantially lower risk of all-cause, CVD and other mortality. These findings suggest that greater adherence to a healthy beverage pattern could benefit prevention of premature mortality.
Keywords: Healthy beverage score; Mortality; Public health.
© 2025. The Author(s).
Conflict of interest statement
Declarations. Ethics approval and consent to participate: The Ethics Review Board of the National Center for Health Statistics (NCHS) granted approval for the survey protocol. The written informed consent form was obtained from all participants. Competing interests: The authors declare no competing interests. Clinical trial number: Not applicable.
Figures
References
-
- Liu W, Wan C, Huang Y, Li M. Effects of tea consumption on metabolic syndrome: a systematic review and meta-analysis of randomized clinical trials. Phytother Res. 2020;34(11):2857–66. - PubMed
-
- Carlström M, Larsson SC. Coffee consumption and reduced risk of developing type 2 diabetes: a systematic review with meta-analysis. Nutr Rev. 2018;76(6):395–417. - PubMed
-
- Xie C, Cui L, Zhu J, Wang K, Sun N, Sun C. Coffee consumption and risk of hypertension: a systematic review and dose-response meta-analysis of cohort studies. J Hum Hypertens. 2018;32(2):83–93. - PubMed
MeSH terms
Grants and funding
LinkOut - more resources
Full Text Sources
