. 2025 Jul 22;25(1):277.
doi: 10.1186/s12935-025-03913-9.

Identification of novel biomarkers involved in oral squamous cell carcinoma by whole transcriptome sequencing and bioinformatics analysis

Affiliations

Identification of novel biomarkers involved in oral squamous cell carcinoma by whole transcriptome sequencing and bioinformatics analysis

Hongliang Du et al. Cancer Cell Int. .

Abstract

Background: Oral squamous cell carcinoma (OSCC) is among the most common malignant tumors in the oral and maxillofacial regions, characterized by high drug resistance and poor treatment outcomes. This underscores the urgent need to identify novel biomarkers for OSCC.

Methods: Differentially expressed messenger RNAs (mRNAs), microRNAs (miRNAs), and long non-coding RNAs (lncRNAs) (DE-mRNAs, DE-miRNAs, and DE-lncRNAs) between primary and control groups, as well as metastatic and primary groups, were identified using whole transcriptome sequencing data. Candidate OSCC genes were derived from DE-mRNAs. Potential biomarkers were then identified using five algorithms from CytoHubba. Biomarkers were validated via univariate Cox regression and Kaplan-Meier (K-M) survival analysis. Additional analyses included subcellular localization, mutation analysis, and Gene Set Enrichment Analysis (GSEA). Key drugs for OSCC treatment were also identified. Quantitative real time polymerase chain reaction (qRT-PCR) and immunohistochemistry were employed to verify the expression levels of key biomarkers.

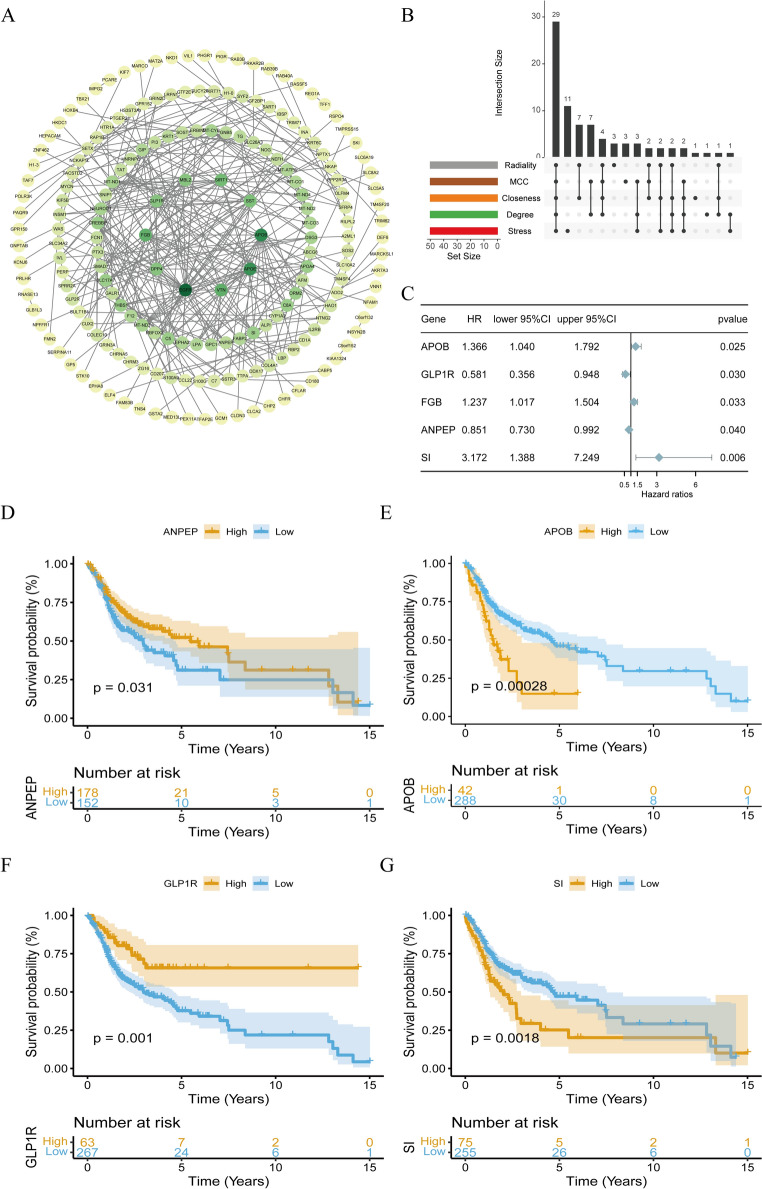
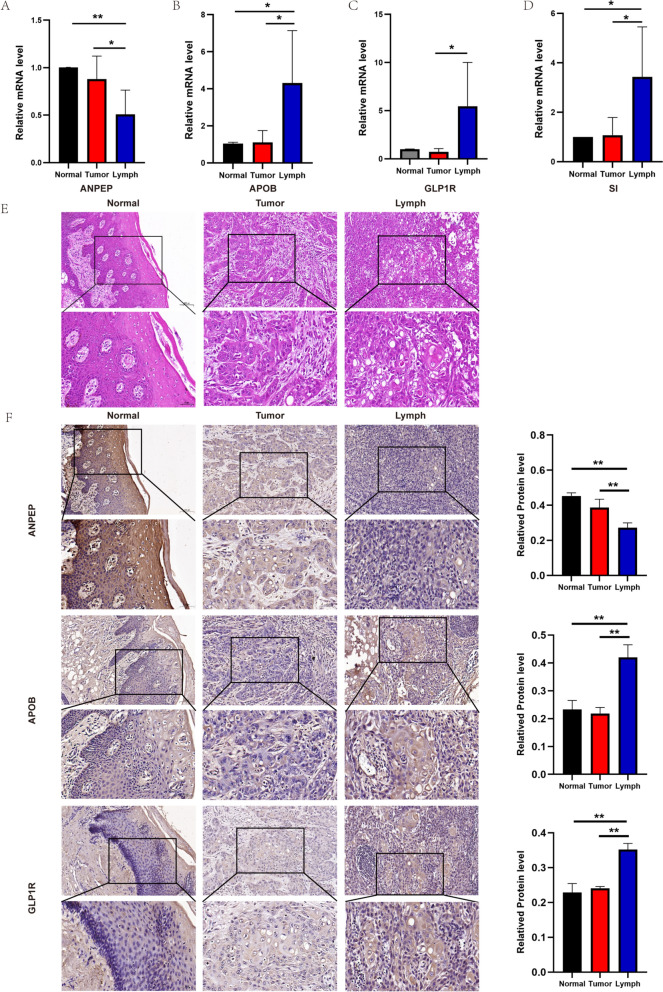
Results: A total of 304 candidate genes were identified, with 29 potential biomarkers selected by five algorithms. ANPEP, APOB, GLP1R, and SI exhibited significant survival differences in the K-M curves, establishing them as OSCC biomarkers. These biomarkers were predominantly localized in the cytoplasm, with SI and APOB showing the highest mutation susceptibility. Enrichment analysis revealed that the 'interferon-gamma response'biological function was co-enriched by ANPEP, APOB, and SI. Furthermore, BIBW2992 (afatinib) and PF.02341066 (crizotinib) were most strongly correlated with the biomarkers, suggesting their potential as key drugs for OSCC treatment. Additionally, the findings were validated by qRT-PCR and immunohistochemical analyses, and the results were consistent with the RNA-seq data.

Conclusion: ANPEP, APOB, GLP1R, and SI were identified as potential OSCC biomarkers, offering valuable insights for further research and therapeutic development.

Keywords: Complete RNA sequencing; Drugs; Molecular indicators; Oral squamous carcinoma; Regulatory networks.


Conflict of interest statement

Declarations. Ethics approval and consent to participate: The study was approved by the Ethics Committee of the First Hospital of Lanzhou University (Ethics approval number: LDYYLL2024-776). The patients provided their written informed consent to participate in this study. Consent for publication: This article has been authorized by all authors and agreed to be published. Competing interests: The authors declare no competing interests.

Figures

Fig. 1
Fig. 1
Biological pathways among control, primary, and metastatic groups. A PCA analysis. B A heatmap showing the correlation among the control, primary, and metastatic groups. C Differential biological pathways between the control and primary groups. D Differential biological pathways between the primary and metastatic groups
Fig. 2
Fig. 2
Identification of differentially expressed DE-mRNAs and DE-miRNAs. A, E Volcano plots showing DE mRNAs and DE miRNAs with up- and down-regulation between primary and control groups. C, G Volcano plots showing DE mRNAs and DE miRNAs with up- and down-regulation between the metastatic and primary groups. B, F Heatmaps of DE mRNAs and DE miRNAs between the primary and control groups. D, H Heatmaps of DE mRNAs and DE miRNAs between the metastatic and primary groups
Fig. 3
Fig. 3
Identification of differentially expressed DE-lncRNAs. A Volcano plots showing DE-lncRNAs with up- and down-regulation between the primary and control groups. B Heatmaps of DE-lncRNAs between the primary and control groups. C Volcano plots showing DE-lncRNAs with up- and down-regulation between the metastatic and primary groups. D Heatmaps of DE-lncRNAs between the metastatic and primary groups
Fig. 4
Fig. 4
Differential gene distribution between groups and enrichment of candidate genes. AC Candidate DE-mRNAs, DE-miRNAs, and DE-lncRNAs screened in DE-mRNA1 and DE-mRNA2. D GO enrichment of candidate genes. E KEGG pathways involved in the candidate genes
Fig. 5
Fig. 5
LncRNA-miRNA-mRNA co-regulatory network. A Venn diagram showing the overlap between candidate miRNAs and miRNAs predicted by the database. Target miRNAs. B Venn diagram showing the overlap between candidate lncRNAs and lncRNAs predicted by the database. C The molecular regulatory network of OSCC
Fig. 6
Fig. 6
PPI network, potential biomarkers, and Kaplan–Meier analysis. A PPI network construction. The thickness of edges represents the combined score, while node color and size indicate the degree of interaction. B Potential biomarkers for OSCC. C The univariate Cox forest chart of prognosis-related genes. DG Kaplan–Meier analysis
Fig. 7
Fig. 7
Differential expression of biomarkers across various clinical features. A ANPEP, B APOB, C GLP1R, D SI. ns: not significant, *p < 0.05, **p < 0.01
Fig. 8
Fig. 8
Subcellular localization, mutation profile, and biological function. A Subcellular localization analysis, B Biomarker mutation profile, CE Biological functions co-enriched by ANPEP, APOB, and SI
Fig. 9
Fig. 9
Immunological features and correlation analysis between biomarkers and drug sensitivity. A Correlation analysis between biomarkers, B Bubble plots of IC50 correlations of biomarkers with drugs, C Correlation between BIBW2992 (Afatinib) and ANPEP, D Correlation between PF.02341066 (Crizotinib) and ANPEP
Fig. 10
Fig. 10
Regulatory network and biomarker expression across three groups. A Analysis of the transcription factor regulatory network, B Diseases associated with biomarkers, C Expression of biomarkers between primary and control groups, D Expression of biomarkers across primary, control, and metastatic groups. ns: not significant, *p < 0.05, **p < 0.01, ***p < 0.001
Fig.11
Fig.11
qRT-PCR and immunohistochemistry validation of the expression levels of key biomarkers. AD Relative mRNA expression of ANPEP, APOB, GLP1R and SI. E Hematoxylin and eosin (H&E) staining of three groups. F Immunohistochemical staining for ANPEP, APOB, and GLP1R in three groups and the relevant statistical diagram of immunohistochemical results. Images were taken under × 200 and × 400 magnifications for each field. *p < 0.05, **p < 0.01

References

    1. Sung H, Ferlay J, Siegel RL, Laversanne M, Soerjomataram I, Jemal A, et al. Global cancer statistics 2020: GLOBOCAN estimates of incidence and mortality worldwide for 36 cancers in 185 countries. CA Cancer J Clin. 2021;71(3):209–49. - PubMed
    1. Omar E. Current concepts and future of noninvasive procedures for diagnosing oral squamous cell carcinoma—a systematic review. Head Face Med. 2015;11:6. - PMC - PubMed
    1. Hoene G, Gruber RM, Leonhard JJ, Wiechens B, Schminke B, Kauffmann P, et al. Combined quality of life and posttraumatic growth evaluation during follow-up care of patients suffering from oral squamous cell carcinoma. Mol Clin Oncol. 2021;15(3):189. - PMC - PubMed
    1. Suresh GM, Koppad R, Prakash BV, Sabitha KS, Dhara PS. Prognostic indicators of oral squamous cell carcinoma. Ann Maxillofac Surg. 2019;9(2):364–70. - PMC - PubMed
    1. Johnson DE, Burtness B, Leemans CR, Lui VWY, Bauman JE, Grandis JR. Head and neck squamous cell carcinoma. Nat Rev Dis Primers. 2020;6(1):92. - PMC - PubMed

LinkOut - more resources