

The association of dietary fat intake before and during pregnancy with the risk of gestational diabetes mellitus and impaired glucose intolerance: a systematic review and dose-response meta-analysis on observational investigations
- PMID: 40696412
- PMCID: PMC12281954
- DOI: 10.1186/s12937-025-01186-6
The association of dietary fat intake before and during pregnancy with the risk of gestational diabetes mellitus and impaired glucose intolerance: a systematic review and dose-response meta-analysis on observational investigations
Abstract
Background: Previous studies investigating the relationship of dietary fat intake with gestational diabetes mellitus (GDM) and impaired glucose tolerance (IGT) have yielded inconsistent findings. Therefore, the relationship between fat intake before and during pregnancy and risk of GDM and IGT was assessed.
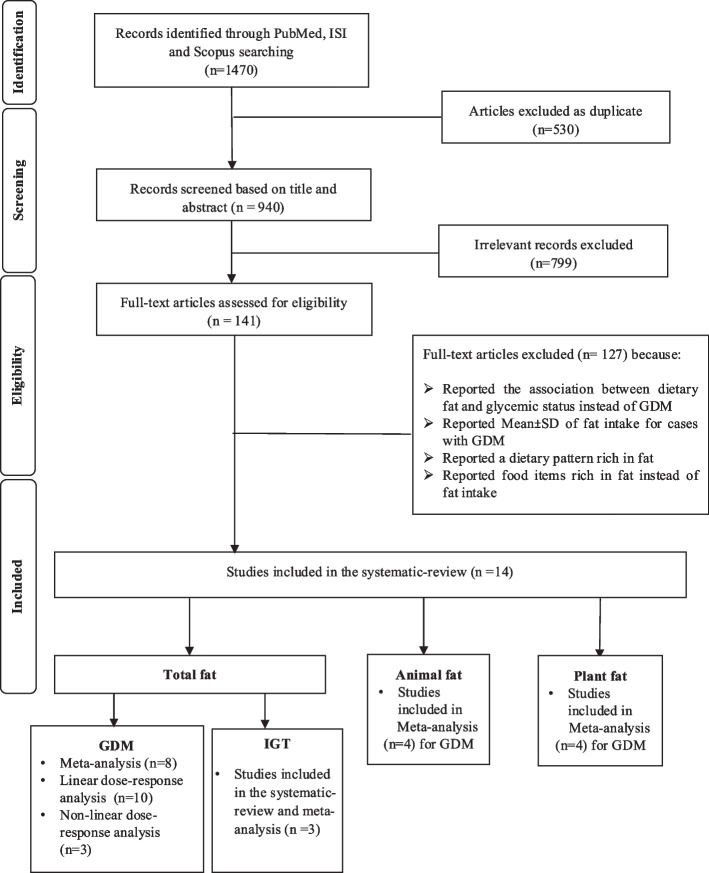
Methods: A comprehensive search was conducted using electronic databases up to June 2024. Our selection criteria focused on observational studies that reported odds ratios (ORs)/ relative risks (RRs)/ hazard ratios (HRs) and 95% confidence intervals (CIs) for the associations between total, animal or plant fat intake and risks of GDM and IGT.
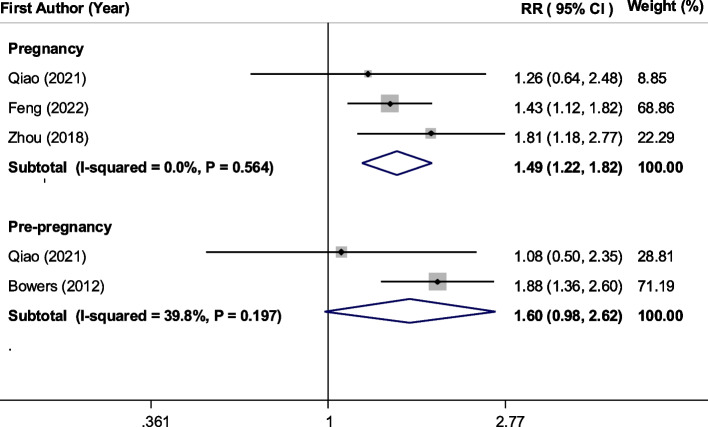
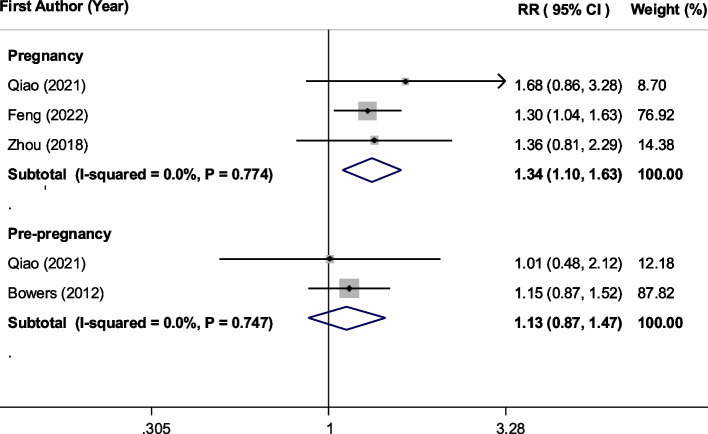
Results: A total of 14 studies comprising 39,399 participants were included. Comparing the highest versus lowest intakes of total, animal, and plant fat revealed the summary RRs of 1.49 (95% CI: 1.20, 1.83), 1.56 (95% CI: 1.32, 1.85), and 1.26 (95% CI: 1.08, 1.47), respectively, indicating significant positive associations of total, animal and plant fat with GDM. Subgroup analysis indicated that total fat intake during pregnancy had a stronger association with GDM than pre-pregnancy intake. For animal and plant fat, significant associations were only observed for intake during pregnancy. Based on the linear dose-response analysis, each 5% energy increment in total dietary fat during pregnancy was associated with a 6% increased risk of GDM (RR = 1.06; 95% CI: 1.03, 1.10). The non-linear dose-response analysis indicated an increasing trend between total fat intake during pregnancy (23%-50% E) and the risk of GDM. However, there was no significant relationship between fat intake and IGT.
Conclusion: Higher total fat intake before and during pregnancy is directly and dose-dependently associated with increased GDM risk. The highest versus lowest values of animal and plant fat intakes during pregnancy were related to higher risk of GDM. No significant association was observed for IGT; however, the limited number of included studies especially on "pre-pregnancy" and the cross-sectional nature of several studies on "during pregnancy" prevent us from establishing causal relationships.
Keywords: Fat intake; Gestational diabetes mellitus; Impaired glucose tolerance test; Meta-analysis; Pregnancy.
© 2025. The Author(s).
Conflict of interest statement
Declarations. Ethics approval and consent to participate: The study protocol was approved by the Medical Ethics Committee of Isfahan University of Medical Sciences IR.MUI.PHANUT.REC.1402.016. Consent for publication: Not applicable. Competing interests: The authors declare no competing interests.
Figures


References
-
- Saravanan P. Gestational diabetes: opportunities for improving maternal and child health. Lancet Diabetes Endocrinol. 2020;8:793–800. - PubMed
-
- Association AD. 2. Classification and diagnosis of diabetes: standards of medical care in diabetes—2020. Diabetes Care. 2020;43:S14–31. - PubMed
-
- Wang H, Li N, Chivese T, Werfalli M, Sun H, Yuen L, Hoegfeldt CA, Powe CE, Immanuel J, Karuranga S. IDF diabetes atlas: estimation of global and regional gestational diabetes mellitus prevalence for 2021 by international association of diabetes in pregnancy study group’s criteria. Diabetes Res Clin Pract. 2022;183:109050. - PubMed
-
- Gyasi-Antwi P, Walker L, Moody C, Okyere S, Salt K, Anang L, Eduful E, Laryea D, Ottie-Boakye D, Asah-Opoku K. Global prevalence of gestational diabetes mellitus: a systematic review and meta-analysis. New Am J Med. 2020;1:1–10.
-
- Srichumchit S, Luewan S, Tongsong T. Outcomes of pregnancy with gestational diabetes mellitus. Int J Gynecol Obstet. 2015;131:251–4. - PubMed
Publication types
MeSH terms
Substances
LinkOut - more resources
Full Text Sources
Medical
