. 2025 Jul;44(15-17):e70188.
doi: 10.1002/sim.70188.

The Mathematics of Serocatalytic Models With Applications to Public Health Data

Affiliations

The Mathematics of Serocatalytic Models With Applications to Public Health Data

Everlyn Kamau et al. Stat Med. 2025 Jul.

Abstract

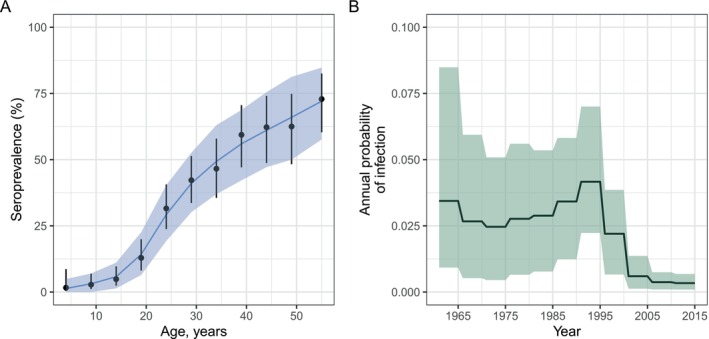
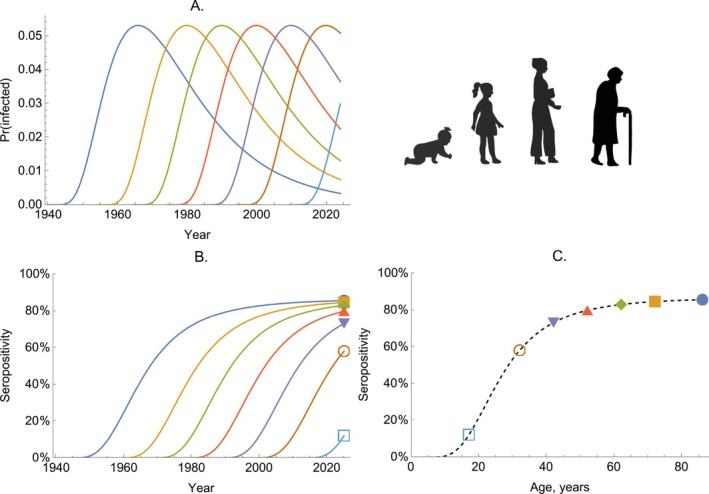
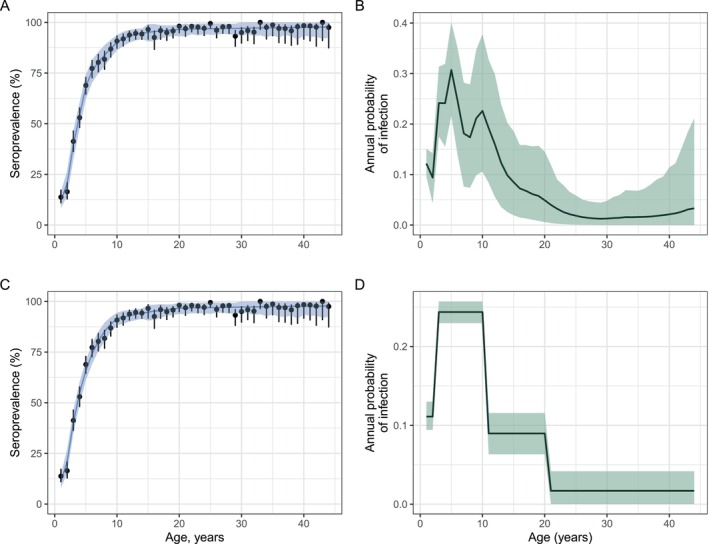
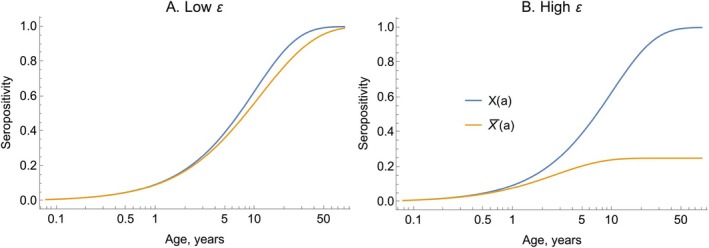
Serocatalytic models are powerful tools which can be used to infer historical infection patterns from age-structured serological surveys. These surveys are especially useful when disease surveillance is limited and have an important role to play in providing a ground truth gauge of infection burden. In this tutorial, we consider a wide range of serocatalytic models to generate epidemiological insights. With mathematical analysis, we explore the properties and intuition behind these models and include applications to real data for a range of pathogens and epidemiological scenarios. We also include practical steps and code in R and Stan for interested learners to build experience with this modeling framework. Our work highlights the usefulness of serocatalytic models and shows that accounting for the epidemiological context is crucial when using these models to understand infectious disease epidemiology.


Conflict of interest statement

The authors declare no conflicts of interest.

Figures

FIGURE 1
FIGURE 1
Muench's serosurvey data for yellow fever from three locations in the Americas. Row A shows the locations of the serosurveys. Each column in Rows B and C represents a particular location in the Americas. Row B shows the raw data (black points connected by solid lines) and modeled proportions seropositive (dashed lines); in Column iii, we show the 2·5th and 97·5th percentiles of a posterior distribution assuming a uniform prior over the proportion seropositive and a binomial likelihood for each age group separately; in Columns i & ii, we do not show uncertainty intervals since we did not have access to the sample sizes used in the serosurveys. Row C shows the inferred historical FOIs. Details of the data and analysis are provided in Section A.
FIGURE 2
FIGURE 2
The relationship between transmission dynamics models and serocatalytic models. Panel A shows the proportions susceptible and infected resulting from simulating a transmission dynamics model that includes waning immunity. In this model, the transmission rate, β, varies over time (see Section A for a complete description). Panel B shows the force of infection: β(t)I(t). Panel C shows the seropositivity trajectories of four birth cohorts. Panel D shows the serological age profile, in years, in the population in 2024.
FIGURE 3
FIGURE 3
The dynamics of seropositivity in a time‐varying FOI model. Panel A shows the probability of becoming infected in a given year (given by 1exp(λT)) over time. Panel B shows the solution of Equation (19) for six birth cohorts (colored lines). Panel C shows the proportion seropositive by age for the population in 2024; the dashed line shows the solution for all age groups, and the colored markers correspond to the seropositivity shown in 2024 in Panel B.
FIGURE 4
FIGURE 4
The dynamics of seropositivity in a model with time‐varying FOI and seroreversion. Panel A shows the probability of becoming infected per year (given by 1exp(λT)) over time (black solid line) and the fixed probability of seroreversion per year (dashed line). Panel B shows the proportion seropositive for six birth cohorts (colored lines). Panel C shows the proportion seropositive by age for the population in 2024; the dashed line shows the proportion seropositive for all age groups for the model including seroreversion and the colored markers correspond to the seropositivity shown in 2024 in Panel B; the solid line shows the model solution if the rate of seroreversion were zero.
FIGURE 5
FIGURE 5
Explaining chikungunya serological data in Burkina Faso and Gabon using a time‐varying FOI model. Panel A shows the observed and fitted seroprevalence by age from surveys undertaken in 2015. Points and whiskers represent the observed proportions with 95% confidence intervals. The solid blue line indicates the mean of the posterior samples. Panel B shows the posterior mean annual probability of infection estimates given by (1exp(λT)). In both panels, the shading indicates the 95% credible intervals, representing the 2.5th and 97.5th percentiles of the posterior distributions. We assumed that the FOI was piecewise‐constant with pieces of width 5 years.
FIGURE 6
FIGURE 6
The dynamics of seropositivity with age‐dependent infection risk—serological dynamics of a sexually transmitted infection. Panel A shows the probability of becoming infected per year (given by 1exp(λA)) for seven birth cohorts (colored lines). Panel B shows the proportion seropositive for the same birth cohorts (colored lines). Panel C shows the proportion seropositive by age for the population in 2024; the dashed line shows the proportion seropositive for all age groups; the colored markers correspond to the same 2024 values as shown at the right edge of Panel B.
FIGURE 7
FIGURE 7
Age‐varying FOI model fits for mumps virus. Panels A and C show the observed and model‐fitted seroprevalence by age. Points and whiskers represent the observed proportions with 95% confidence intervals. The blue lines indicate the mean of posterior samples, and the shading shows the 95% credible intervals representing the 2.5th and 97.5th percentiles of the posterior distributions. Panels B and D show the estimated age‐specific annual probability of infection, calculated as 1exp(λA), from a model with one‐year piecewise‐constant FOIs (Panel B) and a model assuming four FOI pieces (Panel D). For Panels B and D, we estimated four FOI values across the following age bands: (1,2), (3–8), (9,10), (11–44).
FIGURE 8
FIGURE 8
An elevated death rate subsequent to infection can dilute the pool of seropositive individuals. In both panels, we plot seropositivity estimated using Equation (42) (orange lines), which accounts for an elevated death rate post‐infection. In Panel A, we assume a low death rate, ε=0.05; in Panel B, we assume a higher death rate, ε=0.4. In both panels, λ=0.1. The blue lines show the approximate solution given by neglecting to account for the elevated death rate (Equation (13)).
FIGURE 9
FIGURE 9
Accounting for an elevated death rate due to infection results in a higher inferred FOI for Ebola virus disease in Sierra Leone during the West African Ebola outbreak in 2014–16. Panel A shows the observed (black circles) seroprevalence with 95% confidence intervals and model‐predicted seroprevalence by age (blue and green lines). The predicted seroprevalence (blue and green lines) is derived from two models with and without the infection fatality ratio (IFR). Panel B shows the annual probability of infection for the two IFR models.
FIGURE 10
FIGURE 10
The dynamics of seropositivity with age‐ and time‐dependent infection risk. Panel A shows the probability of becoming infected per year (given by 1exp(λ)) for seven birth cohorts (colored lines). Panel B shows the proportion seropositive for the same birth cohorts (colored lines). Panel C shows the proportion seropositive by age in a single cross‐section, taken in 2024. The dashed line shows the proportion seropositive across all age groups, while the colored markers correspond to the same values shown in 2024 in Panel B.
FIGURE 11
FIGURE 11
Modeling HIV prevalence in South Africa before widespread treatment. Panel A shows the observed and model‐fitted seroprevalence by age. Points and whiskers represent the observed prevalence with exact 95% confidence intervals. The blue line and shading indicate the mean of posterior samples, with 95% credible intervals representing the 2.5th and 97.5th percentiles of the model's posterior distributions. Panel B shows the estimated age patterns of infection u(.). Panel C shows the annual probability of becoming infected for each cohort. The probability of infection is calculated as 1exp((u(.)v(.)). Panel D shows the estimated time patterns of infection v(.).
FIGURE 12
FIGURE 12
Neglecting maternal antibody dynamics can bias the proportion seropositive. In both panels, we plot Equation (56) (solid lines), where we assume γ=2 per year; in Panel A, we assume λ=0.05; in Panel B, we assume λ=0.4. The dashed lines show the approximate solution given by neglecting the effect of maternal antibodies (i.e., Equation (57)). Note, the horizontal axis is on the log scale, which cannot start at zero, and the reason the maternal compartment does not begin at M(0)=1.
FIGURE 13
FIGURE 13
Accounting for maternal antibody dynamics affects the inferred seroprevalence for enterovirus D68. Both panels show the observed (black points, with 2.5th and 97.5th percentiles shown as vertical error bars) and model‐predicted (blue lines) seroprevalence by age. The 95% credible intervals (95% CrIs) representing the 2.5th and 97.5th percentiles of the model's posterior distributions are shown as the blue shading. Panel A shows the results from a model considering maternal antibody dynamics, and Panel B shows the model fit when neglecting maternal antibody dynamics.

Similar articles

References

    1. Hay J., Routledge I., and Takahashi S., “Serodynamics: A Review of Methods for Epidemiological Inference Using Serological Data,” OSF Prepr 2023. - PMC - PubMed
    1. Muench H., “Derivation of Rates From Summation Data by the Catalytic Curve,” Journal of the American Statistical Association 29 (1934): 25–38.
    1. Clairon Q., Prague M., Planas D., et al., “Modeling the Kinetics of the Neutralizing Antibody Response Against SARS‐CoV‐2 Variants After Several Administrations of Bnt162b2,” PLoS Computational Biology 19 (2023): e1011282. - PMC - PubMed
    1. Cutts F. T. and Hanson M., “Seroepidemiology: An Underused Tool for Designing and Monitoring Vaccination Programmes in Low‐and Middle‐Income Countries,” Tropical Medicine & International Health 21 (2016): 1086–1098. - PubMed
    1. Metcalf C. J. E., Farrar J., Cutts F. T., et al., “Use of Serological Surveys to Generate Key Insights Into the Changing Global Landscape of Infectious Disease,” Lancet 388 (2016): 728–730. - PMC - PubMed

MeSH terms

LinkOut - more resources