. 2025 Jul;21(7):e70493.
doi: 10.1002/alz.70493.

The MR1/MAIT cell axis impacts the gut-brain axis through both cognition and microbial community structure in 5XFAD mice

Affiliations

The MR1/MAIT cell axis impacts the gut-brain axis through both cognition and microbial community structure in 5XFAD mice

Season K Wyatt-Johnson et al. Alzheimers Dement. 2025 Jul.

Abstract

Introduction: Mucosal-associated invariant T (MAIT) cells recognize microbial antigens presented by major histocompatibility complex class I-like molecule (MR1) and are elevated in Alzheimer's disease (AD) model mouse brains; MAIT cell-deficient AD mice have reduced brain pathology, supporting the importance of the gut-brain axis in AD. How the MR1/MAIT cell axis impacts cognition and the microbiome remains unknown.

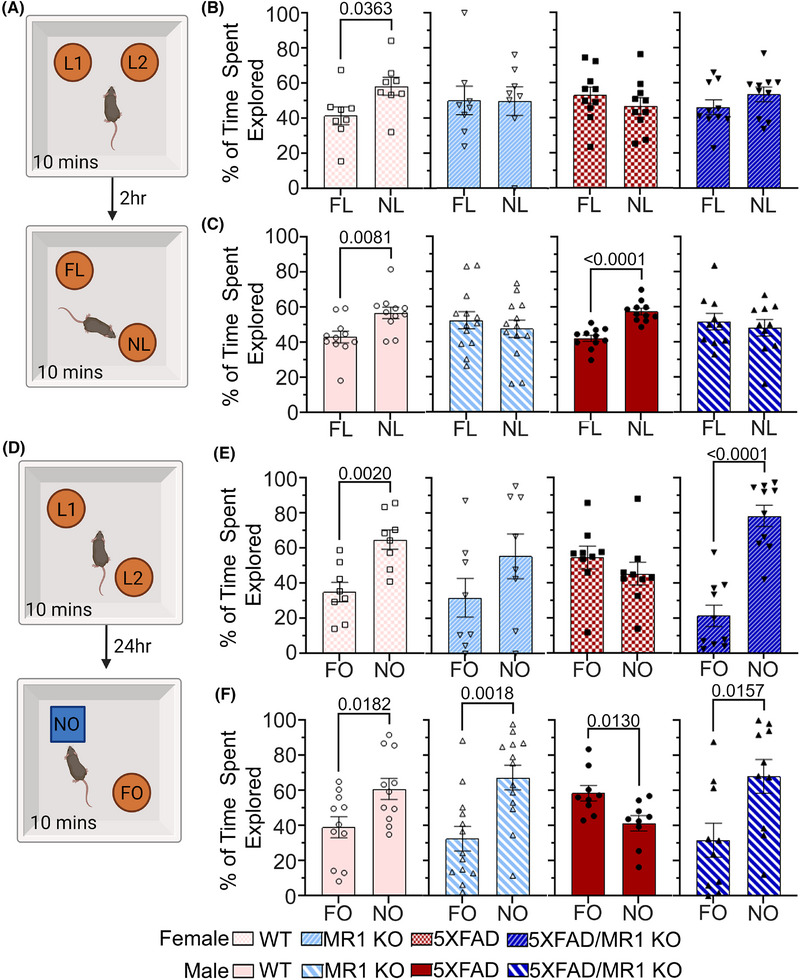
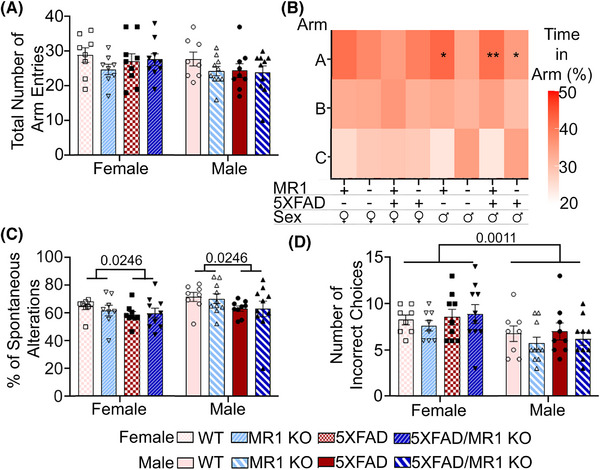
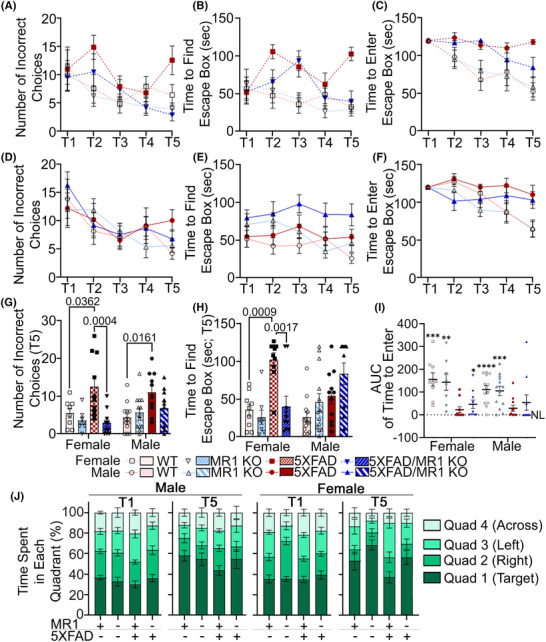
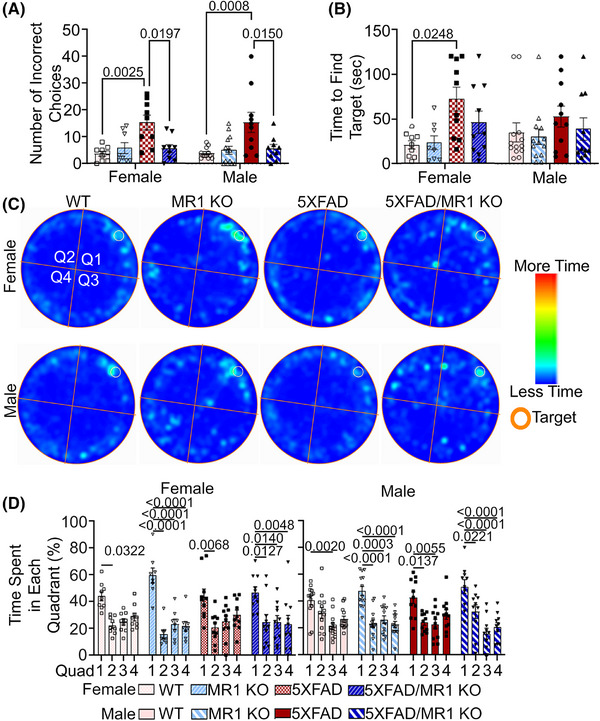
Methods: Novel object recognition/placement, Y-maze, and Barnes maze were used to determine memory changes in wild-type (WT), MR1 KO, 5XFAD, and 5XFAD/MR1 KO mice. Fecal samples were analyzed using 16S rRNA gene amplicon sequencing.

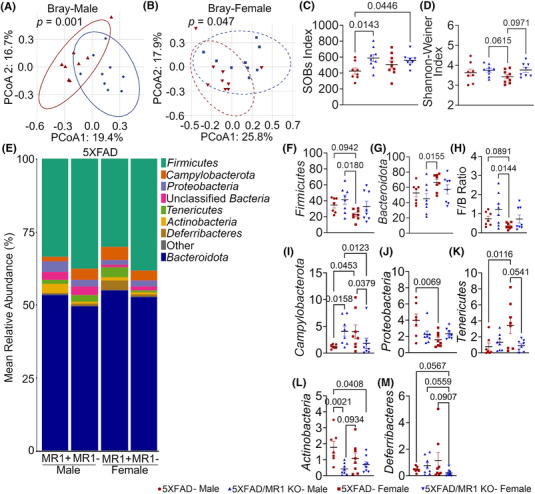
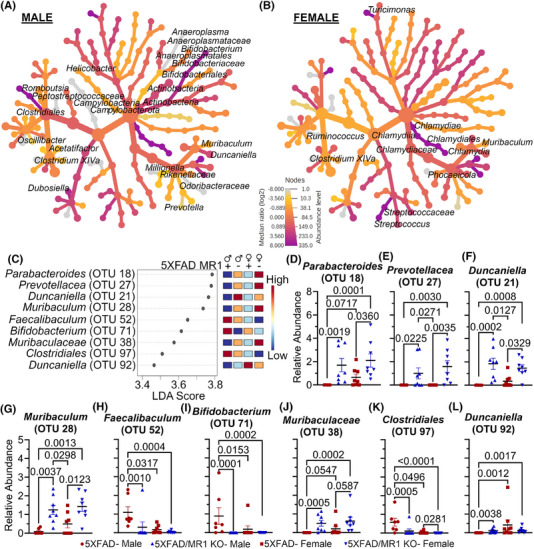
Results: 5XFAD/MR1KO mice did not display the cognitive deficits observed in 5XFAD. There were relative abundance differences in the fecal microbiota between 5XFAD and 5XFAD/MR1 KO mice, and male 5XFAD/MR1 KO mice had increased microbiome alpha diversity compared to 5XFAD mice.

Discussion: Our data suggest that the MR1/MAIT cell axis negatively affects cognition and impacts gut microbiome diversity. These results further support a detrimental role for the MR1/MAIT cell axis in AD.

Highlights: 5XFAD mice lacking major histocompatibility complex, class I-related (MR1) and mucosal-associated invariant T (MAIT) cells had no deficits in recognition memory. Compared to 5XFAD, there was improved learning in the Barnes maze by female 5XFAD/MR1 knock-out (KO) mice. There was an increased abundance of Campylobacterota in male 5XFAD/MR1 KO versus 5XFAD mice. Six of nine linear discriminant analysis effect size-identified distinguishing features were higher in 5XFAD/MR1 KO mice.

Keywords: 5XFAD; Mucosal‐associated invariant T cells; gut–brain axis; innate immunity; major histocompatibility complex class I‐like molecule; memory; sex differences.


Conflict of interest statement

The authors declare that they have no competing interests. Author disclosures are available in the supporting information.

Figures

FIGURE 1
FIGURE 1
MR1‐deficient 5XFAD mice spend more time (vs. MR1+ 5XFAD mice) with the NO compared to the FO in the NOR test, but not in NP. A, Schematic of the NP starting in Trial 1 (top box) where the animals are placed into the box for 10 minutes with two identical objects; after 2 hours, the mice are placed back into the box for Trial 2 (bottom box), with one object moved to a new location. Percentage of time female (B) and male (C) mice spend exploring each object in NP Trial 2. D, Schematic of the NOR starting in Trial 1 (top box) where the animals are placed into the box for 10 minutes with two identical objects; after 24 hours, the mice are placed back into the box for Trial 2 (bottom box), with one object changed to a new object. Percentage of time female (E) and male (F) mice spend exploring each object in NOR Trial 2. For all statistics: n = 8–13, mean ± standard error of the mean; by Student t test; alpha = 0.05. FL, familiar location; FO, familiar object; MR1, major histocompatibility complex class I‐like molecule; NL, new location; NO, novel object; NOR, novel object recognition; NP, novel placement; WT, wild type.
FIGURE 2
FIGURE 2
MR1+ 5XFAD mice perform worse in the Y‐maze. A, The total number of arm entries, defined by the animal's entire body crossing the threshold of the arm. B, Heat map showing the percentage of time spent in each arm (red = more time; white = less time). C, Analysis of the percentage of spontaneous alterations, also known as the correct ratio, during the 7 minute test. D, The number of incorrect choices, defined by mice choosing the previously explored arm instead of the novel arm. For all statistics: n = 8–12, mean ± standard error of the mean; p values: *, < 0.05, **, < 0.01 by a three‐way analysis of variance with Šídák multiple comparisons test; alpha = 0.05. KO, knock out; MR1, major histocompatibility complex class I‐like molecule; WT, wild type.
FIGURE 3
FIGURE 3
Female MR1‐deficient 5XFAD mice perform better during the Barnes maze learning phase compared to MR1+ 5XFAD mice. A, The number of incorrect holes explored before finding the target hole over all five trials (T) in female mice. B, The elapsed time to find the escape box by females across trials. C, The elapsed time for female mice to enter the escape box during each trial. D, The number of incorrect holes explored by male mice before finding the target hole over all five trials. E, The elapsed time to find the escape box in males across trials. F, The elapsed time for male mice to enter the escape box during each trial. G, The number of incorrect choices before finding an escape hole during T5. H, The elapsed time in trial T5 to find the escape box. I, AUC of the time to enter the escape box from T1 to T5 with NL equal to 0. J, Percentage of the time each mouse stayed in the four different quadrants in the first (T1) and last (T5) trial. For all statistics: n = 8–13, mean ± standard error of the mean, p values: *, < 0.05, **, < 0.01, ***, < 0.001, ****, < 0.0001 by a three‐way analysis of variance with a Šídák multiple comparisons test and one‐sample t test with a hypothetical value = 0; alpha = 0.05. AUC, area under the curve; KO, knock out; MR1, major histocompatibility complex class I‐like molecule; NL, no learning; WT, wild type.
FIGURE 4
FIGURE 4
Male and female MR1‐deficient 5XFAD mice perform better than MR1+ 5XFAD mice during the probe trial for the Barnes maze memory phase. A, The number of incorrect holes explored before finding the target location in the probe trial. B, The elapsed time to find the target hole in the probe trial. C, The averaged heat maps across each group for the probe trial display the time spent across the platform; the target hole is located in quadrant (Q) 1 (more time = red; less time = blue). D, Percentage of time each mouse spent in the four different quadrants in the probe trial; Q1: Target quadrant, Q2: Quadrant to the left of the target quadrant, Q3: Quadrant directly below the target quadrant, and Q4: Quadrant directly below Q2. For all statistics: n = 8–13, mean ± standard error of the mean, by a three‐way analysis of variance with a Šídák multiple comparisons test; alpha = 0.05. KO, knock out; MR1, major histocompatibility complex class I‐like molecule; WT, wild type.
FIGURE 5
FIGURE 5
MR1/MAIT cell axis‐deficient 5XFAD mice have an altered gut microbiota and beta diversity compared to MR1+ 5XFAD mice. PCoA of Bray–Curtis distance showing the species‐level beta diversity of the gut microbiota between 5XFAD and 5XFAD/MR1 KO male (A) and female (B) mice. C, Alpha diversity metric, the SOBs measuring richness of the microbiome between 5XFAD and 5XFAD/MR1 KO mice. D, Shannon–Weiner index for alpha diversity measuring richness and evenness between the microbiomes of 5XFAD and 5XFAD/MR1 KO mice. E, Stacked bar charts showing the percent relative abundance of microbiota taxa at the phylum level. Percent relative abundance of the microbiota taxa > 2% abundance at the phylum level for Firmicutes (F), Bacteroidota (G), the Firmicutes/Bacteroidota ratio (H), Campylobacterota (I), Proteobacteria (J), Tenericutes (K), Actinobacteria (L), and Deferribacteres (M). For all statistics: n = 7–9, mean ± standard error of the mean, by a Kruskal–Willis test with a Dunn multiple comparison test and Wilcoxon rank sum test; alpha = 0.10. KO, knock out; MAIT, mucosal‐associated invariant T; MR1, major histocompatibility complex class I‐like molecule; PCoA, principal coordinate analysis; SOB, observed species index.
FIGURE 6
FIGURE 6
5XFAD/MR1 KO mice have more LDA significantly elevated OTUs compared to 5XFAD MR1+ mice. Heat tree analysis displaying the hierarchical structure of taxonomic classifications using statistically significant median abundances to show compared differences between male 5XFAD and 5XFAD/MR1 KO mice (A) and female 5XFAD and 5XFAD/MR1 KO mice (B). C, The LEfSe was used to determine the top features with an LDA of > 3.4. D–L, Percent relative abundance of microbiota taxa at the OTU level for Parabacteroides‐OTU 18 (D), Prevotellacea‐OTU 27 (E), Duncaniella‐OTU 21 (F), Muribaculum‐OTU 28 (G), Faecalibaculum‐OTU 52 (H), Bifidobacterium‐OTU 71 (I), Muribaculaceae‐OTU 38 (J), Clostridiales‐OTU 97 (K), and Duncaniella‐OTU 92 (L). For all statistics: n = 7–9, mean ± standard error of the mean, by a Kruskal–Willis test with a Dunn multiple comparison test and Wilcoxon rank sum test; alpha = 0.10. LDA, linear discriminate analysis; LEfSe, linear discriminant analysis effect size; MR1, major histocompatibility complex class I‐like molecule; OTU, operational taxonomical unit.

Similar articles

References

    1. Hammers DB, Nemes S, Diedrich T, et al. Learning slopes in early‐onset Alzheimer's disease. Alzheimers Dement. 2023;19(Suppl 9):S19‐S28. doi: 10.1002/alz.13159 - DOI - PMC - PubMed
    1. Bondi MW, Edmonds EC, Salmon DP. Alzheimer's Disease: past, Present, and Future. J Int Neuropsychol Soc. 2017;23(9‐10):818‐831. doi: 10.1017/S135561771700100X - DOI - PMC - PubMed
    1. Lane CA, Hardy J, Schott JM. Alzheimer's disease. Eur J Neurol. 2018;25(1):59‐70. doi: 10.1111/ene.13439 - DOI - PubMed
    1. Janeiro MH, Ramirez MJ, Solas M. Dysbiosis and Alzheimer's disease: cause or treatment opportunity?. Cell Mol Neurobiol. 2022;42(2):377‐387. doi: 10.1007/s10571-020-01024-9 - DOI - PMC - PubMed
    1. Tarawneh R, Penhos E. The gut microbiome and Alzheimer's disease: complex and bidirectional interactions. Neurosci Biobehav Rev. 2022;141:104814. doi: 10.1016/j.neubiorev.2022.104814 - DOI - PMC - PubMed

Substances