. 2025 Jul;15(7):e70422.
doi: 10.1002/ctm2.70422.

Spatially resolved proteomics surveys the chemo-refractory proteins related to high-grade serous ovarian cancer

Affiliations

Spatially resolved proteomics surveys the chemo-refractory proteins related to high-grade serous ovarian cancer

Linyuan Fan et al. Clin Transl Med. 2025 Jul.

Abstract

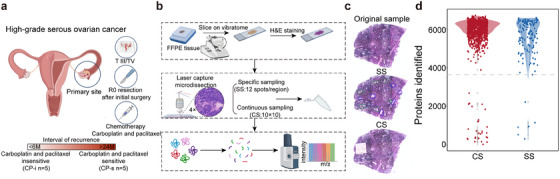
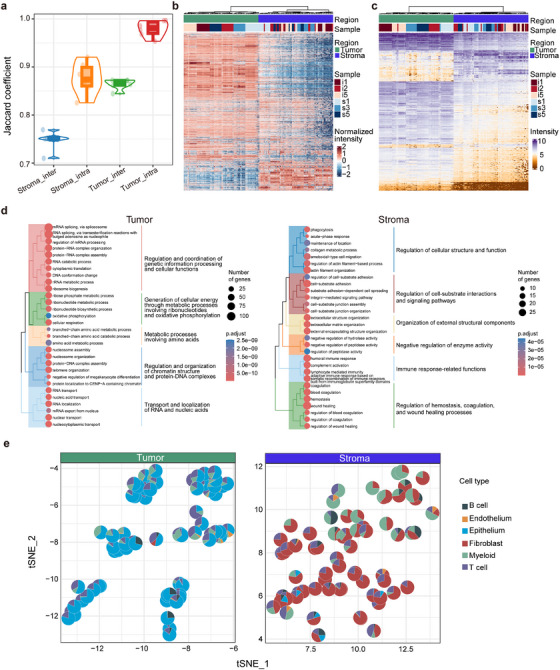
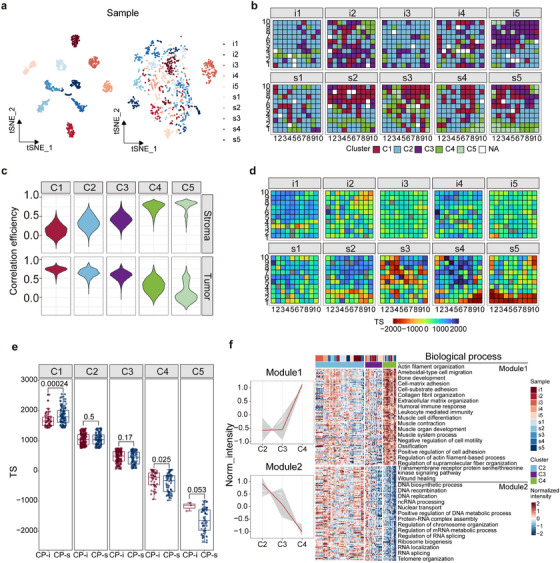
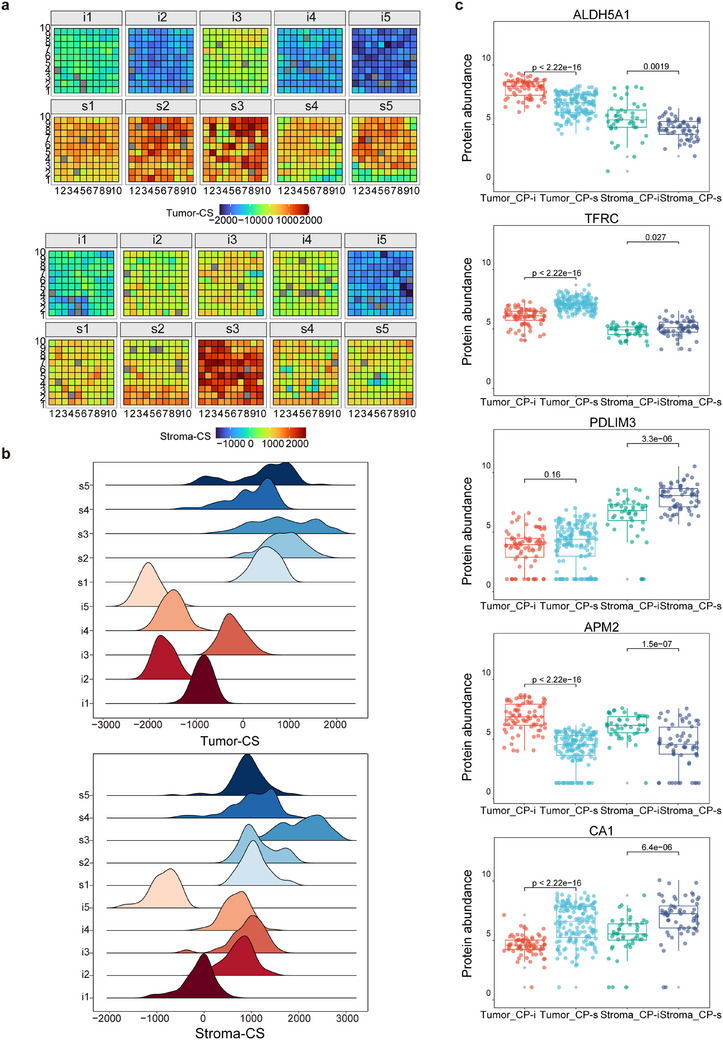
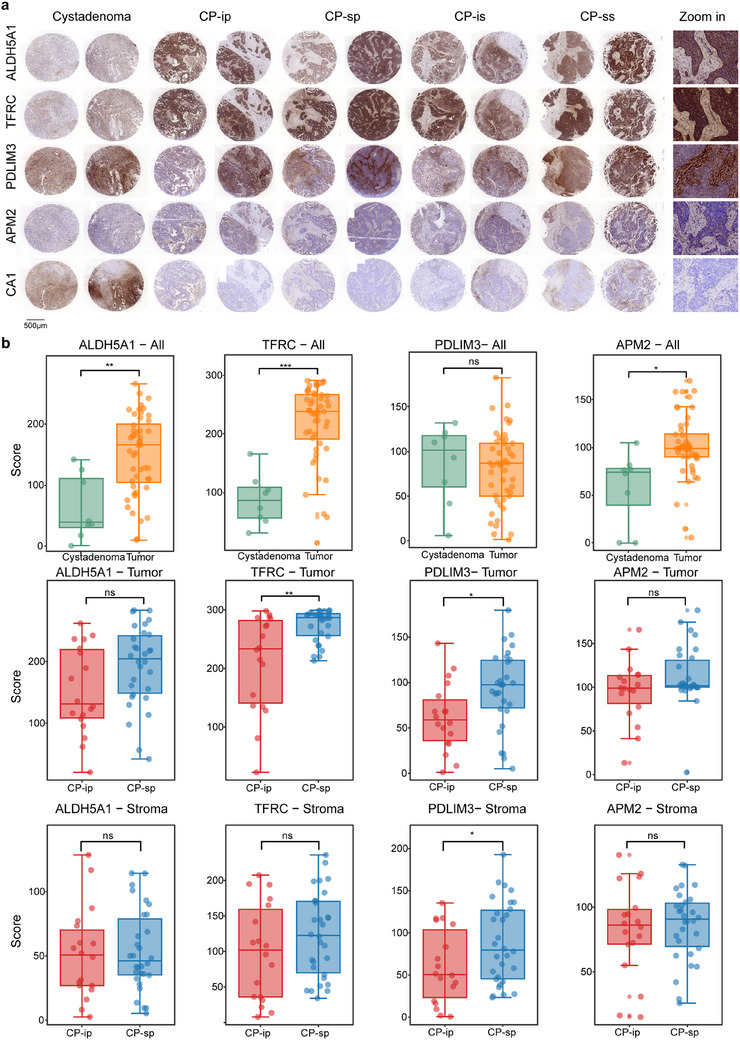
High-grade serous ovarian carcinoma (HGSC) is a lethal malignancy characterized by high incidence, mortality, and chemoresistance. However, its molecular drivers are unknown. In this study, spatially resolved proteomics was applied to 1144 formalin-fixed paraffin-embedded tissue spots obtained by laser capture microdissection from 10 patients with HGSC and divergent carboplatin-paclitaxel (CP) responses. Specific sampling revealed stroma-driven tumour heterogeneity, identifying 642 tumour-specific and 180 stroma-specific proteins, with 505 CP-responsive therapeutic targets. Most of these protein signatures represented previously unreported associations with chemoresistance in HGSCs. Two clinically significant spatial proteomic maps were generated by introducing tumour (TS) and chemical (CS) scores. TS analysis revealed conserved tissue architecture across CP response groups, whereas CS mapping revealed pretreatment metabolic reprogramming (rather than proliferation) as the defining feature of chemo-resistant tumours, challenging current resistance paradigms. Immunohistochemical validation of HGSC tissue microarrays confirmed the spatial proteomic localization of TFRC and PDLIM3, which are linked to tumour progression, while establishing their novel role as chemotherapy resistance biomarkers through this study, with broader predictive potential observed across additional targets in the discovery cohort. This study developed a spatially resolved proteomic framework to enhance the diagnostic and therapeutic strategies for HGSC. KEY POINTS: HGSC intra-tumour heterogeneity is predominantly driven by stroma, as revealed by spatial proteomic compartmentalization (tumour/stroma). Spatial proteomics expands the therapeutic target database, enabling prediction of platinum-based chemotherapy response. Chemo-resistant patients exhibit pre-treatment metabolic activation rather than proliferative signatures. TFRC (iron transport) and PDLIM3 (cytoskeletal remodelling) are spatially validated as chemo-response biomarkers.

Keywords: drug resistance; formalin‐fixed paraffin‐embedded; high‐grade serous ovarian carcinoma; laser capture microdissection; spatial proteomics.


Conflict of interest statement

The authors declare no conflict of interest.

Figures

FIGURE 1
FIGURE 1
Schematic overview for spatial proteomics of HGSC. (A) HGSC patient collection. (B) Workflow of spatial proteomics analysis, including LCM sampling, decrosslinking, and tryptic digestion of micro‐FFPE tissues and (C) Image illustration for LCM sampling on micro‐FFPE tissues, specific sampling (SS) (Spots from tumor region marked with green circle, and from stroma region marked with blue circle with pathologist‐confirmed) and continuous sampling (CS), and (D) Distribution of proteins identified in all the spots in CS or SS groups (n = 1144 spots) for removal of the outlier spots with low identification rate (n = 40 spots).
FIGURE 2
FIGURE 2
Qualitative and quantitative analysis towards the identified proteins in tumor and stroma regions of HGSC. (A) Evaluation of similarity or difference of the identified proteins among intra‐ or inter‐samples using Jaccard similarity. (B) Heatmap for all the identified and quantified proteins in tumor and stroma regions or (C) for all the DEPs between tumor and stroma in all the qualified spots. (D) GO‐BP analysis of all the upregulated DEPs in tumor or stroma, respectively. (E) Cell deconvolution for every spot either tumor or stroma in all the samples with spatial proteomics. A pie chart stands for the ratios of cell types labeled by different colors in a spot.
FIGURE 3
FIGURE 3
Generation of the spatial proteomics map of HGSC. (A) Comparison of the individual differences among samples by tSNE based on the proteomics data treated with (right) and without (left) Harmony treatment. (B) Spatial proteome map derived from Harmony treatments and unsupervised clustering. Spots labeled with NA were removed during the step of quality control. (C) Violin plot indicates abundance correlation for the proteins shared by the harmony clusters and tumor/stroma regions. The values of correlation efficiency close to 1 means high correlation and that close to 0 implies low correlation. (D) Spatial proteome map derived from TS. The bar of color gradient represents TS ranging from −2000 to 2000. (E) Analysis of significant difference between the paired clusters of CP‐i and CP‐s based on Wilcox test. And (F) GO‐BP analysis of the proteins in the cluster of C2, C3, and C4 that exhibit protein abundance with continuous increase or attenuation from C2 to C4.
FIGURE 4
FIGURE 4
Exploration of CP‐sensitive or CP‐insensitive proteins on micro‐FFPE tissues in view of spatial proteomics. (A) Spatial proteome map derived from CS, upper for tumor proteins and lower for stroma proteins. The bar of color gradient represents tumor‐CS ranging from −2000 to 2000 and stroma‐CS scaling from −1000 to 2000. (B) Distribution of CS density in all the samples in the tumor or stroma. (C) Paired comparison for the protein abundance of five targets between CP‐i and CP‐s in all the samples in the tumor or stroma based on Student's t‐test.
FIGURE 5
FIGURE 5
Typical IHC images and statistical estimation of the IHC staining signals on the tissue microarray. (A) The typical IHC images on the tissue microarray of HGSC. The samples on the tissue microarray are grouped into 5, CP‐ip (CP‐insensitive in primary HGSC), CP‐sp (CP‐sensitive in primary HGSC), CP‐is (CP‐insensitive in secondary HGSC), CP‐ss (CP‐sensitive in secondary HGSC) and cystadenoma. Two typical IHC images in each group are selected. On the right image panel, the localized IHC images with 5X amplification obtained from the sample in CP‐sp (on right). (B) Paired comparison for the IHC staining intensities of four targets between CP‐ip and CP‐sp in all the samples of the tissue microarrays based on Student's t‐test. On the upper panel, comparison of four targets between cystadenoma and tumor, and on middle and lower panel, comparison of four targets between CP‐ip and CP‐sp from tumor and stroma, respectively. The signs of *, **, ***, and ns represent a significance with p < .05, p < .01, p < .001, and non‐significance.

Similar articles

References

    1. Gaona‐Luviano P, Medina‐Gaona LA, Magaña‐Pérez K. Epidemiology of ovarian cancer. Chin Clin Oncol. 2020;9:47. doi: 10.21037/cco-20-34 - DOI - PubMed
    1. Bell S, McKeeve C, Roxburgh P, Herrington CS. An overview of the molecular pathology of ovarian carcinomas. Diagnos Histopathol. 2024;30:477‐486. doi: 10.1016/j.mpdhp.2024.06.001 - DOI
    1. Wu P, Gao W, Su M, et al. Adaptive mechanisms of tumor therapy resistance driven by tumor microenvironment. Front Cell Dev Biol. 2021;9:641469. doi: 10.3389/fcell.2021.641469 - DOI - PMC - PubMed
    1. Zhang Q, Ding J, Wang Y, et al. Tumor microenvironment manipulates chemoresistance in ovarian cancer. Oncol Rep. 2022;47:1‐7. - PubMed
    1. Yang Y, Yang Y, Yang J, et al. Tumor microenvironment in ovarian cancer: function and therapeutic strategy. Front Cell Dev Biol. 2020;8:758. doi: 10.3389/fcell.2020.00758 - DOI - PMC - PubMed

LinkOut - more resources