. 2025 Jul 15:2025:5688648.
doi: 10.1155/np/5688648. eCollection 2025.

The Effects of Transcranial Direct Current Stimulation During Extended Reality Exercises for Cortical, Neuromuscular, and Clinical Recovery of Stroke Survivors

Affiliations

The Effects of Transcranial Direct Current Stimulation During Extended Reality Exercises for Cortical, Neuromuscular, and Clinical Recovery of Stroke Survivors

Cassio V Ruas et al. Neural Plast. .

Abstract

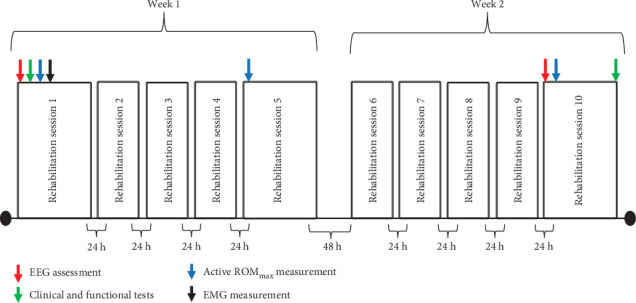
Background: Rehabilitation methods that include anodal transcranial direct current stimulation (atDCS) and extended reality (XR) exercises have been used to enhance neural networks and improve functional performance in stroke patients, but the neuromuscular and neurophysiological mechanisms underlying these improvements are not fully understood. The purpose of this study was to examine the effects of atDCS during XR rehabilitation exercises on cortical, neuromuscular, and clinical outcomes of stroke survivors. Methods: Nineteen chronic stroke survivors were placed into either a transcranial direct current stimulation (tDCS) or a Sham group, without significant (p > 0.73) differences in the baseline levels of disability between groups. The tDCS group received active atDCS and the Sham group received sham atDCS applied on the ipsilesional primary motor cortex (M1) while performing a 10-session XR rehabilitation program. Surface electromyography (EMG) activity was recorded from deltoid and rectus femoris of the paretic limb without and with the application of active/sham atDCS on the M1. Shoulder abduction and hip flexion active maximum joint range of motion (ROMmax), electroencephalography (EEG)-derived brain symmetry index (BSI) and functional/clinical tests were assessed before and after the rehabilitation program. Results: EMG activity was ~ 31% greater during hip flexion of the paretic limb with the application of active atDCS than without atDCS (p=0.04). Paretic hip flexion ROMmax increased by ~ 26%, BSI decreased by ~ 72% (indicating greater brain symmetry) and timed up and go (TUG) functional test improved by ~ 11% from before to after the rehabilitation program for the tDCS group only (p < 0.05). No other significant differences (p > 0.05) were observed. Conclusion: It seems that the application of active atDCS targeted the ipsilesional M1 representation of the quadriceps, which potentiated muscle activation in the paretic rectus femoris during XR exercises and resulted in greater motor recovery in hip flexion movements. The EEG-derived BSI results also indicate that atDCS was effective in reorganizing the ipsilesional hemisphere brain activity after stroke.

Keywords: electroencephalography; electromyography activity; extended reality; functional recovery; transcranial direct current stimulation.


Conflict of interest statement

The authors declare no conflicts of interest.

Figures

Figure 1
Figure 1
Study design indicating the order of neuromuscular and clinical measures assessed prior and/or after sessions one (baseline), five (mid-rehabilitation) and 10 (post-rehabilitation). Abbreviations: EEG, Electroencephalography; EMG, electromyographic activity; ROMmax, active maximum range of motion.
Figure 2
Figure 2
Set-up of rehabilitation exercises utilizing extended reality (XR, a). Jigsaw puzzle exercise (XR “GesturePuzzle” interactive game) performed sitting upright on a chair (b) and standing up on the floor or on top of an unstable surface (c). Step over obstacles exercise (XR “Obstacles” interactive game, d), and stationary walk exercise while visualizing an interactive Google Maps street view environment (XR “GestureMaps” game, e).
Figure 3
Figure 3
Changes in the paretic rectus femoris electromyographic (EMG) activity (root mean square calculation) during hip flexion (a and e) and knee extension (d and h), and paretic deltoid EMG activity during shoulder abduction (b and f) and shoulder flexion (c and g) maximal voluntary contractions without the application of atDCS followed by with the application of active atDCS on the M1 for the tDCS group, and without the application of atDCS followed by with the application of sham atDCS on the M1 for the Sham group. Bars represent means ± SD, and white circles represent individual participant values. Indicates significant difference between conditions (p  < 0.05).
Figure 4
Figure 4
Raw traces of the paretic rectus femoris electromyographic (EMG) activity (root mean square calculation) during hip flexion maximal voluntary isometric contractions without the application of atDCS (a) followed by with the application of active atDCS on the M1 (b) for a single participant of the tDCS group, and without the application of atDCS (c) followed by with the application of sham atDCS on the M1 (d) for a single participant of the Sham group.
Figure 5
Figure 5
Changes in hip flexion and shoulder abduction active maximum joint range of motion (ROMmax) from baseline (session 1) to sessions 5 (mid-rehabilitation) and 10 (post-rehabilitation) for the tDCS and Sham groups. Panels (a–d) refer to the paretic limb, and panels (e–h) refer to the nonparetic limb of stroke survivors. Bars represent means ± SD, and white circles represent individual participant values. Indicates significant difference from baseline (p < 0.05).
Figure 6
Figure 6
Changes in the electroencephalography (EEG)-brain symmetry index (BSI) in the delta, theta, alpha, beta and gamma bands, and across the entire spectrum, from baseline (session 1) to session 10 (post-rehabilitation) for the tDCS (a) and Sham (b) groups. Vertical lines represent means ± SD. Blue circles represent individual participant values of the tDCS group, and red circles represent individual participant values of the Sham group. Indicates significant difference from baseline (p < 0.05).

Similar articles

References

    1. Feigin V. L., Brainin M., Norrving B., et al. World Stroke Organization (WSO): Global Stroke Fact Sheet 2022. International Journal of Stroke . 2022;17(1):18–29. doi: 10.1177/17474930211065917. - DOI - PubMed
    1. Collaborators G. S. Global, Regional, and National Burden of Stroke and Its Risk Factors, 1990–2019: A Systematic Analysis for the Global Burden of Disease Study 2019. The Lancet Neurology . 2021;20(10):795–820. doi: 10.1016/S1474-4422(21)00252-0. - DOI - PMC - PubMed
    1. Ghozy S., Zayan A. H., El-Qushayri A. E., et al. Physical Activity Level and Stroke Risk in US Population: A Matched Case-Control Study of 102,578 Individuals. Annals of Clinical and Translational Neurology . 2022;9(3):264–275. doi: 10.1002/acn3.51511. - DOI - PMC - PubMed
    1. Shani S. D., Varma R. P., Sarma P. S., Sylaja P. N., Kutty V. R. Life Style and Behavioural Factors are Associated With Stroke Recurrence Among Survivors of First Episode of Stroke: A Case Control Study. Journal of Stroke and Cerebrovascular Diseases . 2021;30(4) doi: 10.1016/j.jstrokecerebrovasdis.2021.105606.105606 - DOI - PubMed
    1. Lopez A. D., Murray C. C. J. L. The Global Burden of Disease, 1990–2020. Nature Medicine . 1998;4(11):1241–1243. doi: 10.1038/3218. - DOI - PubMed

Publication types

LinkOut - more resources