. 2025 Jul 8:7:1595065.
doi: 10.3389/fspor.2025.1595065. eCollection 2025.

Plantar flexors are the main engine of walking in healthy adults

Affiliations

Plantar flexors are the main engine of walking in healthy adults

Viviana Rota et al. Front Sports Act Living. .

Abstract

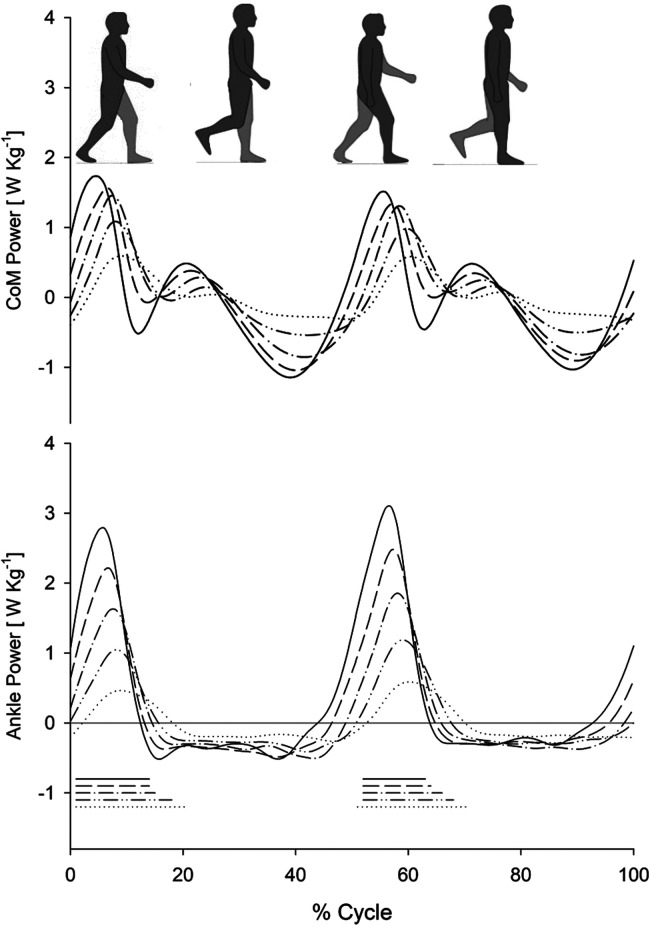
Introduction: The plantar flexors contribute to the uniqueness of man's walking across bipeds (including apes). This role is achieved in late infancy through neural maturation. This may explain why this mechanism is lost with all corticospinal lesions despite the spared power of plantar flexors in segmental motions. During adult human walking, the plantar flexor muscles at the rear limb, during double stance, are suspected to provide most of the work and power required to translate the body system, which can be represented mechanically by its centre of mass (CoM). However, direct evidence of the dominant role of the ankle muscles in CoM translation is scarce. Experimental evidence requires synchronously assessing the lower limb joints' and CoM's power.

Methods: In this work, ten healthy adults were requested to walk on a split-belt force treadmill at speeds ranging from 0.3 to 1.2 m s-1. A series of eight subsequent strides was analysed at each different speed. The synchronous analysis of ground reaction forces (through force platforms) and joint rotations (through an optoelectronic system) allowed us to simultaneously measure the CoM and the lower limb joints' power.

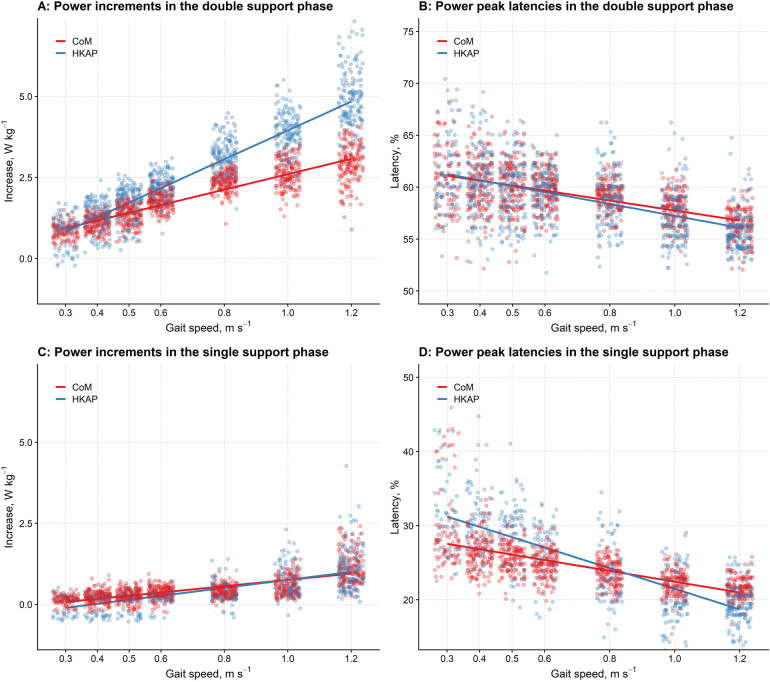
Results: The dominant role of the ankle plantar flexors, suggested by previous studies focusing on speeds above 0.9 m s-1, was confirmed by observing that changes in ankle power during the push-off phase (end of single stance and initial double stance) mirror the changes in power of the CoM. In the double support phase, the amplitude of the increments in ankle joint power was a strong predictor of the increments in CoM power (R 2 = 82%).

Discussion: Low walking speeds have been included to foster the interpretation of pathologic gaits, and clinical correlates of these findings in motor impairments are highlighted.

Clinical trial registration: ClinicalTrials.gov, identifier NCT05778474.

Keywords: centre of mass; foot; man; muscle power; neural maturation; walking.


Conflict of interest statement

The authors declare that the research was conducted in the absence of any commercial or financial relationships that could be construed as a potential conflict of interest. The author(s) declared that they were an editorial board member of Frontiers, at the time of submission. This had no impact on the peer review process and the final decision.

Figures

Figure 1
Figure 1
Com power and ankle power during treadmill walking at various speeds. Centre of mass power (CoM Power; upper panel:) and ankle power (lower panel) as a function of the gait cycle (%) at different walking speeds on a treadmill. Each curve represents the average curve from all ten participants who participated in the study at the corresponding speed. The different line types refer to the five speeds described in the plots: 1.2 m s−1 (solid line), 1.0 m s−1 (dashed line), 0.8 m s−1 (dash-dot line), 0.6 m s−1 (double dot-dash line), and 0.4 m s−1 (dotted line). The mean ± SD stride periods were 1.09 ± 0.06 s, 1.18 ± 0.07 s, 1.30 ± 0.11 s, 1.49 ± 0.13 s, and 1.85 ± 0.24 s, respectively. The horizontal segments at the bottom mark the periods of double foot contact with the ground during the gait cycle (line types recall the corresponding power curves).
Figure 2
Figure 2
CoM power and joint powers of the hip, knee and ankle during treadmill walking at different speeds. Centre of mass power (CoM Power, CP; first row from top, solid line), summed powers of the hip, knee, and ankle joints (Hip-Knee-Ankle Power, HKAP; first row from top, dashed line), hip power (second row), knee power (third row), and ankle power (fourth row) as a function of the gait cycle (%, abscissa) at different walking speeds on a treadmill (0.4, 0.8, and 1.2 m s−1 in the leftmost, middle and rightmost column, respectively). Each curve represents the average curve from all ten participants at a given speed. The HKAP curve has been obtained for each participant by summing the ankle, knee and hip curves at each instant. The black horizontal bars at the bottom of each column mark the periods of foot contact with the ground during the gait cycle. The double stance phases are identifiable by the overlap between the two black bars.
Figure 3
Figure 3
Relationship between the increments in CoM power and ankle power for individual participants and the whole sample in the double stance phase. The graphs report (y-axis) the increments of the CoM's power as a function of the increments in ankle power (x-axis) occurring in the double support phase at different walking speeds for the ten individual participants (“ID01” to “ID10”) and for the whole sample (“Whole sample”). Solid lines represent the regression lines from linear mixed-effects models, while grey dots refer to individual strides at different speeds. The identity line (i.e., bisector; dashed line) was added as a visual guide.
Figure 4
Figure 4
The differences in the power increments and peak latencies between the CoM's power and the combined powers of the hip, knee, and ankle joints at different gait speeds in the double and single support phases. (A,C): The graph reports (y-axis) the increments of the CoM's power (CP, red) and the summed powers of the hip, knee, and ankle joints (HKAP, blue) to the gait speed (x-axis) in the double support phase (A) and the single support phase (C) Regression lines from linear mixed-effects models with gait speed and CP increments vs. HKAP increments as predictors are given by dots representing partial residuals (45) of individual strides. For both the CP and the HKAP, the higher the gait speed, the larger the power increase. However, in the double support phase, the regression slope is significantly higher for HKAP, so HKAP is more remarkable for high gait speeds. Conversely, no difference is apparent for very low – low gait speeds (i.e. < 0.4 m/s). In the single support phase (C), the slope of the regression line is more prominent (i.e., the rate of increase is greater with increasing speeds) for HKAP compared to CP; at the walking speeds tested here, this difference was slightly more evident for slower speeds. (B,D): The graph reports (y-axis) the latencies of the CoM's power peak (CP, red dots) and the summed powers of the hip, knee, and ankle joints (HKAP, blue dots) to the gait speed (x-axis) in the double support phase (B) and the single support phase (D) Regression lines from linear mixed-effects models with gait speed and CoM latencies vs. HKAP latencies as predictors are given with dots representing partial residuals of individual strides. For both the CP and the HKAP, the higher the gait speed, the earlier the peaks in the double support phase (B) and the single support phase (D) As shown in B, in the double support phase, the latencies of CP and HKAP are superimposable for low gait speeds, while at higher speeds, the peak of HKAP occurs earlier than CP. However, this difference looks negligible at the walking speeds tested here, and it is more evident in the single support phase (D), where the slope of the regression line of HKAP shows a steeper reduction. Horizontal jittering has been used in the graphs to reduce data points overlapping.

Similar articles

  • The Black Book of Psychotropic Dosing and Monitoring.
    DeBattista C, Schatzberg AF. DeBattista C, et al. Psychopharmacol Bull. 2024 Jul 8;54(3):8-59. Psychopharmacol Bull. 2024. PMID: 38993656 Free PMC article. Review.
  • Ankle and Plantar Flexor Muscle-Tendon Unit Function in Sprinters: A Narrative Review.
    Crotty ED, Furlong LM, Harrison AJ. Crotty ED, et al. Sports Med. 2024 Mar;54(3):585-606. doi: 10.1007/s40279-023-01967-1. Epub 2023 Nov 21. Sports Med. 2024. PMID: 37989833 Review.
  • Short-Term Memory Impairment.
    Cascella M, Al Khalili Y. Cascella M, et al. 2024 Jun 8. In: StatPearls [Internet]. Treasure Island (FL): StatPearls Publishing; 2025 Jan–. 2024 Jun 8. In: StatPearls [Internet]. Treasure Island (FL): StatPearls Publishing; 2025 Jan–. PMID: 31424720 Free Books & Documents.
  • Rehabilitation for ankle fractures in adults.
    Lewis SR, Pritchard MW, Parker R, Searle HKC, Beckenkamp PR, Keene DJ, Bretherton C, Lin CC. Lewis SR, et al. Cochrane Database Syst Rev. 2024 Sep 23;9(9):CD005595. doi: 10.1002/14651858.CD005595.pub4. Cochrane Database Syst Rev. 2024. PMID: 39312389
  • Sexual Harassment and Prevention Training.
    Cedeno R, Bohlen J. Cedeno R, et al. 2024 Mar 29. In: StatPearls [Internet]. Treasure Island (FL): StatPearls Publishing; 2025 Jan–. 2024 Mar 29. In: StatPearls [Internet]. Treasure Island (FL): StatPearls Publishing; 2025 Jan–. PMID: 36508513 Free Books & Documents.

References

    1. Alexander RM. Walking made simple. Science (1979). (2005) 308(5718):58–9. 10.1126/science.1111110 - DOI - PubMed
    1. Mochon S, McMahon TA. Ballistic walking. J Biomech. (1980) 13(1):49–57. 10.1016/0021-9290(80)90007-X - DOI - PubMed
    1. Cavagna GA, Heglund NC, Taylor CR. Mechanical work in terrestrial locomotion: two basic mechanisms for minimizing energy expenditure. Am J Physiol. (1977) 233(5):R243–61. 10.1152/ajpregu.1977.233.5.R243 - DOI - PubMed
    1. Tesio L, Rota V. The motion of body center of mass during walking: a review oriented to clinical applications. Front Neurol. (2019) 10:999. 10.3389/fneur.2019.00999 - DOI - PMC - PubMed
    1. Zelik KE, Adamczyk PG. A unified perspective on ankle push-off in human walking. J Exp Biol. (2016) 219(Pt 23):3676–83. 10.1242/jeb.140376 - DOI - PMC - PubMed

Associated data

LinkOut - more resources