. 2025 Jul 8:12:1614114.
doi: 10.3389/fnut.2025.1614114. eCollection 2025.

Transcriptomic and metabolomic insights into the synergistic effects of resveratrol and β-hydroxy-β-methylbutyric acid on hepatic function under varying protein diets in Tibetan sheep

Affiliations

Transcriptomic and metabolomic insights into the synergistic effects of resveratrol and β-hydroxy-β-methylbutyric acid on hepatic function under varying protein diets in Tibetan sheep

Yu Zhang et al. Front Nutr. .

Abstract

Background: Increasing evidence indicated resveratrol (RES) and β-hydroxy-β-methylbutyric acid (HMB) regulated several biological processes via modulating gene expression. This study employed transcriptomic and metabolomic analyses to investigate the impact of RES and HMB supplementation, in combination with varying dietary protein levels on hepatic immunity, antioxidant capacity, and morphology in Tibetan sheep.

Methods: Two treatments (with or without RES and HMB supplementation) and two dietary protein levels (12% vs. 14% of the basal diet) were tested according to a 2 × 2 factorial arrangement within a Latin square design. A total of 120 healthy two-month-old male Tibetan lambs (16.87 ± 0.31 kg) were randomly allocated for 90-day feeding experiment, with the following treatments: low-protein basal diet without (L group) or with (L-RES + HMB group) supplemental 1.50 g/d RES and 1.25 g/d HMB, and high-protein basal diet without (H group) or with (H-RES + HMB group) supplemental 1.50 g/d RES and 1.25 g/d HMB.

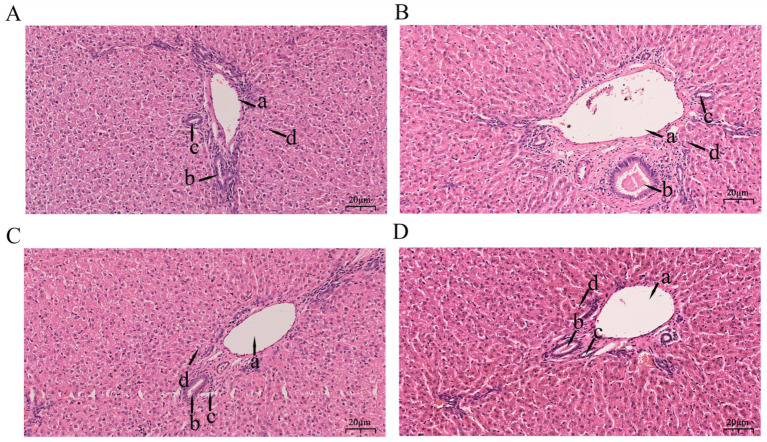
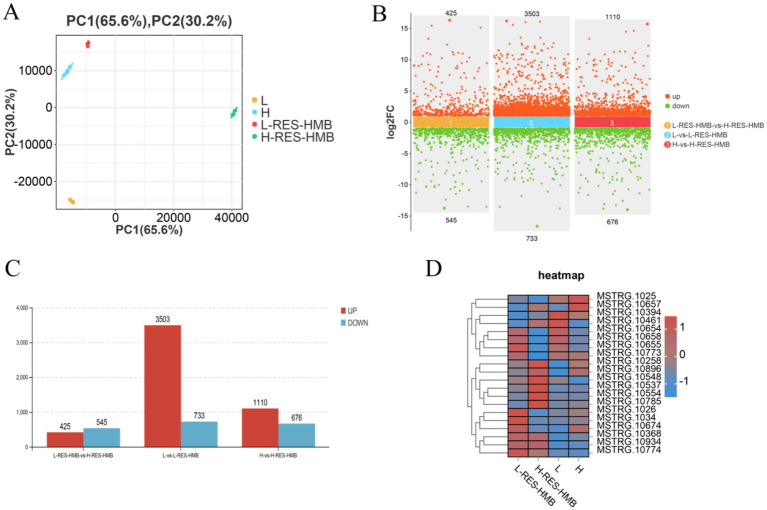
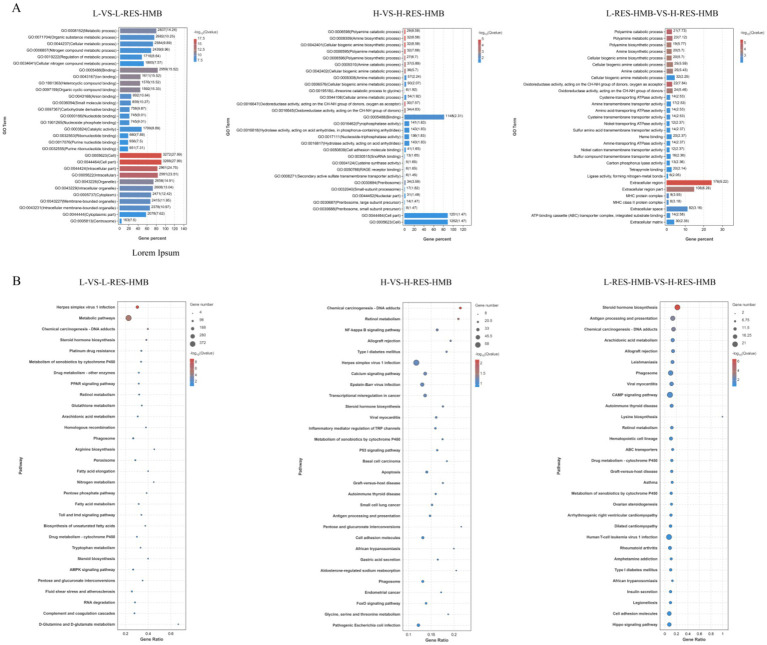
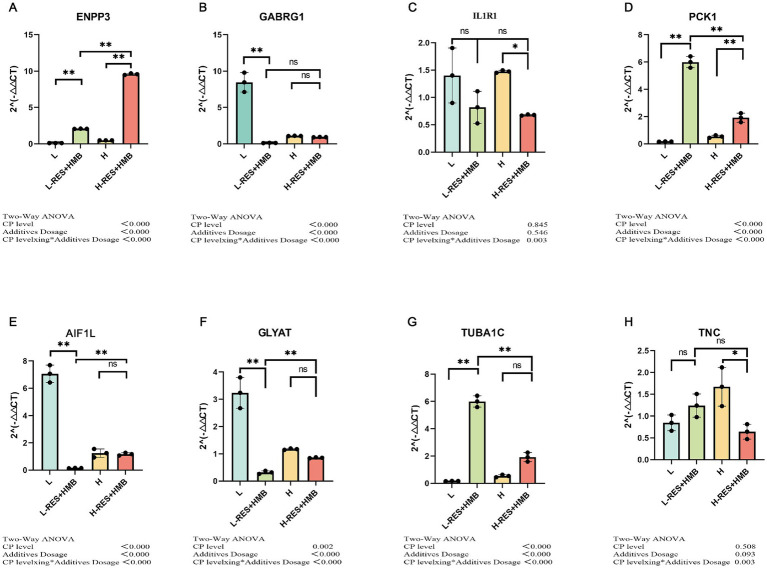
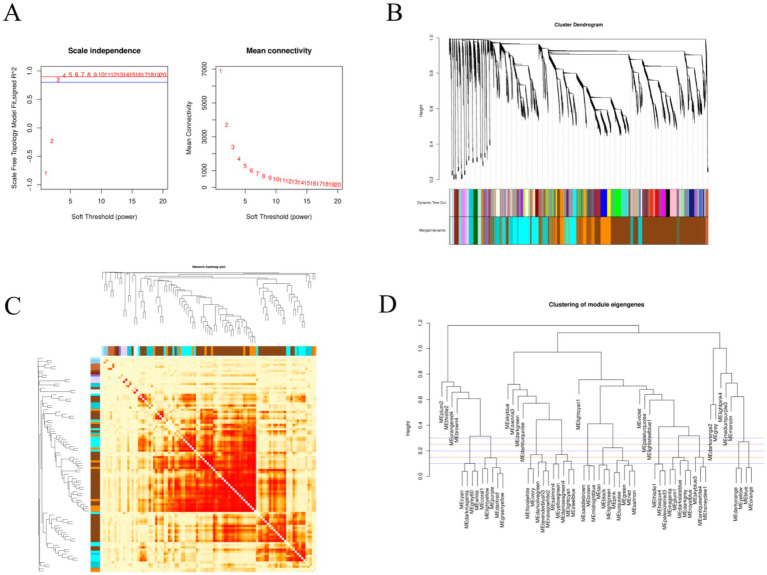
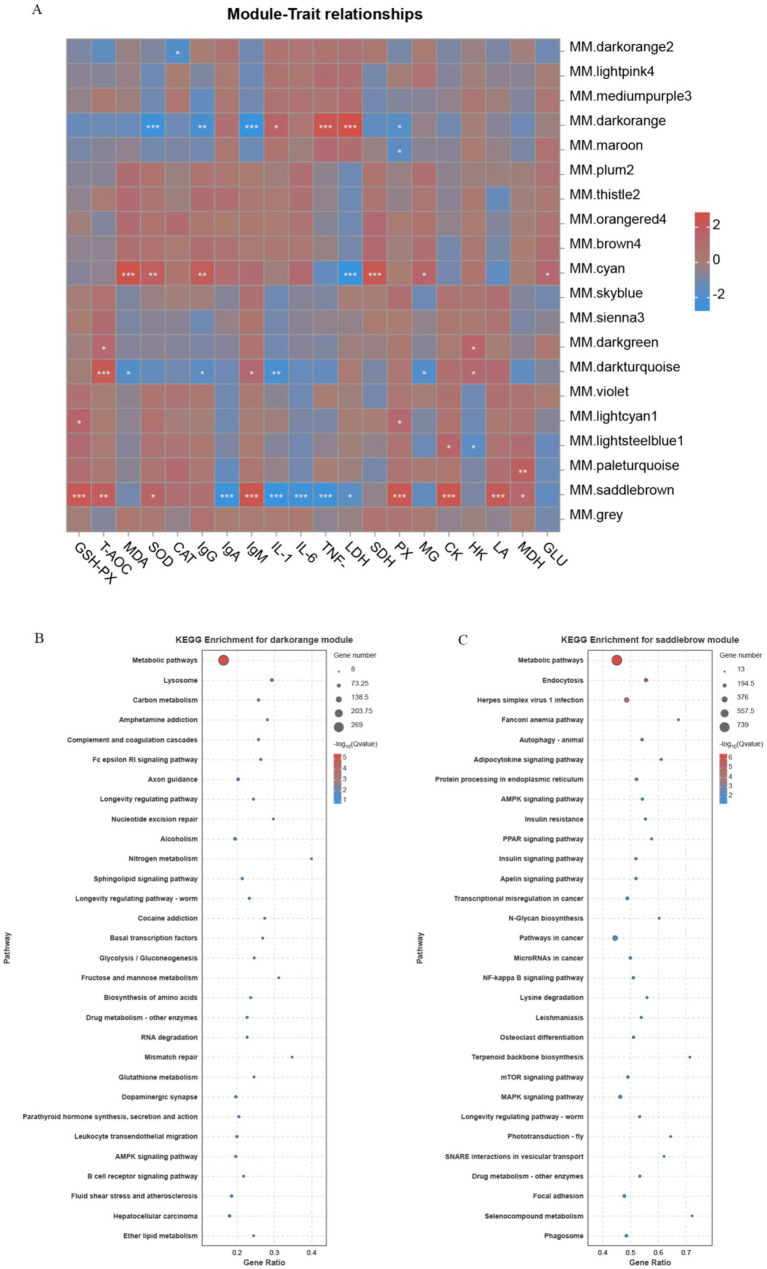
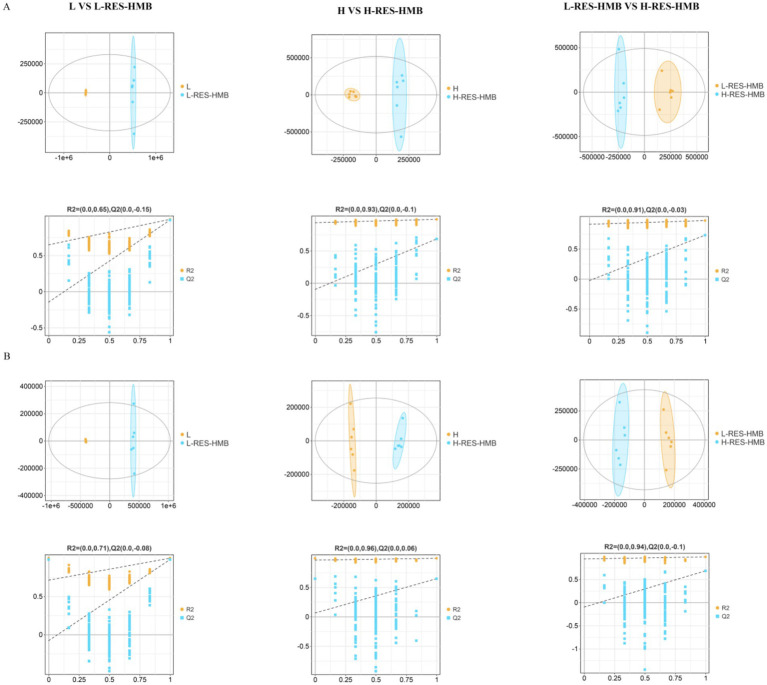
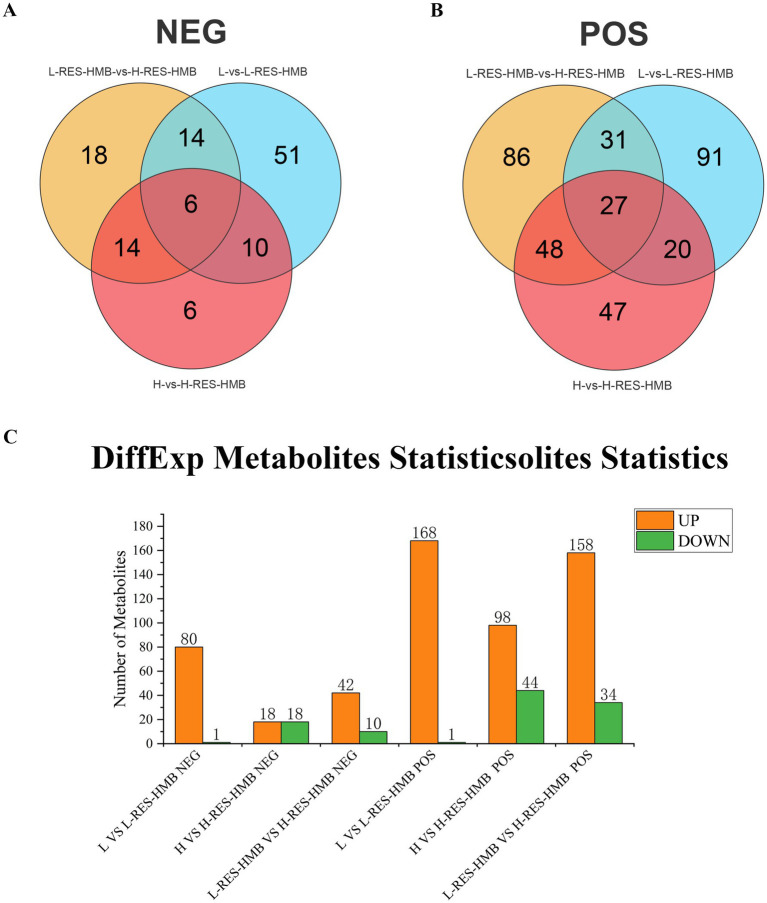
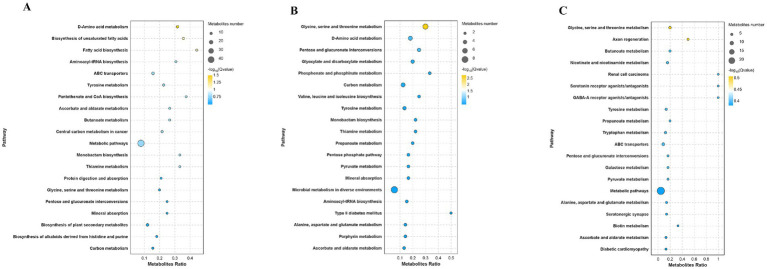
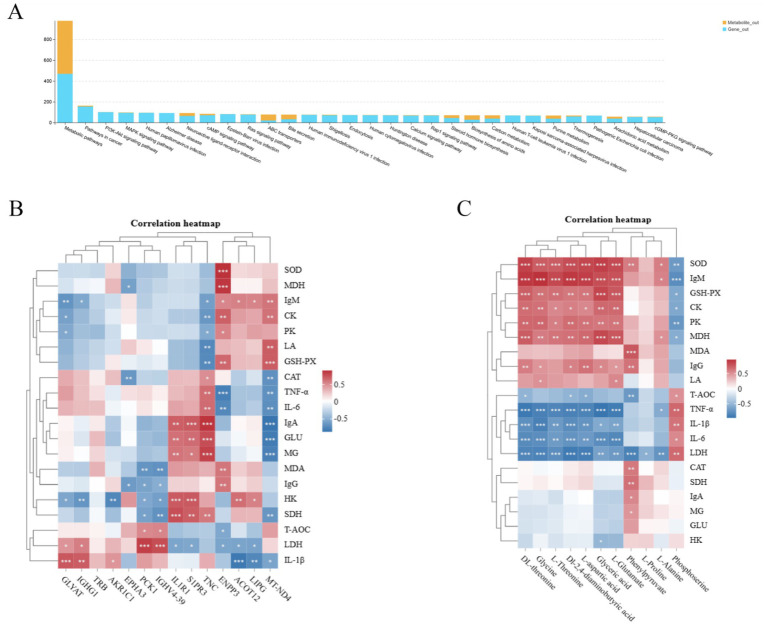
Results: The results indicated that the liver tissue structure was predominantly normal in the H-RES + HMB group, devoid of central vein congestion. The catalase (CAT) activity and total antioxidant (T-AOC) capacity were significantly increased when fed the 14% protein diet (p < 0.05). The superoxide dismutase (SOD) and CAT activities of sheep fed supplementary-treated diets were significantly increased than the basal diet (p < 0.05). Immunoglobulin M (IgM) level and tumor necrosis factor-alpha (TNF-α) activity in the H-RES + HMB group were significantly increased than those in the H and L groups (p < 0.05), whereas interleukin-1 beta (IL-1β) levels were significantly lower (p < 0.05). A total of 4,236 differentially expressed genes (DEGs) were identified, including 3,503 upregulated genes and 733 downregulated genes, which were categorized into immune-related KEGG signaling pathways. Metabolomic analysis identified that compared to L group, the abundance of 918 metabolites were significantly changed in H-RES + HMB group including 829 upregulated and 89 downregulated. Those differential metabolites enriched in KEGG pathways primarily related to immunity and antioxidation.

Conclusion: Dietary protein level and RES/HMB supplementation exhibited positively interaction effect on immunity and antioxidant capacity. The 14% protein diet with RES and HMB improved the hepatic function through modulating the gene and metabolite in Tibetan sheep.

Keywords: Tibetan sheep; liver; metabolome; resveratrol; transcriptome; β-hydroxy-β-methylbutyric acid.


Conflict of interest statement

The authors declare that the research was conducted in the absence of any commercial or financial relationships that could be construed as a potential conflict of interest.

Figures

Figure 1
Figure 1
Stained section of liver tissue of Tibetan sheep fed with different levels of resveratrol and HMB. Panel (A) is the 12% basal diet (L Group), Panel (B) is the 12% basal diet + resveratrol (1.5 g/day) + β-hydroxy-β-methylbutyrate (1.25 g/day) (L-RES-HMB Group), Panel (C) is the 14% basal diet (H Group), and Panel (D) is the 14% basal diet + resveratrol (1.5 g/day) + β-hydroxy-β-methylbutyrate (1.25 g/day) (H-RES-HMB Group). HE staining, 2001×. a: Interlobular vein; b: Interlobular bile duct; c: Interlobular artery; d: Hepatic sinusoid.
Figure 2
Figure 2
Transcriptome analysis of Tibetan sheep fed with different levels of resveratrol and HMB. (A) PCA analysis was conducted on samples from Group L, L-RES + HMB, H, and H-RES + HMB. Each dot in the graph represents an individual liver sample (n = 4 per group). A principal component analysis (PCA) reveals a clear separation between the groups, indicating distinct transcriptome characteristics between each group. (B) The differences in gene expression among the four groups are represented in a scatter plot. The x-axis represents the log2 fold change in gene expression between groups, while the y-axis shows the -log10 transformed adjusted p-value (Benjamini–Hochberg correction). (C) The number of upregulated and downregulated DEGs is depicted when comparing Group L to L-RES + HMB, Group H to H-RES + HMB, and Group L-RES + HMB to H-RES + HMB. (D) Heatmap analysis of the DEGs identified across the 16 sequenced libraries, with upregulated and downregulated genes displayed in red and blue, respectively.
Figure 3
Figure 3
Functional enrichment analysis of Tibetan sheep fed with different levels of resveratrol and HMB. (A) GO enrichment bars of the enriched differential genes, with the ordinate indicating the GO terms. (B) Bubble plot of the top 20 KEGG pathways with ordinate indicating pathway.
Figure 4
Figure 4
qRT-PCR analysis. qRT-PCR results were consistent with RNA-seq data. (A) ENPP3; (B) GABRG1; (C) IL1R1; (D) PCK1; (E) AIF1L; (F) GLYAT; (G) TUBA1C; (H) TNC. *This generally indicates a statistically significant difference at the p < 0.05 level. **This typically indicates a highly statistically significant difference at the p < 0.01 level. (not significant): This indicates that there was no statistically significant difference between the groups being compared.
Figure 5
Figure 5
WGCNA analysis. (A) The left panel shows the scale-free fit index analysis for various soft thresholding powers, and the right panel shows the average connectivity analysis for various soft thresholding powers. (B) The RNA dynamic cutting cluster tree, where each color represents a module. The colors in the first row are the results of the initial clustering, and the colors in the second row are the results after module merging. (C) A heatmap of the co-expression module network (increasingly saturated red indicates a higher degree of overlap between functional modules). The rows and columns of the matrix represent different genes. (D) A module clustering diagram; the first red line is at a height of 0.25, and the modules below the red line are those that are more similar and need to be merged.
Figure 6
Figure 6
Correlation heatmap of module genes with traits and KEGG enrichment results. (A) The vertical coordinate on the right represents a set of co-expressed genes within each module; the darker the color in the heatmap, the closer the absolute value of the correlation coefficient is to 1, indicating that the gene module on the right is more closely related to the biological traits below. Panels (B,C) show the bubble charts of the top 20 KEGG pathway enrichments, with the vertical coordinate indicating the pathways.
Figure 7
Figure 7
The level of liver metabolites of Tibetan sheep fed with different levels of resveratrol and HMB. (A) In positive ion mode, the OPLS-DA plots for Group L vs. L-RES-HMB, Group H vs. H-RES-HMB, and Group L-RES-HMB vs. H-RES-HMB are shown. The x-axis represents the predictive component score values, which are used to display the differences between groups, and the y-axis represents the orthogonal component score values, which are used to display the differences between groups. The second row shows the permutation test plots, which are used to assess the accuracy of the OPLS-DA, with the y-axis representing the R2Y or Q2 values and the x-axis representing the permutation retention rate. (B) In negative ion mode, the OPLS-DA plots for Group L vs. L-RES-HMB, Group H vs. H-RES-HMB, and Group L-RES-HMB vs. H-RES-HMB are shown. The rest is the same as in (A).
Figure 8
Figure 8
LC-MS/MS analysis of Tibetan sheep fed with different levels of resveratrol and HMB. (A) The Wayn diagram shows three comparisons (L versus L-RES-HMB; H versus H-RES-HMB; L-RES-HMB versus H-RES-HMB) NEG metabolites. (B) The En diagram shows three comparisons (L versus L-RES-HMB; H versus H-RES-HMB; L-RES-HMB versus H-RES-HMB) POS metabolites. (C) Number of up/down regulated metabolites in different comparison groups in POS and NEG modes.
Figure 9
Figure 9
Metabolic pathway enrichment analysis of Tibetan sheep fed with different levels of resveratrol and HMB. In the metabolic pathway enrichment analysis, the size of the bubbles indicates the number of differential metabolites enriched in the pathways, and the color of the bubbles represents the significance of enrichment in the pathways, with larger values indicating more significant enrichment. (A) Enrichment analysis between Group L and L-RES-HMB. (B) Enrichment analysis between Group H and H-RES-HMB. (C) Enrichment analysis between Group L-RES-HMB and H-RES-HMB.
Figure 10
Figure 10
Correlation analysis of pathways, transcribed genes, and metabolites in Tibetan sheep fed with resveratrol and HMB. (A) Pathway correlation analysis histograms; (B) transcribed genes versus kit metrics heat map correlation analysis; (C) metabolites versus kit metrics heat map correlation analysis.

Similar articles

References

    1. Gao C, Peng J. All routes lead to Rome: multifaceted origin of hepatocytes during liver regeneration. Cell Regen. (2021) 10:2. doi: 10.1186/s13619-020-00063-3, PMID: - DOI - PMC - PubMed
    1. Han H, Zhang T, Jin Z, Guo H, Wei X, Liu Y, et al. Blood glucose concentration and risk of liver Cancer: systematic review and Meta-analysis of prospective studies. Oncotarget. (2017) 8:50164–73. doi: 10.18632/oncotarget.16816, PMID: - DOI - PMC - PubMed
    1. Nozière P, Ortigues-Marty I, Loncke C, Sauvant D. Carbohydrate quantitative digestion and absorption in ruminants: from feed starch and fibre to nutrients available for tissues. Animal. (2010) 4:1057–74. doi: 10.1017/s1751731110000844, PMID: - DOI - PubMed
    1. Izzo C, Annunziata M, Melara G, Sciorio R, Dallio M, Masarone M, et al. The role of resveratrol in liver disease: a comprehensive review from in vitro to clinical trials. Nutrients. (2021) 13:933. doi: 10.3390/nu13030933, PMID: - DOI - PMC - PubMed
    1. Yang G, Tao L, Xiong Z, Lin W, Teng L, Zhang X. Resveratrol mitigates oxidative stress and suppresses HBV replication via modulation of the SIRT1-Nrf2 pathway in liver cells. Future Virol. (2025) 20:83–92. doi: 10.1080/17460794.2025.2478750 - DOI

LinkOut - more resources