. 2025 Jul 15;16(7):104789.
doi: 10.4239/wjd.v16.i7.104789.

Predictive model and risk analysis for outcomes in diabetic foot ulcer using eXtreme Gradient Boosting algorithm and SHapley Additive exPlanation

Affiliations

Predictive model and risk analysis for outcomes in diabetic foot ulcer using eXtreme Gradient Boosting algorithm and SHapley Additive exPlanation

Lei Gao et al. World J Diabetes. .

Abstract

Background: Diabetic foot ulcer (DFU) is a serious and destructive complication of diabetes, which has a high amputation rate and carries a huge social burden. Early detection of risk factors and intervention are essential to reduce amputation rates. With the development of artificial intelligence technology, efficient interpretable predictive models can be generated in clinical practice to improve DFU care.

Aim: To develop and validate an interpretable model for predicting amputation risk in DFU patients.

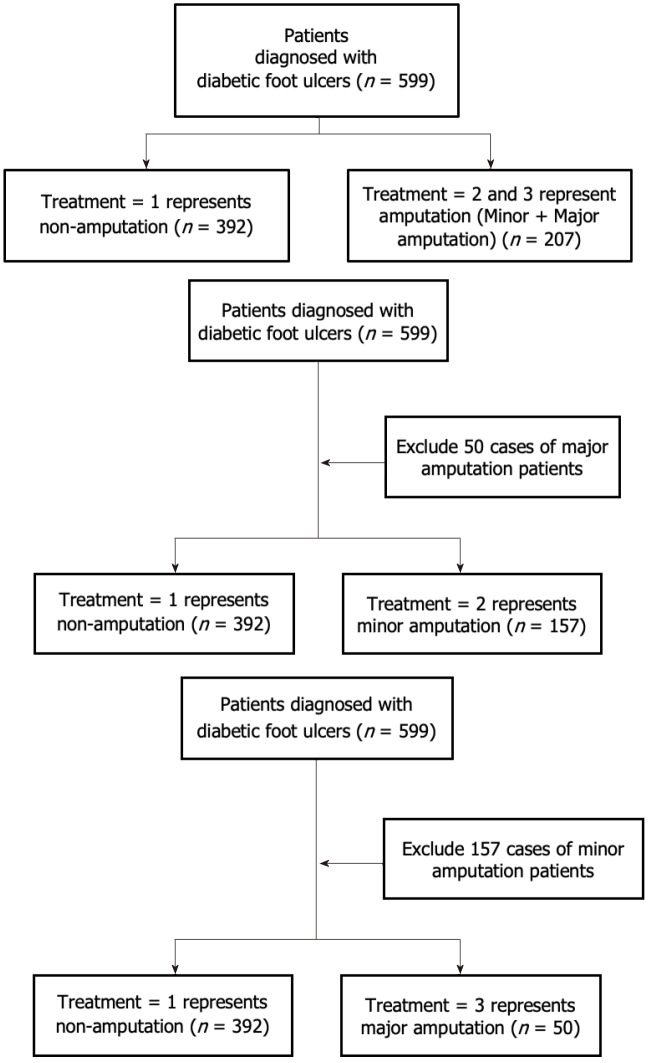
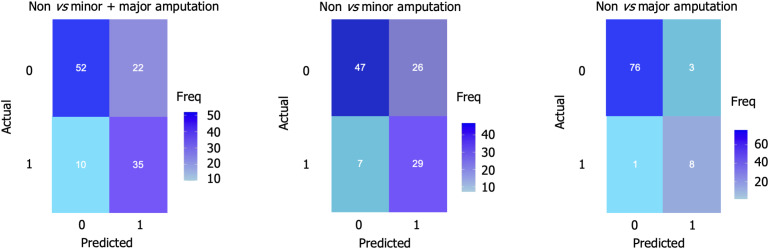
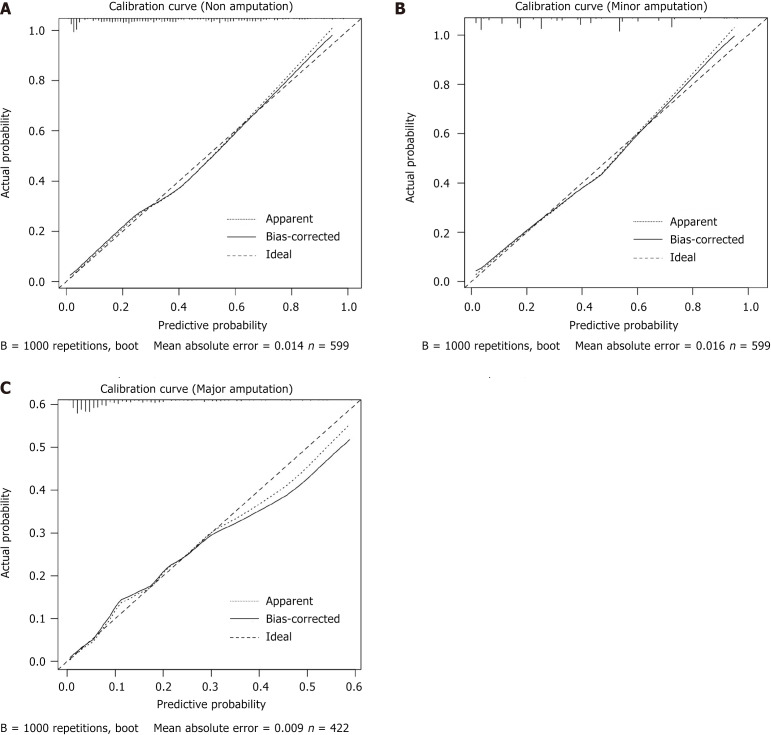
Methods: This retrospective study collected basic data from 599 patients with DFU in Beijing Shijitan Hospital between January 2015 and June 2024. The data set was randomly divided into a training set and test set with fivefold cross-validation. Three binary variable models were built with the eXtreme Gradient Boosting (XGBoost) algorithm to input risk factors that predict amputation probability. The model performance was optimized by adjusting the super parameters. The predictive performance of the three models was expressed by sensitivity, specificity, positive predictive value, negative predictive value and area under the curve (AUC). Visualization of the prediction results was realized through SHapley Additive exPlanation (SHAP).

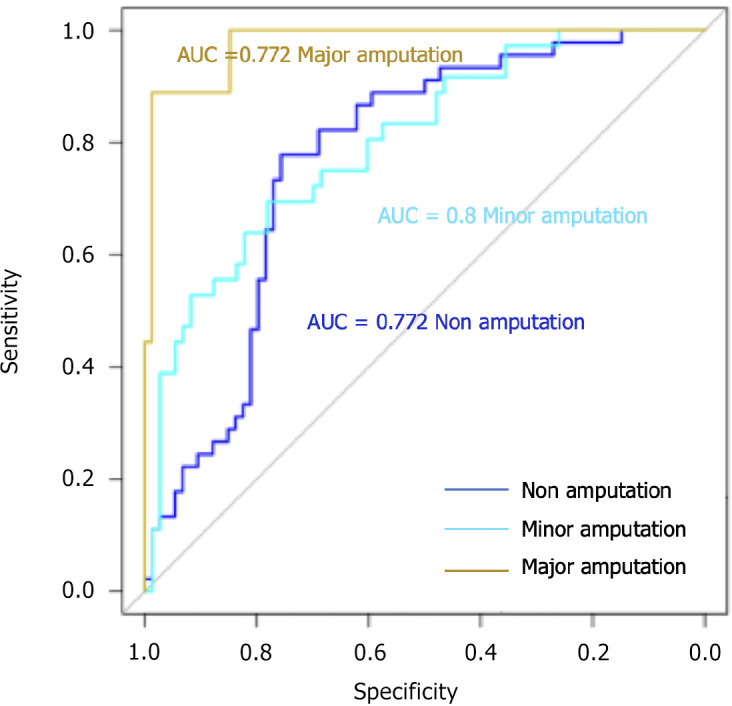
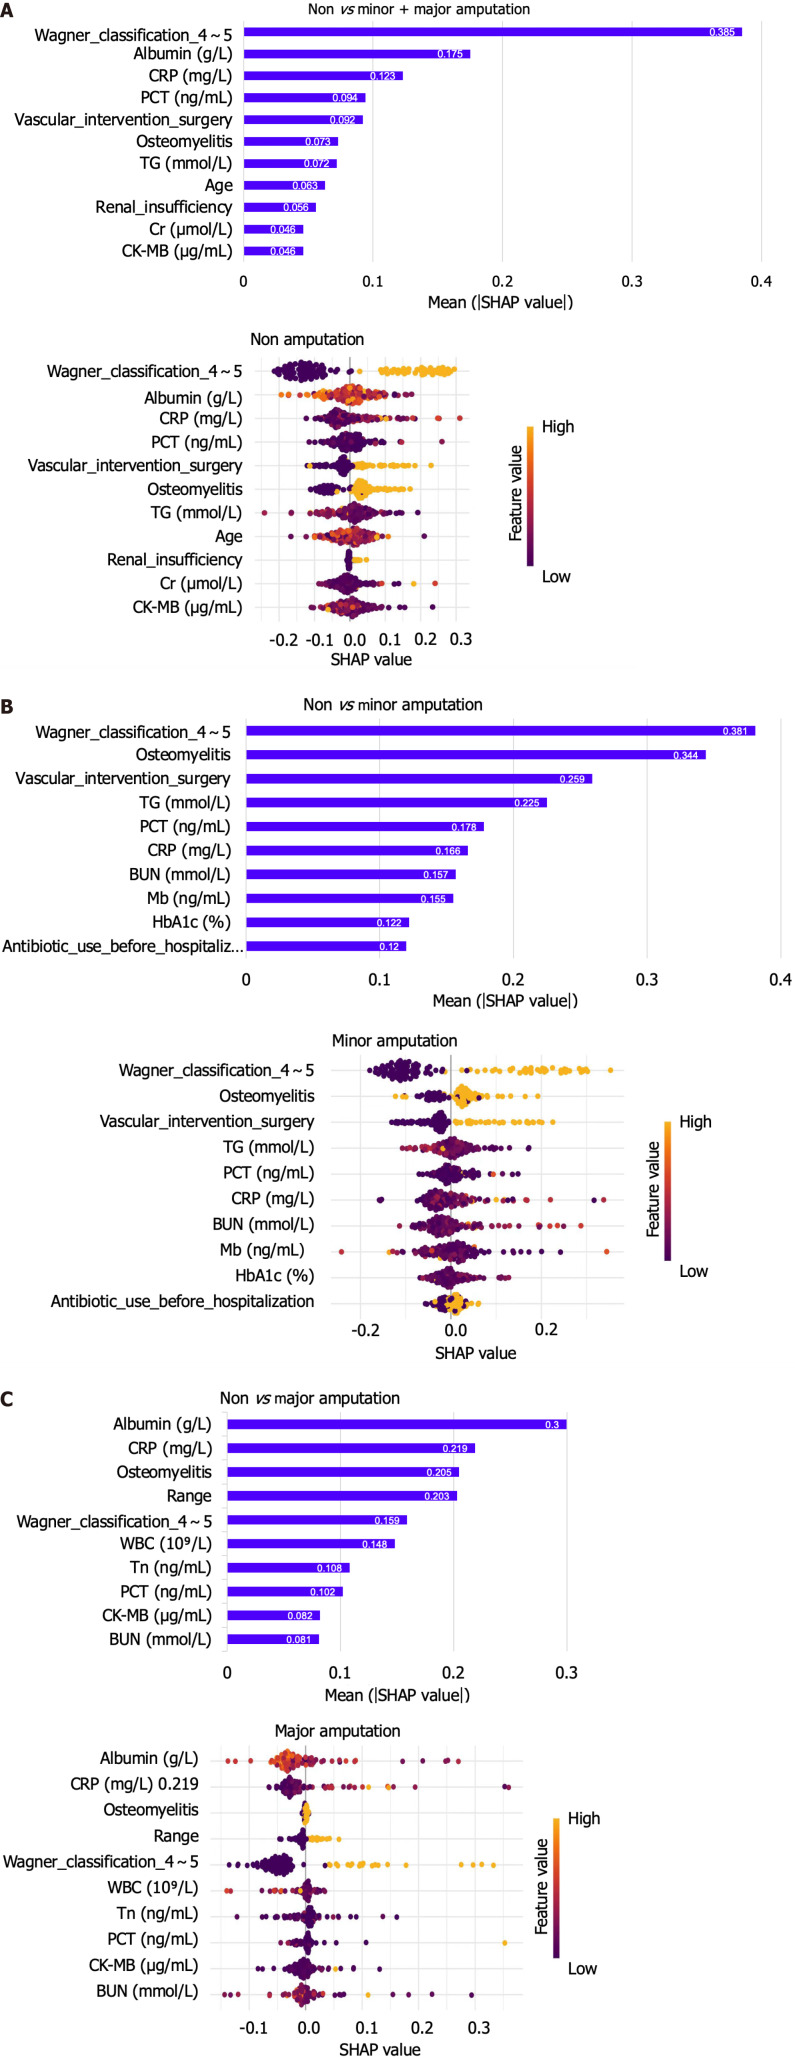
Results: A total of 157 (26.2%) patients underwent minor amputation during hospitalization and 50 (8.3%) had major amputation. All three XGBoost models demonstrated good discriminative ability, with AUC values > 0.7. The model for predicting major amputation achieved the highest performance [AUC = 0.977, 95% confidence interval (CI): 0.956-0.998], followed by the minor amputation model (AUC = 0.800, 95%CI: 0.762-0.838) and the non-amputation model (AUC = 0.772, 95%CI: 0.730-0.814). Feature importance ranking of the three models revealed the risk factors for minor and major amputation. Wagner grade 4/5, osteomyelitis, and high C-reactive protein were all considered important predictive variables.

Conclusion: XGBoost effectively predicts diabetic foot amputation risk and provides interpretable insights to support personalized treatment decisions.

Keywords: Amputation risk stratification; Clinical risk prediction; Diabetic foot ulcer; Machine learning; SHapley Additive exPlanation; eXtreme Gradient Boosting.


Conflict of interest statement

Conflict-of-interest statement: The authors declare that they have no conflicts of interest.

Figures

Figure 1
Figure 1
Multi-classification grouping flow chart of amputation prediction for diabetic foot ulcer patients.
Figure 2
Figure 2
Receiver operating characteristic curves of the multi-category classification model. AUC: Area under the curve.
Figure 3
Figure 3
Confusion matrix of three classification models based on eXtreme Gradient Boosting. Different colors represent different frequencies, with the horizontal axis representing predicted values and the vertical axis representing actual values.
Figure 4
Figure 4
Calibration curves for three classification models. A: Calibration curves for non-amputation model; B: Calibration curves for minor amputation model; C: Calibration curves for major amputation model. Apparent calibration (dotted line): This curve represents the raw, uncorrected calibration of the predicted probabilities of the model against the actual probabilities. The predictions of the model are plotted directly, and the apparent curve often deviates from the ideal (diagonal) line, indicating some level of bias in the model’s prediction. Bias-corrected calibration (solid line): This curve corrects for the bias observed in the apparent calibration curve. It adjusts the predictions to improve alignment with the observed outcomes, reducing the systematic under- or overestimation of probabilities. Ideal calibration (dashed line): This represents perfect calibration, where the predicted probabilities perfectly match the actual probabilities. In an ideally calibrated model, the curve would coincide with the dashed line, indicating perfect agreement between predicted and observed probabilities. Mean absolute error (0.009): The calculated error value indicates the average discrepancy between the predicted probabilities and the actual outcomes. A lower value (such as 0.009 in this case) suggests good calibration, with minor deviations between predicted and actual probabilities. B = 1000 repetitions, boot: This suggests that bootstrapping was used to calculate confidence intervals and improve the stability of the calibration curve, based on 1000 resampling iterations.
Figure 5
Figure 5
The weights of variable importance and the Beeswarm diagram drawn by SHapley Additive exPlanation to explain the three classification models. A: The weights of variable importance and the Beeswarm diagram drawn by SHapley Additive explanation (SHAP) to explain the non-amputation model; B: The weights of variable importance and the Beeswarm diagram drawn by SHAP to explain the Minor amputation model; C: The weights of variables importance and the Beeswarm diagram drawn by SHAP to explain the Major amputation model. The values in the bar chart represent the contribution value of each feature, the colors in SHAP value represent the level of correlation, and the left side of 0 represents negative correlation, while the right side represents positive correlation. SHAP: SHapley Additive exPlanation.

Similar articles

References

    1. Gong H, Ren Y, Li Z, Zha P, Bista R, Li Y, Chen D, Gao Y, Chen L, Ran X, Wang C. Clinical characteristics and risk factors of lower extremity amputation in the diabetic inpatients with foot ulcers. Front Endocrinol (Lausanne) 2023;14:1144806. - PMC - PubMed
    1. Rathnayake A, Saboo A, Malabu UH, Falhammar H. Lower extremity amputations and long-term outcomes in diabetic foot ulcers: A systematic review. World J Diabetes. 2020;11:391–399. - PMC - PubMed
    1. Armstrong DG, Boulton AJM, Bus SA. Diabetic Foot Ulcers and Their Recurrence. N Engl J Med. 2017;376:2367–2375. - PubMed
    1. Jeffcoate WJ, Vileikyte L, Boyko EJ, Armstrong DG, Boulton AJM. Current Challenges and Opportunities in the Prevention and Management of Diabetic Foot Ulcers. Diabetes Care. 2018;41:645–652. - PubMed
    1. Dutra LMA, Melo MC, Moura MC, Leme LAP, De Carvalho MR, Mascarenhas AN, Novaes MRCG. Prognosis of the outcome of severe diabetic foot ulcers with multidisciplinary care. J Multidiscip Healthc. 2019;12:349–359. - PMC - PubMed