

Examining gut microbiota and metabolites to clarify mechanisms of Dimocarpus longan Lour leaf components against type 2 diabetes
- PMID: 40697601
- PMCID: PMC12278076
- DOI: 10.4239/wjd.v16.i7.104512
Examining gut microbiota and metabolites to clarify mechanisms of Dimocarpus longan Lour leaf components against type 2 diabetes
Abstract
Background: Dimocarpus longan Lour leaf components (DLC) contain key active compounds such as quercetin, kaempferol, and quercitrin. They are effective for managing type 2 diabetes mellitus (T2DM), though the exact mechanism by which DLC acts remains unclear.
Aim: To investigate the material basis and mechanism underlying the therapeutic effect of DLC in T2DM.
Methods: T2DM was triggered in rats using a high-sugar, high-fat diet alongside 35 mg/kg streptozotocin. The effect of DLC on the intestinal microbiota in T2DM rats was analyzed via 16S rDNA sequencing. Targeted metabolomics was conducted to evaluate the impact of DLC on the levels of nine short-chain fatty acids (SCFAs). Untargeted metabolomics examined DLC-induced alterations in fecal metabolites and associated metabolic pathways. Additionally, Spearman's correlation analysis assessed gut microbiota and fecal metabolite relationships.
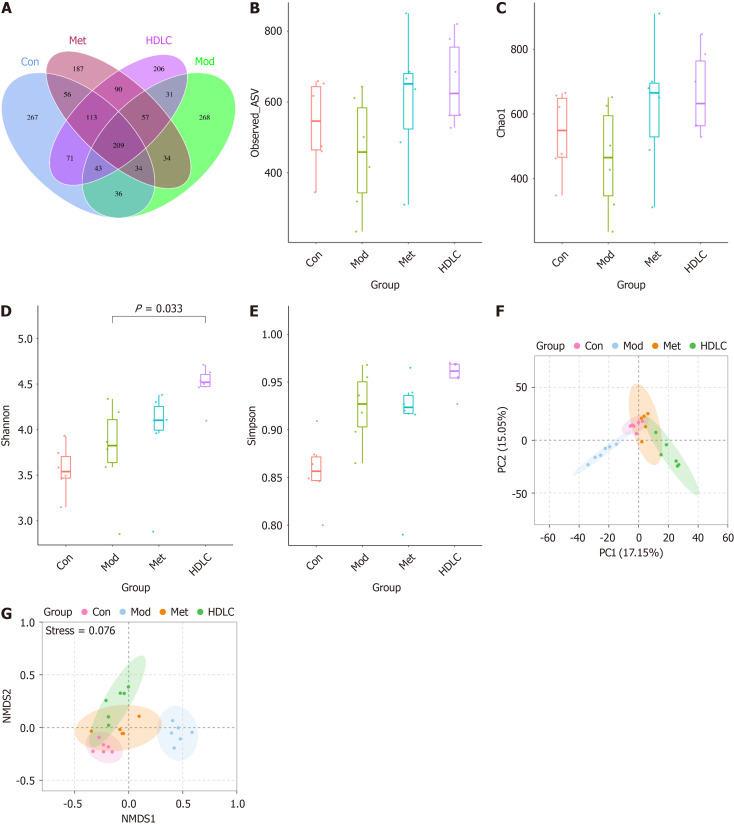
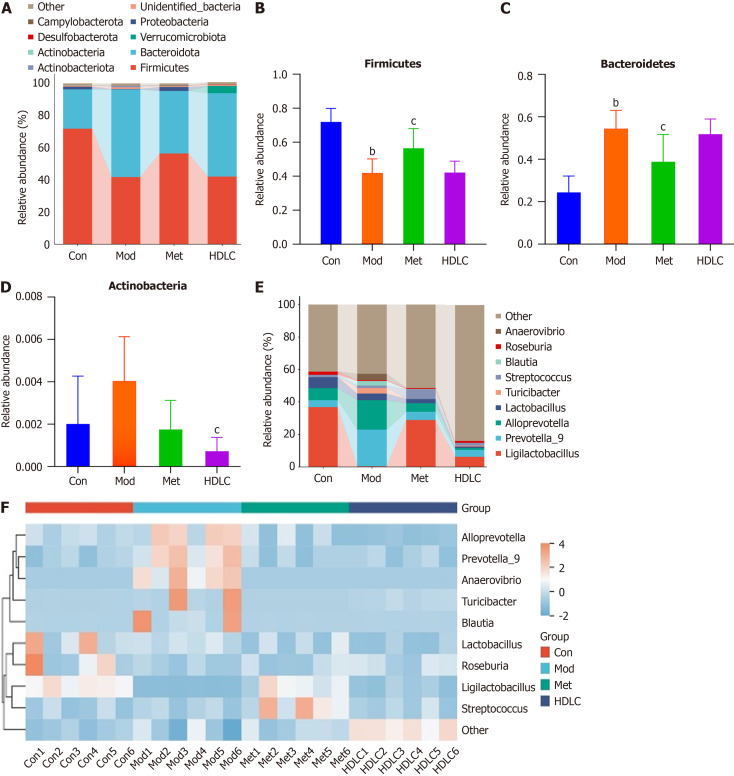
Results: DLC significantly attenuated pathological weight loss, reduced fasting blood glucose levels, restored blood sugar homeostasis, and ameliorated dyslipidemia in T2DM rats. The 16S rDNA sequencing revealed that DLC enhanced microbial diversity and reversed intestinal dysbiosis. Targeted metabolomics indicated decreased acetic acid and propionic acid levels and increased butyric acid, isobutyric acid, and 2-methylbutyric acid levels after DLC treatment. Untargeted metabolomics revealed 57 metabolites with altered expression associated with amino acid, carbohydrate, purine, and biotin pathways. The Spearman analysis demonstrated significant links between specific gut microbiota taxa and fecal metabolites.
Conclusion: DLC may exert hypoglycemic effects by modulating intestinal flora genera, SCFA levels, and fecal metabolites.
Keywords: 16S rDNA sequencing; Dimocarpus longan Lour leaf components; Metabolomics; Short-chain fatty acids; Type 2 diabetes.
©The Author(s) 2025. Published by Baishideng Publishing Group Inc. All rights reserved.
Conflict of interest statement
Conflict-of-interest statement: All the authors report no relevant conflicts of interest for this article.
Figures


Similar articles
-
Animal studies on the modulation of differential efficacy of polyethylene glycol loxenatide by intestinal flora.Front Endocrinol (Lausanne). 2025 Jun 19;16:1508473. doi: 10.3389/fendo.2025.1508473. eCollection 2025. Front Endocrinol (Lausanne). 2025. PMID: 40612440 Free PMC article.
-
Effects of a veterinary gastrointestinal diet on fecal characteristics, metabolites, and microbiota concentrations of adult cats treated with metronidazole.J Anim Sci. 2024 Jan 3;102:skae274. doi: 10.1093/jas/skae274. J Anim Sci. 2024. PMID: 39279199
-
Study on the modulation of kidney and liver function of rats with diabetic nephropathy by Huidouba through metabolomics.J Ethnopharmacol. 2025 Jul 24;351:120136. doi: 10.1016/j.jep.2025.120136. Epub 2025 Jun 11. J Ethnopharmacol. 2025. PMID: 40513925
-
Role of the intestinal flora-immunity axis in the pathogenesis of rheumatoid arthritis-mechanisms regulating short-chain fatty acids and Th17/Treg homeostasis.Mol Biol Rep. 2025 Jun 21;52(1):617. doi: 10.1007/s11033-025-10714-w. Mol Biol Rep. 2025. PMID: 40544212 Review.
-
Effects of Nut Intake on Gut Microbiome Composition and Gut Function in Adults: A Systematic Review and Meta-analysis.Adv Nutr. 2025 Jul;16(7):100465. doi: 10.1016/j.advnut.2025.100465. Epub 2025 Jun 13. Adv Nutr. 2025. PMID: 40518048 Free PMC article. Review.
References
-
- Santonocito S, Polizzi A, Marchetti E, Dalessandri D, Migliorati M, Lupi SM, Cicciù M, Isola G. Impact of Periodontitis on Glycemic Control and Metabolic Status in Diabetes Patients: Current Knowledge on Early Disease Markers and Therapeutic Perspectives. Mediators Inflamm. 2022;2022:4955277. - PMC - PubMed
-
- Saeedi P, Petersohn I, Salpea P, Malanda B, Karuranga S, Unwin N, Colagiuri S, Guariguata L, Motala AA, Ogurtsova K, Shaw JE, Bright D, Williams R IDF Diabetes Atlas Committee. Global and regional diabetes prevalence estimates for 2019 and projections for 2030 and 2045: Results from the International Diabetes Federation Diabetes Atlas, 9(th) edition. Diabetes Res Clin Pract. 2019;157:107843. - PubMed
-
- Liang J, Yu L, Liu XF, Sun ZY. [Experimental Study on the Hypoglycemic Effects of Different Extracts from the Leaves of Dimocarpus longan Lour. Shizhen Guoyiguoyao. 2013;24:2057–2058.
-
- Huang GQ, Liang J, Wei JY, Huang DF, Lin J, Chen XS, Liu XF. [Analysis and Identification of Chemical Constituents in Hypoglycemic Effective Fractions of Longan Folium Based on UPLC-Q-Orbitrap HRMS] Zhongguo Shiyan Fangjixue Zazhi. 2021;27:127–138.
-
- Hu J, Liang J, Li P, Chen KK, Cao YF, Liu ZJ, Liang JC, An SJ, Liu XF. [Metabolism Analysis of Ethyl Acetate Fractions of Leaves of Longyan (Dimocarpus longan Lour.) in vivo Based on UHPLC-Q-Orbi trap MS] Zhonghua Zhongyiyao Xuekan. 2023;41:173–180.
LinkOut - more resources
Full Text Sources
