. 2025 Jul 8:16:1581598.
doi: 10.3389/fphar.2025.1581598. eCollection 2025.

From radiolabeling to receptor quantification: preclinical assessment of [99mTc]Tc-carvedilol as a cardiac β-adrenoceptor probe

Affiliations

From radiolabeling to receptor quantification: preclinical assessment of [99mTc]Tc-carvedilol as a cardiac β-adrenoceptor probe

Hala F Azhari. Front Pharmacol. .

Abstract

Introduction: Accurate cardiac adrenoceptor assessment is crucial for managing cardiovascular diseases. This study introduces a novel radiotracer, technetium-99m-labeled carvedilol ([99mTc]Tc-carvedilol), which advances non-invasive cardiac receptor evaluation by improving traceability and myocardial tissue selectivity. Aimed at strengthening diagnostic precision, it optimizes a selective radioligand for quantifying cardiac adrenergic receptor sites.

Methods: [99mTc]Tc-carvedilol was synthesized via direct radiolabeling with technetium-99m, key parameters were optimized to maximize radiolabeling efficiency and ensure a reliable and reproducible [99mTc]Tc-carvedilol complex. Biodistribution was rigorously evaluated in vitro and in vivo, emphasizing cardiac uptake, receptor occupancy, biodistribution, and clearance kinetics. Comparative analysis with [131I]iodocarvedilol and 99mTc-sestamibi provided insights into advancements in detection efficiency and translational potential.

Results: [99mTc]Tc-carvedilol showed a radiolabeling efficiency of 96.5% ± 2.87%, with serum stability >92% at 24 h. Biodistribution studies in Swiss Albino mice (24 mice, aged 10-12 weeks, weighing 25 ± 3 g) revealed peak cardiac uptake (27.533% ± 0.931% injected dose per Gram of tissue (ID/g) within 15 min post-injection, alongside efficient blood clearance and minimal non-target tissue uptake (5.972% ± 0.131% ID/g organ) by 120 min. Docking analysis confirmed robust β1-adrenoceptors (-9.2 kcal/mol) via hydrogen bonds and hydrophobic and electrostatic interactions. Compared to [131I]iodocarvedilol and 99mTc-sestamibi [99mTc]Tc-carvedilol exhibited superior stability, targeting accuracy, and pharmacokinetics.

Discussion: The enhanced selective cardiac uptake and favorable pharmacokinetics of [99mTc]Tc-carvedilol position it as a promising agent for non-invasive cardiac receptor mapping, with the potential to improve diagnostic accuracy and specificity. Further clinical validation is essential to confirm its efficacy in detecting and evaluating cardiac pathologies.

Keywords: adrenergic receptors; cardiovascular disease; carvedilol; prognostic marker; single-photon emission computed tomography nuclear imaging; technetium-99m.


Conflict of interest statement

The authors declare that the research was conducted in the absence of any commercial or financial relationships that could be construed as a potential conflict of interest.

Figures

FIGURE 1
FIGURE 1
High-performance liquid chromatogram analysis of [99mTc]Tc-carvedilol. Chromatograms of pure carvedilol (control) and the [99mTc]Tc-carvedilol complex (experimental), both measured at 280 nm, were compared to visually confirm conjugation and assess conjugate purity through retention time shifts and peak integration analysis observed at 2.3 and 3.7 min, respectively. No significant peaks corresponding to free technetium or technetium oxide were detected, suggesting efficient conjugation and minimal free pertechnetate (99mTcO4 ).
FIGURE 2
FIGURE 2
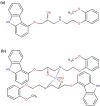
Pharmacochemical structure of (a) carvedilol drug and (b) the [99mTc]Tc-carvedilol structure.
FIGURE 3
FIGURE 3
Optimized three-dimensional structure of [99mTc]Tc-carvedilol electrical analysis.
FIGURE 4
FIGURE 4
Radiochemical yield of the [99mTc]Tc-carvedilol as a function of varying carvedilol concentrations. Line plots illustrate the influence of carvedilol concentration on the radiochemical yield of [99mTc]Tc-carvedilol (black squares), unbound free pertechnetate (red circles), and colloidal impurities (green triangles). Radiolabeling was conducted under standardized conditions using varying amounts of carvedilol (x µg), 65 µg of SnCl2·2H2O as a reducing agent, and 1.0 mL (∼195 MBq) of [99mTc]NaTcO4 at pH 7. Optimization of the ligand-to-metal molar ratio was critical to achieving high radiochemical purity and minimizing the presence of free ligand, which can interfere with chelation and lower labeling efficiency. Notably, increasing the ratio from 1:1 to 2:1 significantly enhanced labeling, achieving radiochemical purities up to 96%. Each data point represents the mean of four independent experiments conducted under identical conditions. A total of 24 healthy Swiss albino mice were employed (six per experiment) in subsequent biological evaluation. Error bars represent standard deviation (SD), indicating variability across replicates.
FIGURE 5
FIGURE 5
Radiochemical yield of the [99mTc]Tc-carvedilol as a function of the reducing agent concentration (SnCl2·2H2O). Line plots illustrate the radiochemical yield of [99mTc]Tc-carvedilol (black squares), unbound free pertechnetate (red circles), and colloidal impurities (green triangles) in response to varying concentrations of the reducing agent stannous chloride (SnCl2·2H2O). Radiolabeling was conducted under the following conditions: 100 µg carvedilol, variable SnCl2·2H2O (× µg), and 1.0 mL of [99mTc]NaTcO4 (∼195 MBq) at pH 7.0. Each data point represents the mean yield from four independent experiments performed under identical experimental conditions. A total of 24 healthy Swiss albino mice (six per experiment) were subsequently used in biological validation studies utilizing these preparations. Error bars reflect the SD, indicating the extent of variation among replicates and ensuring analytical robustness.
FIGURE 6
FIGURE 6
Radiochemical yield of the [99mTc]Tc-carvedilol as a function of reaction time and stability. Line plots illustrate the radiochemical yield of [99mTc]Tc-carvedilol (black squares), free pertechnetate (red circles), and colloidal impurities (green triangles) measured at varying reaction times. Radiolabeling was performed under standardized conditions: 100 µg carvedilol, 65 µg SnCl2·2H2O, and 1.0 mL of [99mTc]NaTcO4 (∼195 MBq) at pH 7.0. Each data point represents the mean percentage yield obtained from four independent experiments conducted under identical conditions. A total of 24 healthy Swiss albino mice (six per experiment) were employed in downstream biodistribution studies using identically prepared radiolabeled formulations. The plotted trends depict the time-dependent evolution of radiolabeling efficiency and impurity formation. Error bars represent the SD, capturing the degree of experimental variability and reproducibility.
FIGURE 7
FIGURE 7
Radiochemical yield of the [99mTc]Tc-carvedilol as a function of pH and purity. Line plots depict the percentage yields of [99mTc]Tc-carvedilol (black squares), free pertechnetate (red circles), and colloidal species (green triangles) across varying pH conditions. Radiolabeling was performed using 100 µg carvedilol, 65 µg SnCl2·2H2O, and 1.0 mL of [99mTc]NaTcO4 (∼195 MBq), with pH systematically adjusted. Each data point represents the mean percentage yield of four independent experiments, each validated through identical procedures. A total of 24 healthy Swiss albino mice (six per experiment) were employed to assess biodistribution parameters under the same radiochemical conditions. Error bars indicate the SD, reflecting variability in yield across replicates and highlighting the reproducibility of the labeling process. The observed trends demonstrate optimal radiochemical yield and minimal colloid or free pertechnetate formation near neutral pH.
FIGURE 8
FIGURE 8
Biodistribution of the [99mTc]Tc-carvedilol radioactivity complex in various organs of healthy albino mice at different time intervals (15, 30, 60, and 120 min). Each data point represents the mean percentage of injected dose per Gram of tissue (%ID/g) of four independent experiments conducted under standardized reaction conditions. For biodistribution-related measurements, error bars in the figure represent the SD from the mean uptake values (%ID/g) calculated for each group of six mice (six mice per experiment for each time point and organ), reflecting biological variability in variability in radiochemical yield, free pertechnetate, and colloid content across individual samples. Statistical analysis was conducted using a two-tailed Student’s t-test to compare uptake values between different time points and across selected organs. Significance was set at P ≤ 0.05.
FIGURE 9
FIGURE 9
Interaction views of the molecular docking between [99mTc]Tc-carvedilol and the myocardial adrenergic beta-1 receptor.
FIGURE 10
FIGURE 10
Protein structure of the [99mTc]Tc-carvedilol and the myocardial adrenergic β1 receptor. The table presents results from molecular docking analysis, highlighting potential binding pockets (CurPocket IDs: C1 to C5) for a specific ligand-protein interaction. The corresponding figures (C1, C2, C3, C4, and C5) provide structural visualizations of the docking results, depicting the ligand’s interactions within each cavity. Key parameters include the cavity volume (Å3), which defines the physical space of each pocket, the center (x, y, z) representing the spatial coordinates of the pocket’s center, and the docking size (x, y, z) specifying the grid box dimensions utilized during docking simulations. Maroon-colored helices represent the secondary structure of the adrenergic β1 receptor, specifically its alpha helices. These structural elements are integral to the receptor’s conformation as a G-protein-coupled receptor. Their arrangement highlights the active site of the receptor where the interaction with [99mTc]Tc-carvedilol occurs. Coloring enhances visibility and emphasizes the structural integrity of the protein. Gray atoms and bonds ([99mTc]Tc-carvedilol) (C1): The ligand [99mTc]Tc-carvedilol, is visualized as a set of interconnected gray atoms, showing its specific orientation within the binding pocket of the receptor. This positioning illustrates the molecular basis of its high affinity for receptors, which is crucial for its application in heart imaging. The dashed lines (binding interactions). Green dashed lines (C2) indicate hydrogen bonding or polar interactions between the ligand and specific residues of the receptor, reflecting the stabilization of the complex. Blue dashed lines (C3) likely denote ionic interactions or water-mediated bonding, which further enhances docking stability and specificity. Gray dashed lines (C4) indicate nonpolar or hydrophobic interactions contributing to the selectivity of the ligand. Highlighted residues (labeled amino acids) (C5): The labeled residues (e.g., D1217, F1218, C1216) mark the critical amino acids within the active site of the receptor that are directly involved in binding. These residues provide insights into the pharmacological and structural bases of the high specificity of [99mTc]Tc-carvedilol for adrenergic β1 receptors.

Similar articles

References

    1. Abdu Hussen A. A. (2022). High-performance liquid chromatography (HPLC): a review. Ann. Adv. Chem. 6 (1), 010–020. 10.29328/journal.aac.1001026 - DOI
    1. Ajoolabady A., Pratico D., Ren J. (2024). Endothelial dysfunction: mechanisms and contribution to diseases. Acta Pharmacol. Sin. 45 (10), 2023–2031. 10.1038/s41401-024-01295-8 - DOI - PMC - PubMed
    1. Al Oraini D. (2018). Calibration of the absolute efficiency of well-type NaI(Tl) scintillation detector in 0.121–1.408 MeV energy range. Sci. Technol. Nucl. Install. 2018, 1–6. 10.1155/2018/6432380 - DOI
    1. Azhari H. F. (2024). Advancing stroke diagnosis and management through nuclear medicine: a systematic review of clinical trials. Front. Med. 19 (11), 1425965. 10.3389/fmed.2024.1425965 - DOI - PMC - PubMed
    1. Azhari H. F., Hashem A. M. (2024). Quantifying AMPARs with 99mTc-omberacetam: a novel diagnostic radiotracer for ischemic stroke. JUmm Al-Qura Univ. Appll Sci. 10 (1), 211–224. 10.1007/s43994-023-00093-y - DOI

LinkOut - more resources