. 2025 Jul 8:16:1566724.
doi: 10.3389/fphar.2025.1566724. eCollection 2025.

Licochalcone D mitigates intracerebral hemorrhage-induced ferroptosis of neurons through COX2 inhibition

Affiliations

Licochalcone D mitigates intracerebral hemorrhage-induced ferroptosis of neurons through COX2 inhibition

JiaLi Song et al. Front Pharmacol. .

Abstract

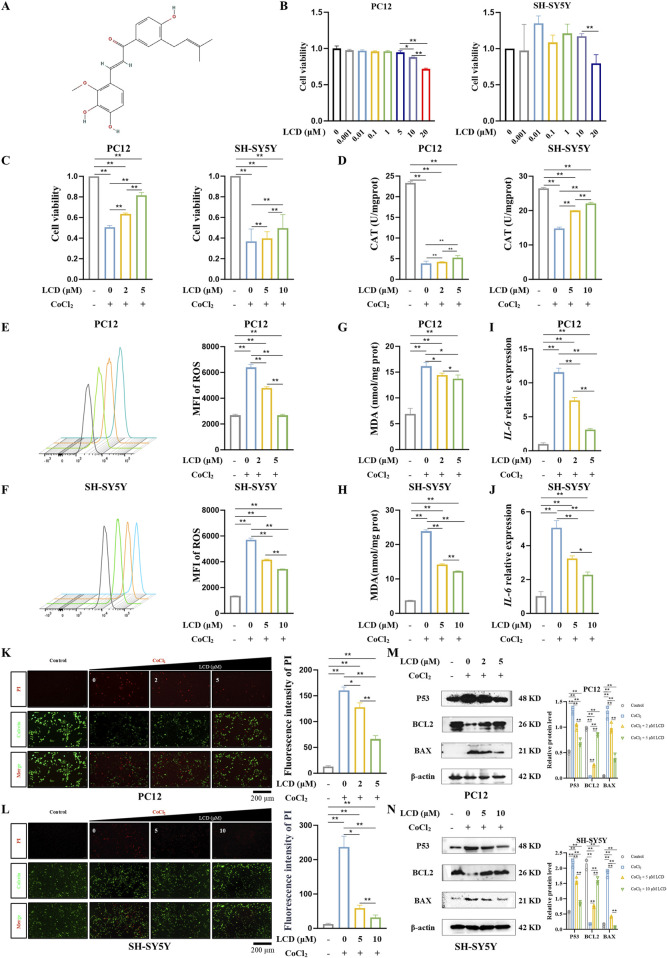
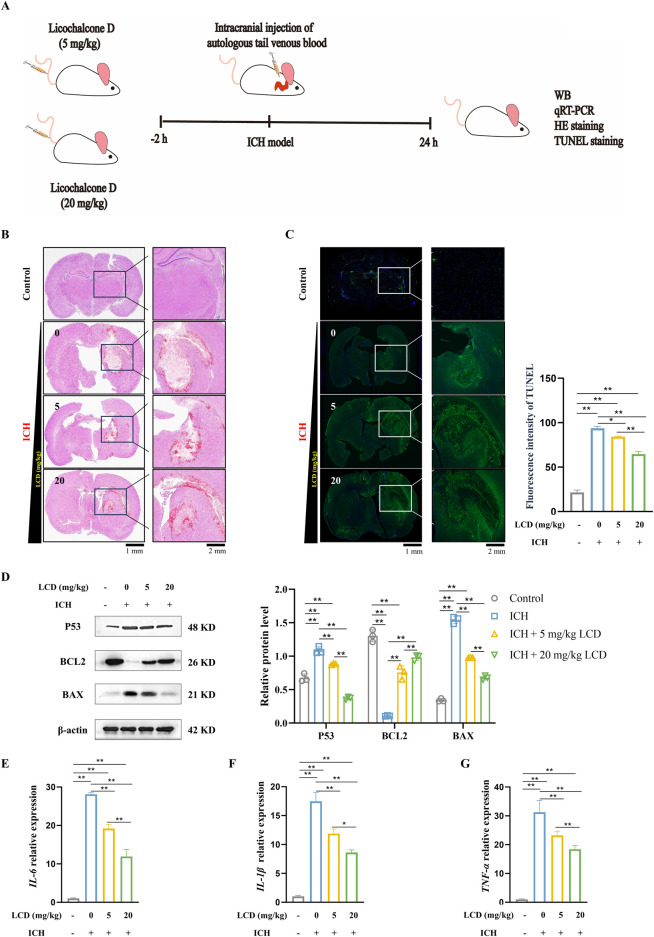
Objective: This study aims to assess LCD's neuroprotective pharmacological effects against SBI post-ICH and identify its ferroptosis-inhibiting targets.

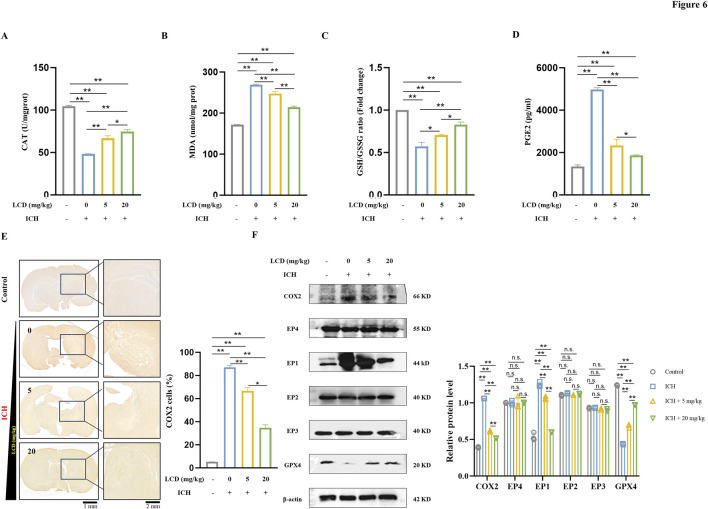
Methods: Animal models of ICH and cellular models of SBI were established. Subsequently, gradient concentrations of LCD were administered at both the animal and cellular/molecular levels. The extent of ICH injury was evaluated using a range of methods, including CCK8 assay, Flow Cytometry, quantification of CAT and MDA, CI staining, Western blot, and HE staining. The SWISS TARGET prediction tool and molecular docking were utilized to confirm LCD's target pathway and its binding site on COX2. Quantification of ferroptosis-executing proteins, BODIPY ROS staining, quantification of PGE2, MDA, and CAT were observed to assess the pharmacological effects, trends in ferroptosis influence, and to elucidate the underlying pathway mechanism.

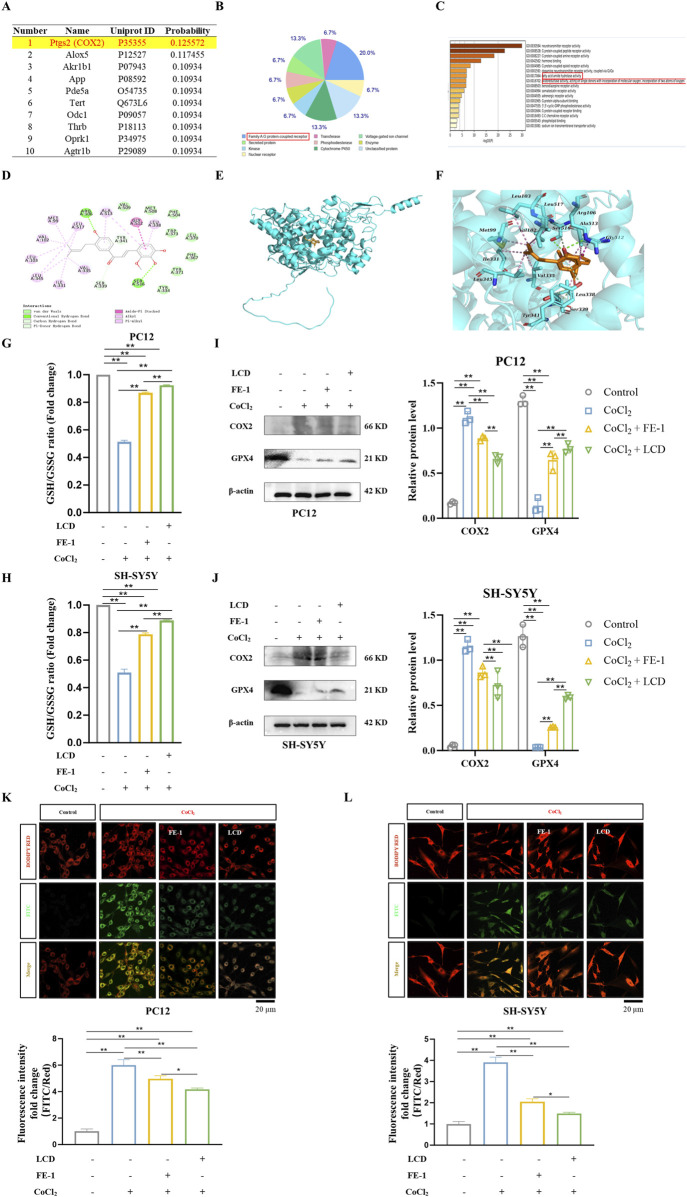
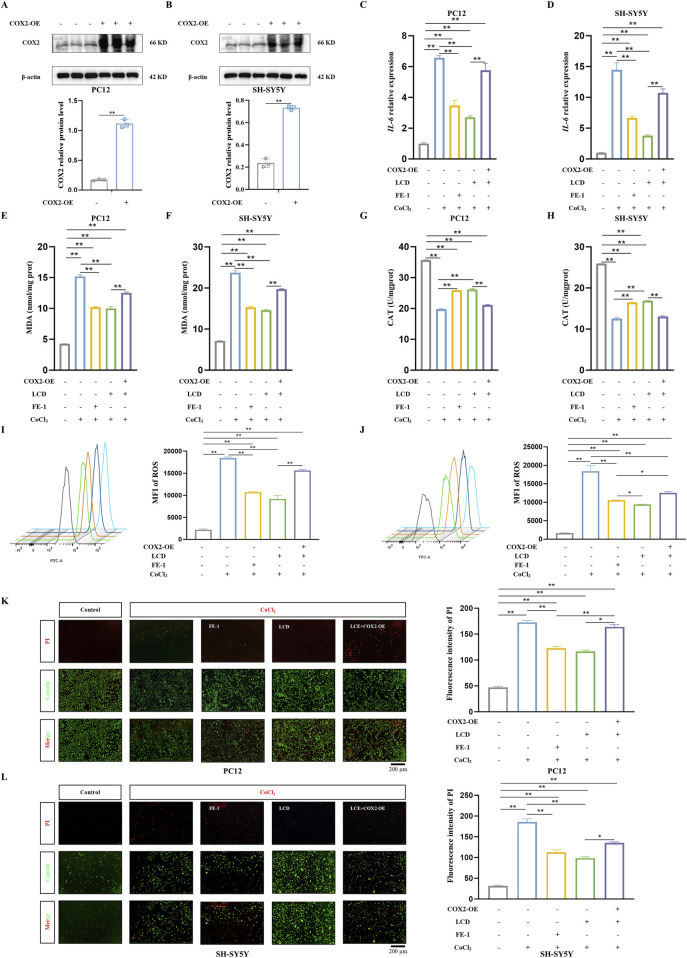
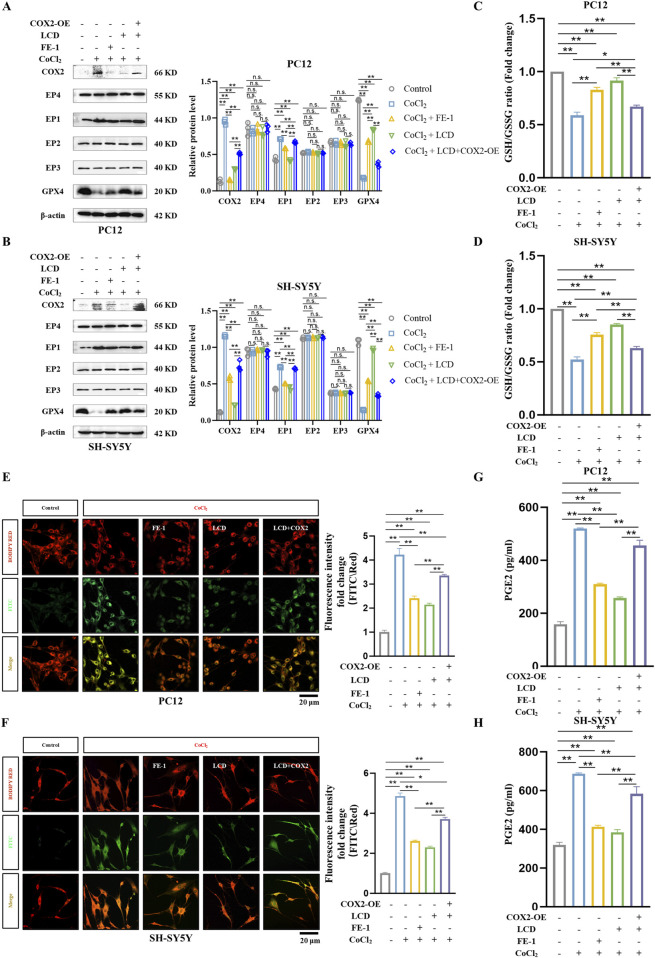
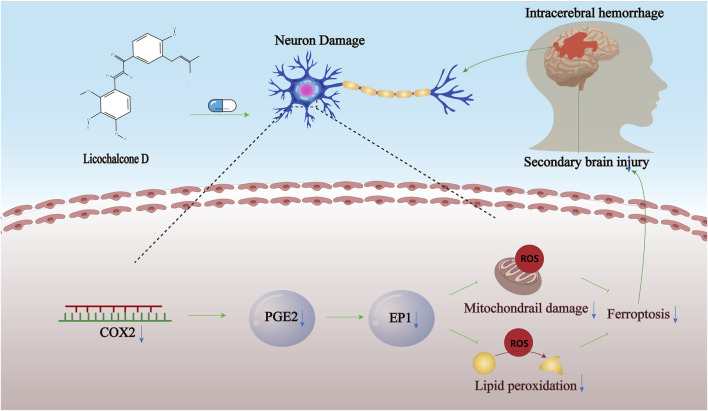
Results: Pretreatment with LCD can improve the state of SBI before the induction of an ICH model. Compound target prediction analysis revealed 102 differentially expressed genes (p < 0.05) associated with the drug target of LCD, with COX2 exhibiting the most significant expression. Furthermore, we found that LCD intervention suppressed COX2 expression, and pretreatment with COX2 overexpression in the ICH model group negated the pharmacological effects, of LCD on neuronal cell ferroptosis and SBI. It is proposed that by targeting COX2 through early LCD administration in ICH, ferroptosis in nerve cells can be reduced and SBI outcomes can be improved. To further elucidate the mechanism of targeting COX2, we found that PGE2, a downstream metabolite of COX2, is also regulated by LCD. By screening its impacts on the EP receptor family (EP1, EP2, EP3, EP4), it was found that COX2 is specifically targeted and suppressed by LCD pretreatment prior to ICH modeling, which further inhibits the PGE2/EP1 pathway, thereby reducing ferroptosis-specific lipid peroxidation.

Conclusion: LCD pretreatment reduces ferroptosis in neurons and alleviates SBI after ICH by blocking the COX2/PGE2/EP1 pathway. Early LCD use may improve SBI, highlighting its potential as a pharmacological option for ICH outcomes.

Keywords: COX2; ferroptosis; intracerebral hemorrhage; licochalcone D; secondary brain injury.


Conflict of interest statement

The authors declare that the research was conducted in the absence of any commercial or financial relationships that could be construed as a potential conflict of interest.

Figures

FIGURE 1
FIGURE 1
LCD Mitigates CoCl2-Induced Neuronal Cell Death and Reduces Oxidative Stress Levels. (A) Presentation of the structural formula for LCD. (B) PC12 and SH-SY5Y cells were treated with different LCD doses for 24 h (0.001–20 µM. Cell viability post-exposure was evaluated using the CCK-8 assay; results are presented as mean ± SD (n = 3). (C) PC12 or SH-SY5Y cells were pretreated with LCD (0, 2/5 µM or 0, 5/10 µM) for 2 h, then exposed to CoCl2 (400 μg/mL) for 24 h. Cell viability was measured using the CCK-8 assay, with results expressed as mean ± SD (n = 3). (D) PC12 or SH-SY5Y cells were subjected to the same treatment regimen as in (C). After the 24 h CoCl2 treatment, the level of CAT was measured using the CAT assay. Data are expressed as mean ± SD (n = 3). (E–F) PC12 or SH-SY5Y cells underwent LCD pretreatment as in (C) and subsequently treated with CoCl2. After 24 h, the MFI of ROS was assessed using flow cytometry. The data are presented as mean ± SD (n = 3). (G–H) PC12 or SH-SY5Y cells were treated as described in (C), and after the 24 h CoCl2 treatment, the levels of MDA were quantified via the MDA assay, with results expressed as mean ± SD (n = 3). (I–J) PC12 or SH-SY5Y cells underwent LCD pretreatment as in (C) and subsequently treated with CoCl2. Following the 24 h treatment, IL-6 mRNA expression was quantified by qRT-PCR, with results expressed as mean ± SD (n = 3). (K–L) PC12 or SH-SY5Y cells were exposed to LCD and CoCl2 as per protocol (C). After 24 h, cell death was quantified using the Live/Dead assay (Calcein-AM/PI staining), with the proportion of dead cells expressed as mean ± SD (n = 3). Scale bar = 200 μm. (M–N) PC12 or SH-SY5Y cells were subjected to the same treatment regimen as in (C). After the 24 h CoCl2 treatment, the levels of P53, BCL2, and BAX proteins were quantified by Western blot, with β-actin as the loading control. Data are presented as mean ± SD (n = 3). Statistical significance: **p < 0.01, *p < 0.05.
FIGURE 2
FIGURE 2
LCD Acts as a Ferroptosis Inhibitor in ICH Neuronal Cells. (A) The top ten genes with direct binding correlation to LCD, as predicted by SWISS TARGET DATA. (B) A pie chart categorizing the genes predicted by SWISS TARGET DATA to have direct binding correlation with LCD (102 genes, p < 0.05). (C) GO term analysis providing insights into the LCD target. (D–F) The 2D binding mode of LCD with rat COX2 is illustrated in (D-F) presents the 3D binding mode of LCD with rat COX2. LCD is highlighted in orange, while the backbone of rat COX2 is represented by a cyan surface and cartoon rendering. The residues within the binding pocket of rat COX2 are displayed as cyan sticks. Conventional hydrogen bond interactions are indicated by green dashed lines, carbon-hydrogen bond interactions by pale green dashed lines, alkyl-alkyl hydrophobic interactions by pink dashed lines, and amide-pi stacked hydrophobic interactions by light magenta dashed lines. (G–H) PC12 or SH-SY5Y cells were subjected to treatment with LCD (5 or 10 µM) or FE-1 (1 µM) for 2 h, followed by exposure to CoCl2 (400 μg/mL) for an additional 24 h. The ratio of GSH/GSSG was subsequently quantified using a dedicated GSH/GSSG assay. Data are presented as mean ± SD (n = 3). (I–J) Following treatment of PC12 or SH-SY5Y cells with LCD (5 or 10 µM) or FE-1 (1 µM) for 2 h, and subsequent exposure to CoCl2 (400 μg/mL) for 24 h, COX2 and GPX4 protein levels were quantified by Western blot, using β-actin as the loading control. Data are presented as mean ± SD (n = 3). (K–L) PC12 or SH-SY5Y cells were pretreated with LCD (5 or 10 µM) or FE-1 (1 µM) for 2 h, followed by CoCl2 (400 μg/mL) exposure for an additional 24 h. Oxidized and reduced dye fluorescence intensities were measured using FITC (green) and BODIPY RED (red), respectively. The ratio of FITC/BODIPY RED fluorescence intensities served as a readout for cellular lipid peroxidation. Fluorescence density quantifications were normalized prior to plotting. Scale bars = 20 μm. Data are presented as mean ± SD (n = 3). Statistical significance is denoted by **for p < 0.01 and * for p < 0.05.
FIGURE 3
FIGURE 3
Overexpression of COX2 Blocks the Improvement of Oxidative Stress and Cell Death in ICH Neuronal Cells by LCD. (A–B) PC12 or SH-SY5Y cells were transfected with the COX2-overexpressing (COX2-OE) plasmid for 48 h, followed by quantification of COX2 protein levels via Western blot using β-actin as the loading control. Data are presented as mean ± SD (n = 3). (C–D) PC12 or SH-SY5Y cells, transfected with or without the COX2-OE plasmid for 24 h, were then exposed to LCD (5 or 10 µM) or FE-1 (1 µM) for 2 h. This treatment was followed by a 24 h incubation with CoCl2 (400 μg/mL). Following the 24-h incubation, IL-6 mRNA expression was quantified by qRT-PCR. Data are expressed as mean ± SD (n = 3). (E–F) PC12 or SH-SY5Y cells, underwent the same treatment protocol as described in (C). Following this treatment, the levels of MDA were assessed using an MDA assay. Data are expressed as mean ± SD (n = 3). (G–H) PC12 or SH-SY5Y cells were subjected to the identical treatment regimen as in (C). After the 24 h treatment, the level of CAT was evaluated using a CAT assay. Data are expressed as mean ± SD (n = 3). (I–J) PC12 or SH-SY5Y cells were exposed to the identical treatment protocol as described in (C). After 24 h, the MFI of ROS was quantified using flow cytometry. Data are expressed as mean ± SD (n = 3). (K–L). PC12 or SH-SY5Y cells were subjected to the identical experimental protocol as outlined in (C). Following the 24 h treatment, cell death was assessed using the Live (Calcein, green)/Dead (PI, red) assay. The percentage of dead cells was determined based on the Live/Dead staining, and the results are presented as mean ± SD (n = 3). Scale bar = 200 μm. Statistical significance: **p < 0.01, *p < 0.05.
FIGURE 4
FIGURE 4
LCD Improves Ferroptosis in ICH Neuronal Cells In Vitro by Targeting the COX2/PGE2/EP1 Pathway. (A–B) PC12 or SH-SY5Y cells were transfected with a COX2-overexpressing (COX2-OE) plasmid or a control vector for 24 h, followed by exposure to LCD (5 or 10 µM) or FE-1 (1 µM) for 2 h. This was followed by a 24 h incubation with CoCl2 (400 μg/mL). After the incubation period, protein levels of COX2, EP1-4, and GPX4 were quantified by Western blot, using β-Actin as the loading control. Data are presented as mean ± SD (n = 3). (C–D) PC12 or SH-SY5Y cells were subjected to the same treatment as in (A). After 24 h incubation with CoCl2, the ratio of GSH/GSSG was measured using a dedicated GSH/GSSG quantification assay. Data are presented as mean ± SD (n = 3). (E–F) PC12 or SH-SY5Y cells underwent the same treatment regimen as described in (A). Following the 24 h incubation with CoCl2, mitochondrial lipid ROS levels were quantified using BODIPY RED fluorescence. The oxidized dye was measured using FITC fluorescence (green), the reduced dye was quantified using BODIPY RED fluorescence (red). The ratio of the fluorescence intensities at FITC and BODIPY RED channels was calculated to assess lipid peroxidation in cells. Quantification of fluorescence density were normalized before plotting. Scale bars are provided 20 μm. Bars represent the mean ± SD (n = 3). (G–H) PC12 or SH-SY5Y cells were subjected to the identical treatment regimen as in (A). After the 24 h incubation period, the protein level of PGE2 was measured using an ELISA assay. Data are presented as mean ± SD (n = 3). Statistical significance is indicated as follows: **p < 0.01, *p < 0.05, and n. s.; not significant.
FIGURE 5
FIGURE 5
LCD Ameliorates Neuronal Cell Death and Oxidative Stress Levels in SBI After Rat ICH. (A) Experimental schedule/regimen. Rats administered LCD were randomly assigned to four treatment groups: 1) Control; 2) ICH group; 3) ICH + LCD 5 mg/kg group; 4) ICH + LCD 20 mg/kg group. These treatments were administered to the rat via tail intravenous (i.v.) injection. (B) Coronal sections of brain tissue were stained with HE to assess intracranial hematoma. Scale bars are provided at 1 mm or 2 mm. (C) Coronal brain sections were subjected to TUNEL fluorescent staining (green). With DAPI (blue) used for nuclear counterstaining. Scale bars: 1 mm (low-magnification images) or 200 μm (high-magnification insets). Data are presented as mean ± SD (n = 3). (D) Western blot analysis was performed to quantify the relative protein expression of P53, BAX, and BCL2 in brain tissues. β-Actin was used as an internal loading control. Data are presented as mean ± SD (n = 3). (E–G) qRT-PCR was employed to assess the mRNA levels of IL-6, IL-1β, and TNF-α in brain tissues. Expression levels were normalized to the housekeeping gene β-Actin prior to statistical analysis. Data are expressed as mean ± SD (n = 3). Statistical significance is denoted as: **p < 0.01, *p < 0.05.
FIGURE 6
FIGURE 6
LCD Improves Ferroptosis in Rat ICH by Inhibiting the COX2/PGE2/EP1 Pathway. (A) The CAT activity in brain tissues was were quantified using a CAT assay and normalized prior to plotting. Data are presented as mean ± SD (n = 3). (B) The levels of MDA in brain tissue were measured using an MDA assay and normalized before plotting. Data are expressed as mean ± SD (n = 3). (C) The ratio of GSH/GSSG in brain tissue was quantified using a GSH/GSSG assay and normalized prior to plotting. Data are expressed as mean ± SD (n = 3). (D) The levels of PGE2 in brain tissue were assessed using a PGE2 ELISA assay and normalized before plotting. Data are expressed as mean ± SD (n = 3). (E) Immunohistochemical staining of COX2 was performed on coronal sections of brain tissue, and the results were normalized before plotting. Data are expressed as mean ± SD (n = 3). Scale bars of 1 mm or 2 mm are provided. (F) Western blot analysis was conducted to quantify the relative protein expression of COX2, EP1-EP4, and GPX4 proteins in brain tissue, β-Actin was used as an internal loading control. Error bars represent standard deviation and data are expressed as the mean ± SD, n = 3. Statistical significance is denoted as: **p < 0.01, *p < 0.05 and n. s., no significant difference.
FIGURE 7
FIGURE 7
Proposed model. Propose a model demonstrating LCD’s pharmacological effects in ameliorating ferroptosis in neuronal cells following spontaneous ICH, achieved through targeted inhibition of the COX2-driven PGE2/EP1 pathway.

Similar articles

References

    1. Bai Y., Meng L., Han L., Jia Y., Zhao Y., Gao H., et al. (2019). Lipid storage and lipophagy regulates ferroptosis. Biochem. Biophys. Res. Commun. 508 (4), 997–1003. 10.1016/j.bbrc.2018.12.039 - DOI - PubMed
    1. Blaker A. L., Rodriguez E. A., Yamamoto B. K. (2019). Neurotoxicity to dopamine neurons after the serial exposure to alcohol and methamphetamine: protection by COX-2 antagonism. Brain Behav. Immun. 81, 317–328. 10.1016/j.bbi.2019.06.028 - DOI - PMC - PubMed
    1. Breder C. D., Dewitt D., Kraig R. P. (1995). Characterization of inducible cyclooxygenase in rat brain. J. Comp. Neurol. 355 (2), 296–315. 10.1002/cne.903550208 - DOI - PMC - PubMed
    1. Chen J., Wang Y., Wu J., Yang J., Li M., Chen Q. (2020). The potential value of targeting ferroptosis in early brain injury after acute CNS disease. Front. Mol. Neurosci. 13, 110. 10.3389/fnmol.2020.00110 - DOI - PMC - PubMed
    1. Chen S., Zhao L., Sherchan P., Ding Y., Yu J., Nowrangi D., et al. (2018). Activation of melanocortin receptor 4 with RO27-3225 attenuates neuroinflammation through AMPK/JNK/p38 MAPK pathway after intracerebral hemorrhage in mice. J. Neuroinflammation 15 (1), 106. 10.1186/s12974-018-1140-6 - DOI - PMC - PubMed

LinkOut - more resources