

Transcriptomic signatures of neonatal acute respiratory distress syndrome in a prospective cohort of respiratory distress
- PMID: 40697828
- PMCID: PMC12281067
- DOI: 10.1016/j.isci.2025.113007
Transcriptomic signatures of neonatal acute respiratory distress syndrome in a prospective cohort of respiratory distress
Abstract
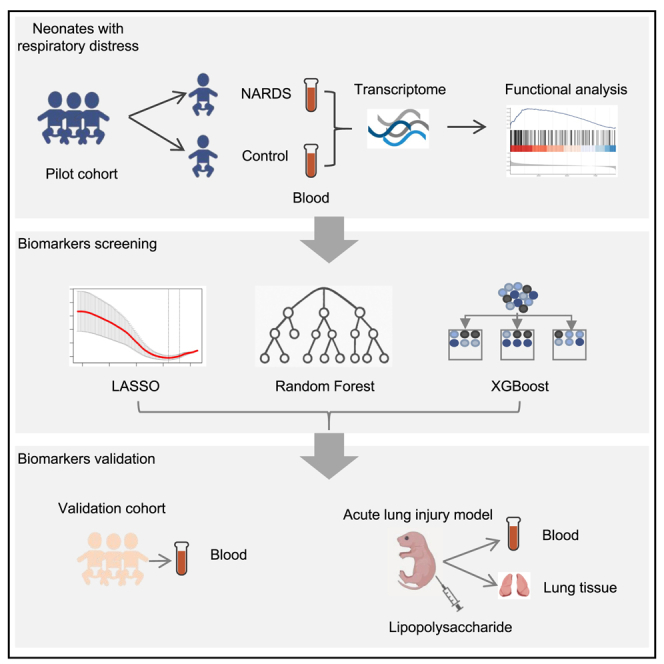
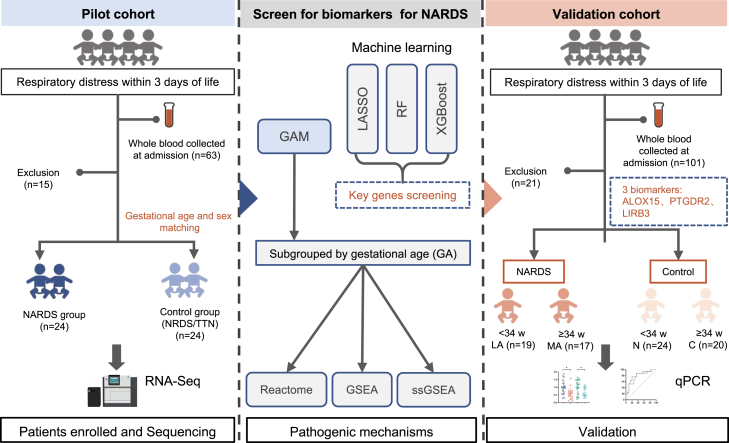
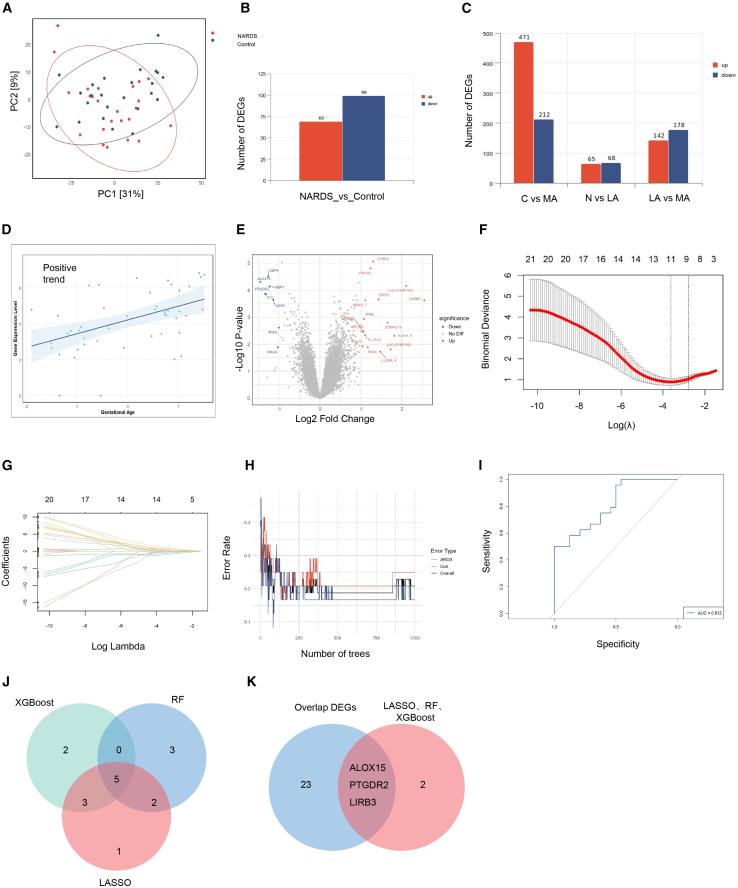
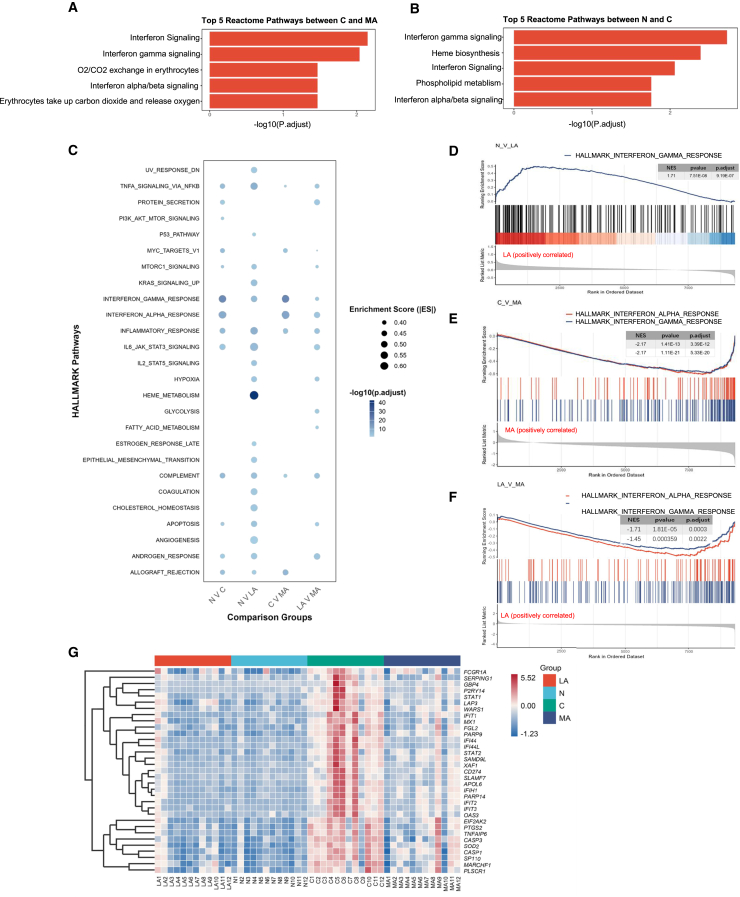
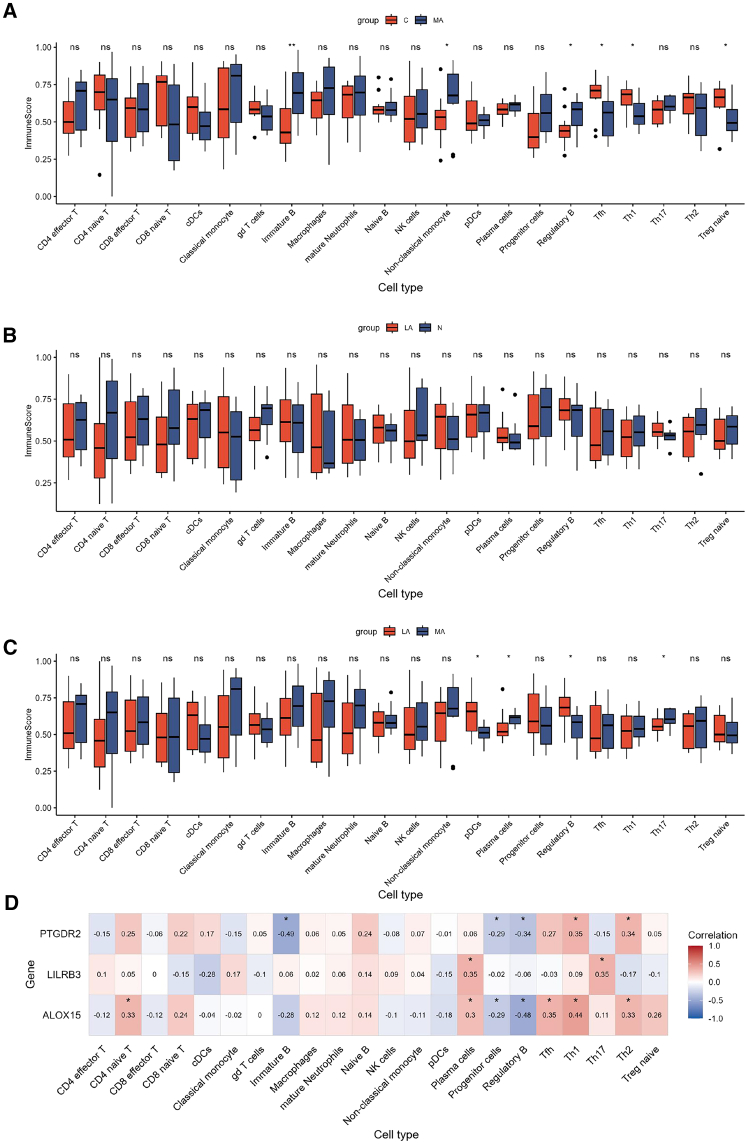
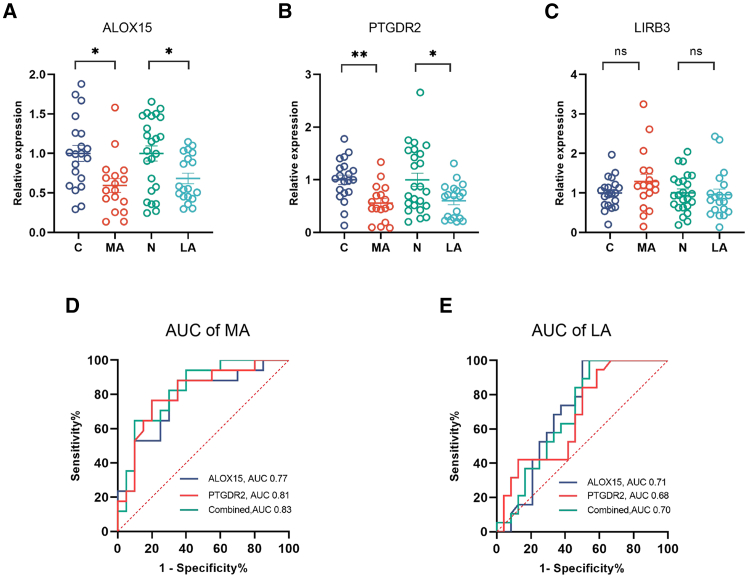
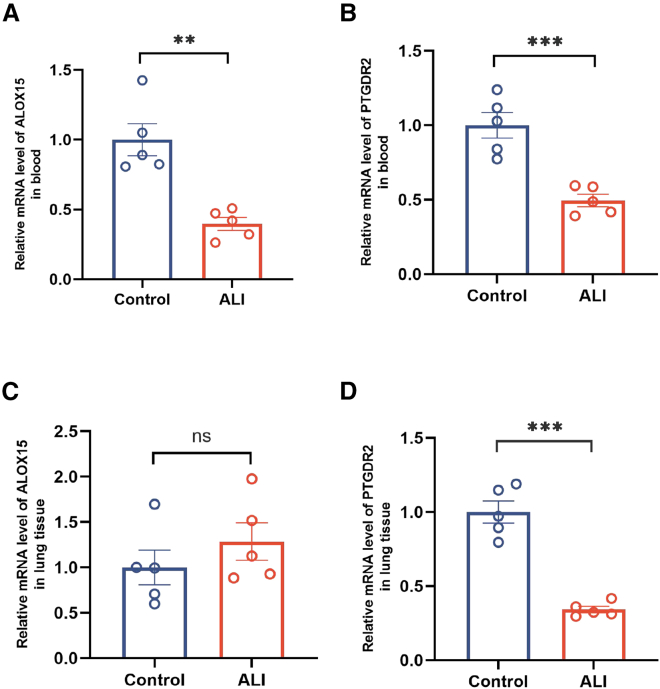
Neonatal acute respiratory distress syndrome (NARDS) is challenging to differentiate from other respiratory conditions, and gestational age (GA) may influence gene expression. This study characterized whole blood transcriptomic profiles of NARDS in a pilot cohort of 48 neonates with respiratory distress, demonstrating a significant GA-dependent modulation of gene expression. Functional analyses revealed prominent involvement of interferon-related pathways in NARDS, with greater suppression in neonates born before 34 weeks. Immune cell infiltration was observed in term or late preterm neonates but was absent in more preterm cases. Machine learning identified three key predictive genes, among which ALOX15 and PTGDR2 were validated in an independent cohort, with area under the curve ranging from 0.68 to 0.83 across different GAs. The gene changes were also confirmed in a neonatal lipopolysaccharide-induced lung injury mouse model. These findings highlight the potential predictive and therapeutic value of ALOX15 and PTGDR2 for NARDS.
Keywords: Machine learning; Transcriptomics.
© 2025 The Authors.
Conflict of interest statement
All authors declare no competing interests.
Figures
Similar articles
-
Positioning for acute respiratory distress in hospitalised infants and children.Cochrane Database Syst Rev. 2022 Jun 6;6(6):CD003645. doi: 10.1002/14651858.CD003645.pub4. Cochrane Database Syst Rev. 2022. PMID: 35661343 Free PMC article.
-
Maternal and neonatal outcomes of elective induction of labor.Evid Rep Technol Assess (Full Rep). 2009 Mar;(176):1-257. Evid Rep Technol Assess (Full Rep). 2009. PMID: 19408970 Free PMC article.
-
Incidence of neonatal respiratory morbidity after vaginal and caesarean delivery in the late-preterm and term period - a retrospective cohort study.Swiss Med Wkly. 2024 Jul 25;154:3798. doi: 10.57187/s.3798. Swiss Med Wkly. 2024. PMID: 39137347
-
Elective high frequency jet ventilation versus conventional ventilation for respiratory distress syndrome in preterm infants.Cochrane Database Syst Rev. 2000;1998(2):CD000328. doi: 10.1002/14651858.CD000328. Cochrane Database Syst Rev. 2000. PMID: 10796194 Free PMC article.
-
Antenatal corticosteroids prior to planned caesarean at term for improving neonatal outcomes.Cochrane Database Syst Rev. 2021 Dec 22;12(12):CD006614. doi: 10.1002/14651858.CD006614.pub4. Cochrane Database Syst Rev. 2021. PMID: 34935127 Free PMC article.
References
-
- Khemani R.G., Smith L.S., Zimmerman J.J., Erickson S., Pediatric Acute Lung Injury Consensus Conference Group Pediatric acute respiratory distress syndrome: definition, incidence, and epidemiology: proceedings from the Pediatric Acute Lung Injury Consensus Conference. Pediatr. Crit. Care Med. 2015;16:S23–S40. doi: 10.1097/PCC.0000000000000432. - DOI - PubMed
-
- De Luca D., van Kaam A.H., Tingay D.G., Courtney S.E., Danhaive O., Carnielli V.P., Zimmermann L.J., Kneyber M.C.J., Tissieres P., Brierley J., et al. The Montreux definition of neonatal ARDS: biological and clinical background behind the description of a new entity. Lancet Respir. Med. 2017;5:657–666. doi: 10.1016/s2213-2600(17)30214-X. - DOI - PubMed
-
- Chen L., Li J., Shi Y., Chinese Neonatal ARDS ChiNARDS study group Clinical characteristics and outcomes in neonates with perinatal acute respiratory distress syndrome in China: a national, multicentre, cross-sectional study. eClinicalMedicine. 2023;55 doi: 10.1016/j.eclinm.2022.101739. - DOI - PMC - PubMed
LinkOut - more resources
Full Text Sources
