. 2025 Jul 8:13:1620261.
doi: 10.3389/fpubh.2025.1620261. eCollection 2025.

Association between waist circumference and fatty liver disease in older adult population: a cross-sectional study in Urumqi

Affiliations

Association between waist circumference and fatty liver disease in older adult population: a cross-sectional study in Urumqi

Mingdong Zhang et al. Front Public Health. .

Abstract

Objective: This study aims to explore the correlation between waist circumference and the prevalence of fatty liver disease in the older adult population in Urumqi.

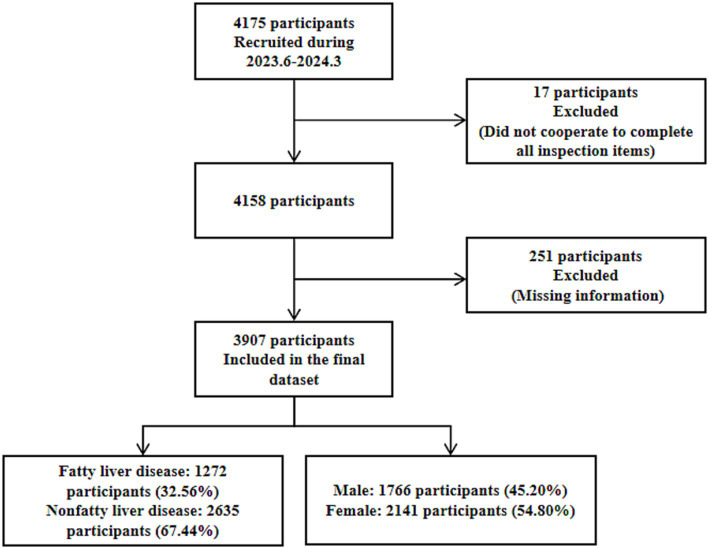
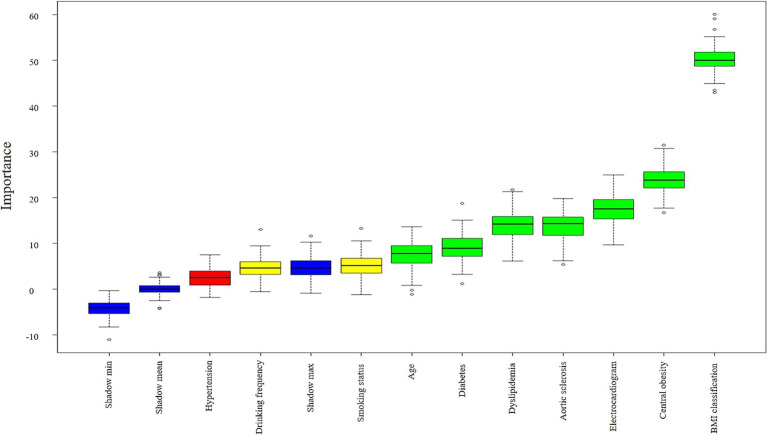
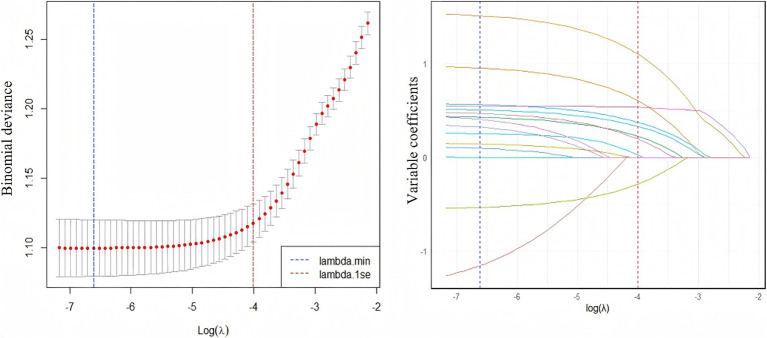
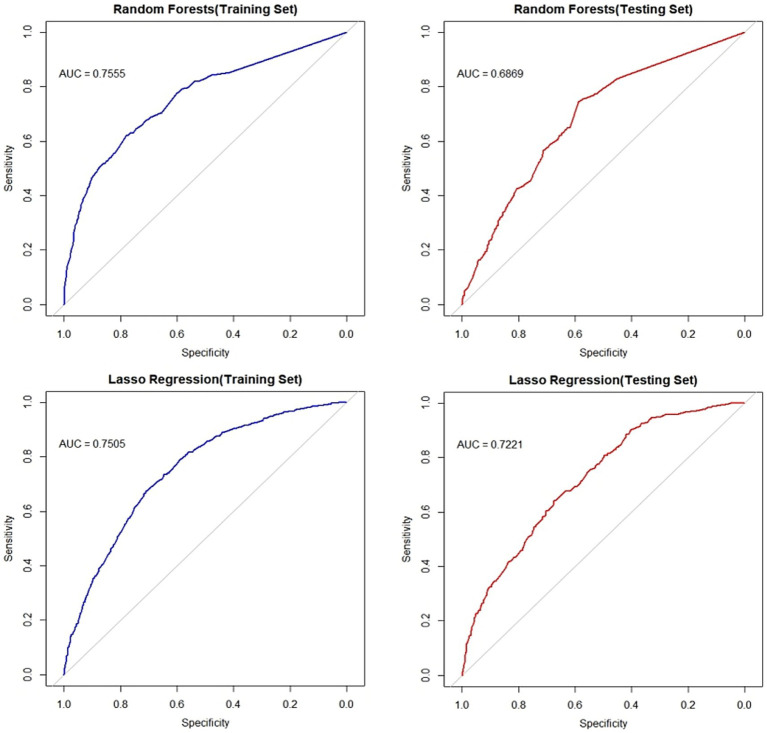
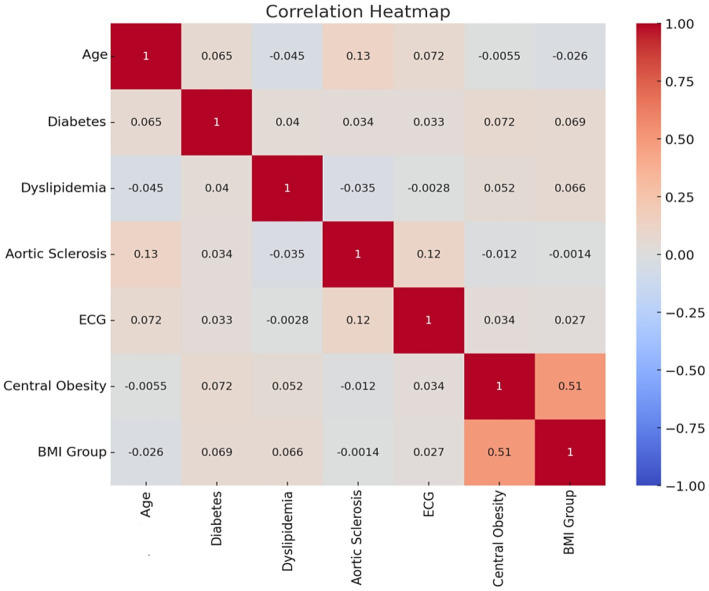
Methods: Through cluster random sampling of healthcare institutions within the urban districts of Urumqi, a final cohort of 3,907 participants was enrolled from three institutions. In addition, the informed consent forms of the participants were obtained. Chi-square tests were used for univariate analysis between groups, and the data were divided into a training set and a test set in a 7:3 ratio. Variables were further screened using machine learning models such as random forest classifier and Lasso. Logistic regression and restricted cubic spline models were used to analyze the correlation between waist circumference and fatty liver disease.

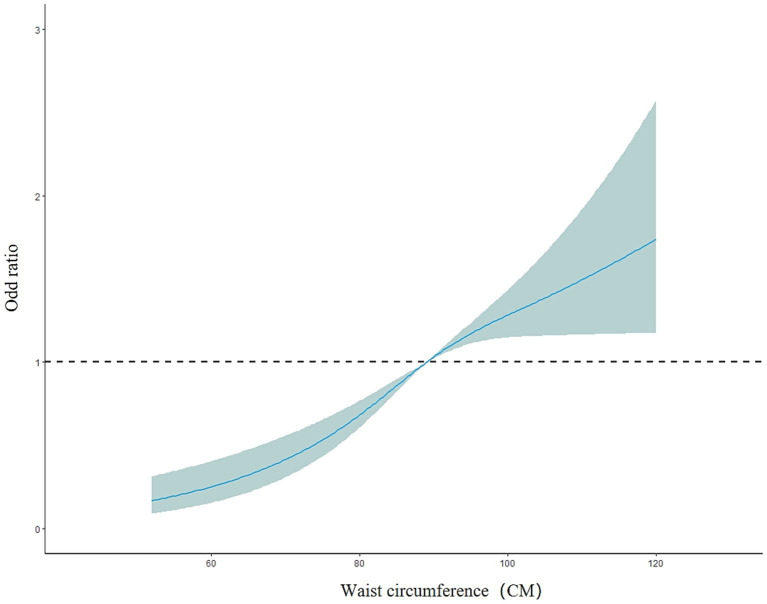
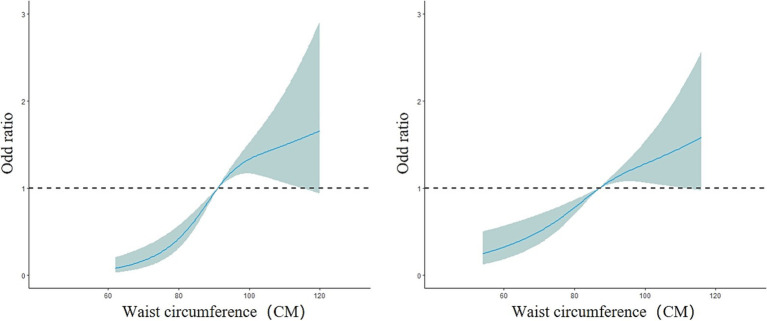
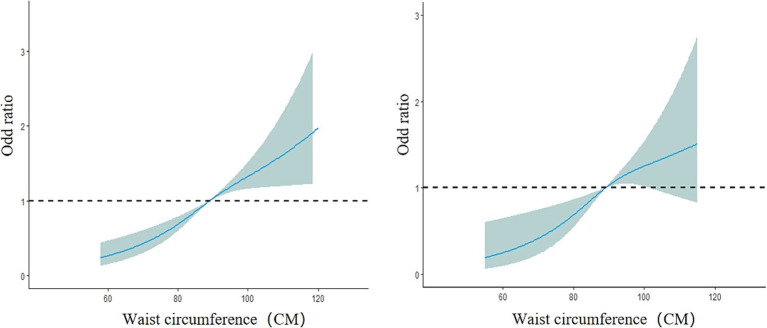
Results: The prevalence of fatty liver disease was 32.56%, with 31.54% in men and 33.40% in women. Multivariate logistic regression analysis showed that compared with non-central obesity, the risk of fatty liver disease in central obesity was significantly higher (OR = 1.768, 95% CI: 1.481-2.112). The restricted cubic spline model analysis showed that the risk of fatty liver disease increased with waist circumference in the older adult population. In the total population and the male group, waist circumference and central obesity showed a nonlinear relationship, while in the female group, those below 75 years old, and those 75 and older, a linear relationship was observed.

Conclusion: Controlling waist circumference is important for the prevention of fatty liver disease. The older adult population in Urumqi should pay attention to the risks posed by increasing waist circumference.

Keywords: fatty liver; machine learning; older adult population; restricted cubic spline; waist circumference.


Conflict of interest statement

The authors declare that the research was conducted in the absence of any commercial or financial relationships that could be construed as a potential conflict of interest.

Figures

Figure 1
Figure 1
Flowchart of selection for participants.
Figure 2
Figure 2
Boxplot of importance ranking for factors associated with fatty liver disease. Important features are shown in green boxes (7), tentative features in yellow boxes (2), and rejected features in red boxes (1). Shadow variables are displayed in blue boxes (3): minimum shadow value (Shadow min), maximum shadow value (Shadow max), mean shadow value (Shadow mean). The yellow box (Drinking frequency) contains discrete high-value points exceeding Shadow max, while the red box (Hypertension) contains values above Shadow min. These reflect random associations occurring in a small number of iterations. Following Boruta’s stability principle and the majority voting results, both features were still classified as tentative and rejected, respectively.
Figure 3
Figure 3
The relationship between log(λ) value and lasso regression coefficients (left), and the trend of variable coefficients corresponding to log(λ) value (right). Left panel: As log(λ) decreases, the mean binomial deviance (red line) declines rapidly before stabilizing. Minimal deviance is achieved at lambda.min (vertical line), indicating optimal predictive performance at this penalty strength. Right panel: Coefficients converge toward zero as log(λ) increases. At lambda.min, nine variables exhibit non-zero coefficients persistently distinct from zero, while all others are compressed to zero.
Figure 4
Figure 4
ROC curves of the random forest model and lasso regression model. The left panel displays ROC curves for both models on the training set, while the right panel shows curves for the test set. Blue lines indicate training set performance; red lines denote test set performance. Plots have 1-specificity on the x-axis and sensitivity on the y-axis.
Figure 5
Figure 5
Factor correlations.
Figure 6
Figure 6
Dose–response relationship between waist circumference and the risk of fatty liver disease in the older adult population.
Figure 7
Figure 7
Dose–response relationship between waist circumference and the risk of fatty liver disease in the male group (left) and female group (right).
Figure 8
Figure 8
Dose–response relationship between waist circumference and the risk of fatty liver disease in the group under 75 years old (left) and the group 75 years and older (right). The solid blue line represents the adjusted OR values from the restricted cubic spline model, the gray area represents the 95% confidence interval (CI) of the OR values, and the black dashed line represents OR = 1.

Similar articles

References

    1. Man S, Deng Y, Ma Y, Fu J, Bao H, Yu C, et al. Prevalence of liver steatosis and fibrosis in the general population and various high-risk populations: a nationwide study with 5.7 million adults in China. Gastroenterology. (2023) 165:1025–40. doi: 10.1053/j.gastro.2023.05.053, PMID: - DOI - PubMed
    1. Powell EE, Wong VW, Rinella M. Non-alcoholic fatty liver disease. Lancet. (2021) 397:2212–24. doi: 10.1016/S0140-6736(20)32511-3, PMID: - DOI - PubMed
    1. Mantovani A, Scorletti E, Mosca A, Alisi A, Byrne CD, Targher G. Complications, morbidity and mortality of nonalcoholic fatty liver disease. Metab Clin Exp. (2020) 111:154170. doi: 10.1016/j.metabol.2020.154170, PMID: - DOI - PubMed
    1. Li Y, Adeniji NT, Fan W, Kunimoto K, Török NJ. Non-alcoholic fatty liver disease and liver fibrosis during aging. Aging Dis. (2022) 13:1239–51. doi: 10.14336/AD.2022.0318, PMID: - DOI - PMC - PubMed
    1. Byambasukh O, Zelle D, Corpeleijn E. Physical activity, fatty liver, and glucose metabolism over the life course: the lifelines cohort. Am J Gastroenterol. (2019) 114:907–15. doi: 10.14309/ajg.000000000000016 - DOI - PubMed

LinkOut - more resources