. 2025 Jul 8:16:1506461.
doi: 10.3389/fpls.2025.1506461. eCollection 2025.

Evolutionary dynamics of the calcium/cation antiporter superfamily in Brassicaceae: codon usage, selection pressure, and BnCaCAs role in abiotic stress response

Affiliations

Evolutionary dynamics of the calcium/cation antiporter superfamily in Brassicaceae: codon usage, selection pressure, and BnCaCAs role in abiotic stress response

Amin Abedi et al. Front Plant Sci. .

Abstract

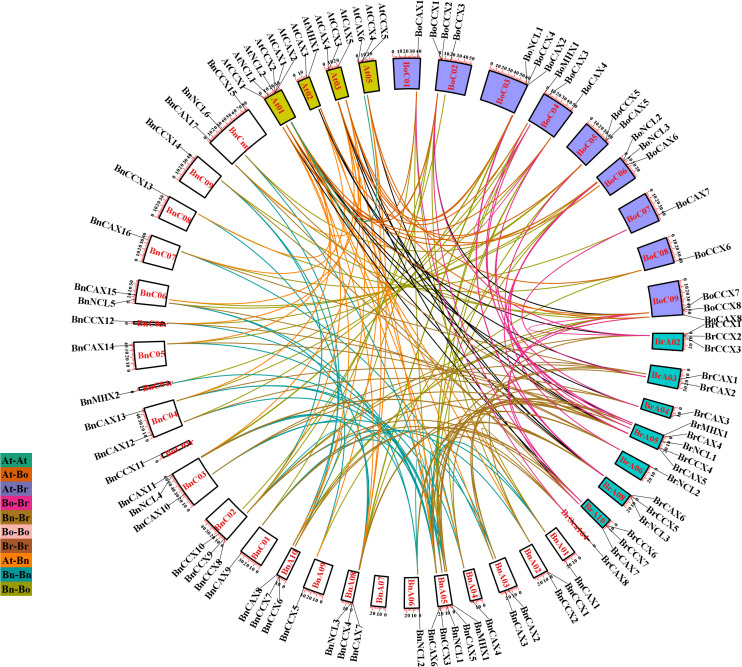
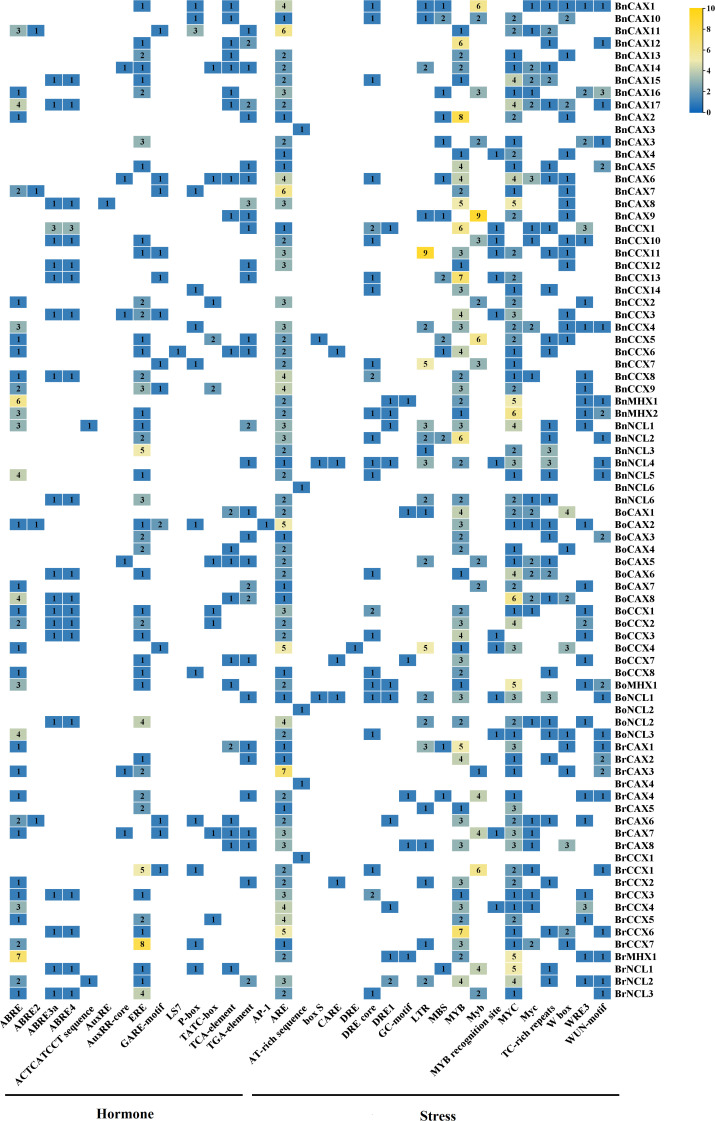
Calcium (Ca2+) serves as a crucial intracellular messenger in plant signaling, particularly during stress responses. Precise regulation of calcium levels by transporters such as calcium/cation (CaCA) antiporters is essential for its effective function. However, the evolutionary dynamics and stress-related roles of the CaCA superfamily remain underexplored in key Brassicaceae crops. This study aimed to address this gap by investigating the hypothesis that CaCA genes in Brassica napus, B. rapa, and B. oleracea have undergone distinct evolutionary trajectories influencing their roles in abiotic stress responses, using Arabidopsis thaliana for comparison. Using Hidden Markov Model (HMM) profiling, 93 CaCA genes were identified across these species. These genes were categorized into four phylogenetic clades: CAX, CCX, NCL, and MHX. Comprehensive analyses of their coding proteins physicochemical properties, subcellular localization, conserved motifs, and gene structures were performed. Codon usage bias (CUB) analysis showed CaCA genes have low codon bias and CUB indices indicated a complex interplay between mutational and selective pressures, highlighting the influence of natural selection and mutational biases in shaping these genes. Collinearity and duplication analyses highlighted the evolutionary dynamics of the CaCA gene family, with several segmental and whole-genome duplication (WGD) events contributing to their expansion. Notably, duplicated genes underwent negative selection pressure, which removed harmful mutations, resulting in slower evolution and maintaining the functional stability of CaCA genes throughout their evolutionary history. Analysis of cis-regulatory elements (CREs) revealed their responsiveness to hormones and stresses, suggesting a potential role in plant environmental adaptation. Expression profiling of CaCA genes under abiotic stresses (dehydration, salinity, cold, and ABA) in B. napus was performed using publicly available RNA-seq datasets and analyzed with standard bioinformatics tools. Based on the results of expression analysis, key CaCA genes, such as BnCAX3, BnCAX16, BnCC2, BnCCX9, BnCAX5, BnCAX12, BnCAX13, and BnMHX1, which are differentially expressed and potentially crucial for stress tolerance. This comprehensive study elucidates the evolutionary architecture of the CaCA gene family in Brassicaceae and identifies key BnCaCA genes potentially crucial for abiotic stress tolerance, thus offering a foundation for future functional studies aimed at improving crop resilience.

Keywords: bioinformatics; calcium homeostasis; codon usage bias; evolution; stress.


Conflict of interest statement

The authors declare that the research was conducted in the absence of any commercial or financial relationships that could be construed as a potential conflict of interest.

Figures

Figure 1
Figure 1
Phylogenetic tree of CaCA proteins from B. napus (Bn), B. oleracea (Bo), B. rapa (Br), A. thaliana (At), O. sativa (Os), T. aestivum (Ta), G. max (Gm), and S. lycopersicum (Sl). The phylogenetic tree was constructed using the Maximum Likelihood method based on full-length CaCA protein sequences. Four main groups are indicated: CAX (red and yellow branches), CCX (pink branches), NCL (green branches), and MHX (blue branches). Red circles indicate bootstrap values.
Figure 2
Figure 2
Gene structure of CaCA genes in B. napus, B. oleracea, B. rapa, and A. thaliana. For each gene, the corresponding gene structure is displayed to the right, with coding sequences (CDS) shown as magenta boxes and untranslated regions (UTRs) shown as green boxes. Black lines represent introns. Gene names are labeled according to species: Bn (B. napus), Br (B. rapa), Bo (B. oleracea), and At (A. thaliana). The arrangement of exons and introns is drawn to scale, as indicated by the scale bar at the bottom. This visualization allows comparison of exon-intron organization among CaCA gene family members and across different species.
Figure 3
Figure 3
Conserved motif analysis of CaCA superfamily members in B. napus, B. oleracea, B. rapa, and A. thaliana. The distribution of conserved motifs identified by MEME is shown for four subgroups of the CaCA superfamily: CAX (top left), CCX (top right), NCL (bottom left), and MHX (bottom right). Each colored box represents a distinct conserved motif. Motif positions within each protein sequence are indicated by the scale at the bottom.
Figure 4
Figure 4
Box and whisker plots of codon bias parameters for the CaCA superfamily in B. napus, B. oleracea, B. rapa, and A. thaliana. The indices are shown as follows: (a) CAI, (b) FOP, (c) CBI, (d) ENC, and (e) GC3s. In each graph, the values for B. napus, B. oleracea, B. rapa, and A. thaliana are shown in red, green, yellow, and blue boxes, respectively.
Figure 5
Figure 5
Neutrality plot (a), PR2-plot (b), and ENC-plot (c) analysis of the CaCA superfamily in B. napus, B. oleracea, B. rapa, and A. thaliana. In all three plots, each point represents a gene, and different colors are used to indicate the genes from each plant species.
Figure 6
Figure 6
Intraspecies and interspecies synteny analysis of the CaCA superfamily in B. napus, B. oleracea, B. rapa, and A. thaliana. Chromosomes of B. napus are shown in black, B. rapa in light gray, B. oleracea in dark gray, and A. thaliana in white. Syntenic CaCA genes are connected by curved lines in various colors.
Figure 7
Figure 7
Promoter analysis (1.5 kilobases upstream of the start codon) of the CaCA superfamily in B. napus, B. oleracea, and B. rapa. Different colors and numbers within each box indicate the frequency of the corresponding cis-regulatory element in the promoter of that gene.
Figure 8
Figure 8
The expression pattern of BnCACa genes in response to ABA, Cold, NaCl, and dehyration stresses at various time points. Genes with |log2 (fold change)| > 1 and adjusted p-value < 0.01 were considered DEGs with significant expression changes. In the heat map, only the expression values of time points that showed a significant increase or decrease are displayed.

Similar articles

References

    1. Abedi A., Hajiahmadi Z., Kordrostami M., Esmaeel Q., Jacquard C. (2021). Analyses of lysin-motif receptor-like kinase (LysM-RLK) gene family in allotetraploid brassica napus L. and its progenitor species: an in silico study. Cells 11, 37. doi: 10.3390/cells11010037, PMID: - DOI - PMC - PubMed
    1. Ahmadi H., Corso M., Weber M., Verbruggen N., Clemens S. (2018). CAX1 suppresses Cd-induced generation of reactive oxygen species in Arabidopsis halleri. Plant Cell Environ. 41, 2435–2448. doi: 10.1111/pce.13362, PMID: - DOI - PubMed
    1. Amagaya K., Shibuya T., Nishiyama M., Kato K., Kanayama Y. (2019). Characterization and expression analysis of the Ca2+/cation antiporter gene family in tomatoes. Plants 9, 25. doi: 10.3390/plants9010025, PMID: - DOI - PMC - PubMed
    1. Andrews S., Krueger F., Segonds-Pichon A., Biggins L., Krueger C., Wingett S. (2010). FastQC. A quality control tool for high throughput sequence data 370. Available online at: http://www.bioinformatics.babraham.ac.uk/projects/fastqc.
    1. Bahiri-Elitzur S., Tuller T. (2021). Codon-based indices for modeling gene expression and transcript evolution. Comput. Struct. Biotechnol. J. 19, 2646–2663. doi: 10.1016/j.csbj.2021.04.042, PMID: - DOI - PMC - PubMed

LinkOut - more resources