. 2025 Jul 8:12:1618471.
doi: 10.3389/fmed.2025.1618471. eCollection 2025.

Constructing a novel mitochondrial metabolism-related genes signature to evaluate tumor immune microenvironment and predict survival of colorectal cancer

Affiliations

Constructing a novel mitochondrial metabolism-related genes signature to evaluate tumor immune microenvironment and predict survival of colorectal cancer

Hou Wang et al. Front Med (Lausanne). .

Abstract

Background: Colorectal cancer (CRC) is a highly lethal gastrointestinal malignancy with substantial global health implications. Although mitochondrial metabolism genes play a crucial role in CRC development, their prognostic significance remains unclear.

Methods: This study systematically analyzed the expression and prognostic value of mitochondrial metabolism-related genes in CRC patients, establishing a risk model using data from TCGA and GEO databases. We also investigated the tumor microenvironment (TME), immune cell infiltration, tumor mutation burden, microsatellite instability (MSI), and drug sensitivity. Core mitochondrial metabolism-related gene, TMEM86B was identified and its functions validated through cell-based assays and in vivo mouse models.

Results: Fifteen mitochondrial metabolism-related genes were identified, including HSD3B7, ORC1, GPSM2, NDUFA4L2, CHDH, LARS2, TMEM86B, FABP4, TNFAIP8L3, HMGCL, GDE1, ACOX1, ARV1, HDC, and GSR. The nomogram, which incorporates independent prognostic genes TMEM86B, TNFAIP8L3, HDC, and key clinical features pTNM stage (pathological Tumor-Node-Metastasis), age, was created to predict patient outcomes. Notable differences in immune cell infiltration were observed between risk groups. The risk score was associated with TME genes and immune checkpoints, indicating an immunosuppressive environment in high-risk groups. Furthermore, TIDE analysis revealed that integrating the risk score with immune score, stromal score, or microsatellite status improved the prediction of immunotherapy response across different CRC patient subgroups. Core mitochondrial metabolism-related gene, TMEM86B promotes colorectal cancer progression by enhancing cell proliferation, migration, and invasion, and its downregulation significantly inhibits tumor growth both in vitro and in vivo.

Conclusion: Our findings indicate that the risk model associated with mitochondrial metabolism may serve as a dependable prognostic indicator, facilitating tailored therapeutic strategies for CRC patients. TMEM86B promotes colorectal cancer progression, and its downregulation inhibits tumor growth in vitro and in vivo.

Keywords: colorectal cancer; drug susceptibility; immunotherapy; mitochondrial metabolism; prognostic biomarker; tumor microenvironment.


Conflict of interest statement

The authors declare that the research was conducted in the absence of any commercial or financial relationships that could be construed as a potential conflict of interest.

Figures

Figure 1
Figure 1
Workflow diagram: the flowchart of this study.
Figure 2
Figure 2
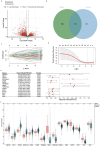
Identification of differentially expressed genes (DEGs) related to mitochondria metabolism and construction of a prognostic risk model using the TCGA-COADREAD cohort. (A) Volcano plot displaying 7,868 DEGs between COADREAD tumor and normal groups. (B) Venn diagram illustrating the overlap of 7,868 DEGs and 1,234 mitochondrial genes, resulting in the identification of 582 hub genes. (C,D) LASSO regression of the 65 overall survival (OS)-related genes, with cross-validation in the LASSO regression model to select the tuning parameter. The x-axis represents the log (λ) value, and the y-axis represents partial likelihood deviance. The red dots indicate partial likelihood deviations ± standard error for various tuning parameters. (E) Forest plot assessing 15 prognosis-related genes in predicting the prognosis of COADREAD, revealing their association with patient prognosis. (F) Gene expression levels of the 15 prognosis-related genes in the TCGA-COADREAD cohort (tumor samples: n = 620; normal samples: n = 51). p-values are indicated as: ***p < 0.001, **p < 0.01, *p < 0.05.
Figure 3
Figure 3
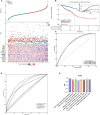
Assessing the Performance of the Prognostic Risk Model in the Training Cohort. (A) Distribution of risk scores, survival status (blue dots indicate deceased, red dots indicate alive), and gene expression of the 15 model genes in the TCGA-COADREAD training cohort. (B) Kaplan–Meier curves of overall survival (OS) for patients in the high- and low-risk groups in the TCGA-COADREAD training cohort. (C) ROC curves for predicting 1-, 3-, and 5-year OS in the TCGA-COADREAD training cohort. (D) Comparison of the risk score model, nomogram and clinicopathological characteristics in predicting the 5-year OS. (E) Comparison of gene expression-based prognostic signatures in CRC. Time-dependent ROC analysis for predicting overall survival outcomes at 5 years.
Figure 4
Figure 4
Assessing the performance of the prognostic risk model in the validation cohort. (A) Distribution of risk scores, survival status (red dots indicate deceased, blue dots indicate alive), and gene expression of the 15 model genes in the GSE17536 validation cohort. (B) Kaplan–Meier curves of overall survival (OS) for high- and low-risk groups in the GSE17536 validation cohort (n=177). (C) ROC curves for predicting 1-, 3-, and 5-year OS in the GSE17536 validation cohort.
Figure 5
Figure 5
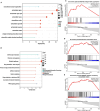
Enrichment analysis in the high-risk and low-risk groups. (A) Bubble map showing the 10 significant GO pathways, with bands of different colors representing biological process (BP), cellular component (CC), and molecular function (MF). The pathways were enriched by the genes listed on the left. (B) Bubble map illustrating the top 10 significant KEGG pathways, with bands of different colors representing each pathway. The pathways were enriched by the genes listed on the left. (C–E) GSEA identified different gene sets in the high-risk groups.
Figure 6
Figure 6
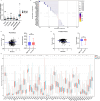
Association of risk score with tumor microenvironment (TME) Signatures in COADREAD. (A) Association between stromal score and risk score, and its distribution in the low- and high-risk groups. (B) Association between carcinoma-associated fibroblast (CAF) score and risk score, and its distribution in the low- and high-risk groups. (C) Correlation analysis of risk score with the expression of carcinoma-associated fibroblast (CAF) up- and down-signatures. (D) Correlation analysis of risk score with the expression of ECM and collagen signatures. (E) Correlation analysis of risk score with the expression of matrisome signatures. p-values are indicated as: ***p < 0.001, **p < 0.01, *p < 0.05.
Figure 7
Figure 7
Immune profiles comparison between low- and high-risk groups in the TCGA-COADREAD dataset. (A) EPIC analysis. (B) Correlation between risk score and expressions of activated CD8+ T cell signatures. (C) Correlation between risk score and immune score, and its distribution in the low- and high-risk groups. (D) Correlation between risk score and tumor purity, and its distribution in the low- and high-risk groups. (E) Variation in immune checkpoint expression. p-values are indicated as follows: ***p < 0.001, **p < 0.01, *p < 0.05, ns (not significant).
Figure 8
Figure 8
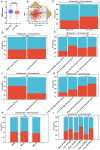
Risk score as a potential biomarker for predicting benefits from immune therapies in COADREAD. (A) Comparison of TIDE scores between low- and high-risk groups. (B) Correlation analysis between risk score and TIDE score. (C) Predicted proportion of immunotherapy responders in low- and high-risk groups within the TCGA-COADREAD cohort. (D) Predicted response rates to immunotherapy in patients with low and high immune scores (stratified by median cutoff), based on TIDE analysis. (E) TIDE-predicted response rates in four subgroups stratified by both risk score and immune score. (F) Predicted response rates in low- and high-stromal score groups (stratified by median cutoff). (G) TIDE-estimated immunotherapy responsiveness in four groups stratified by risk score and stromal score. (H) Predicted proportion of responders across different microsatellite statuses (MSS, MSI-L, and MSI-H). (I) TIDE-predicted immunotherapy response across six subgroups categorized by both risk score and microsatellite status. MSS, microsatellite stability (n=403); MSI-L, microsatellite instability-low (n=93); MSI-H, microsatellite instability-high (n=82). p-values are indicated as follows: ns (not significant); ***p < 0.001, **p < 0.01, *p < 0.05.
Figure 9
Figure 9
Mutation status in high- and low-risk groups in COADREAD. (A) Top 15 genes according to mutation frequency in high-risk groups. (B) Top 15 genes according to mutation frequency in low-risk groups. (C) Kaplan–Meier curves of OS of patients in high- and low-TMB groups combined with risk score in the TCGA-COADREAD cohort. (D) TMB score distribution in the low- and high-risk groups. Correlation between risk score and TMB in COADREAD. (E) Kaplan–Meier curves of OS of patients in MSS and MSI-H groups combined with risk score in the TCGA-COADREAD cohort. (F) MSI expression signature distribution in the low- and high-risk groups. Correlation between risk score and MSI expression signature in COADREAD. p-values are indicated as follows: ns (not significant); *p < 0.05; ***p < 0.001.
Figure 10
Figure 10
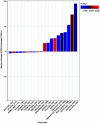
Risk score predicts drug therapeutic benefits in colon cancer. Proportion of normalized IC50 values of the top 10 sensitivity drugs in high-risk low-risk groups (p < 0.01).
Figure 11
Figure 11
Knockdown of TMEM86B inhibited CRC cells proliferation and migration in vitro and in vivo. (A) Western blot analysis of TMEM86B knock-down stably transfected cell lines. (B) Survival curve of TMEM86B in TCGA-COAD cohort in GEPIA2. (C,E) Clone formation and CCK8 assay of CRC cell lines with TMEM86B perturbation. 3 independent experiments were conducted, and data were shown with Mean ± SD (two-tailed t-test, **, p < 0.01, ***, p < 0.001). (D) Representative images of migration and invasion after TMEM86B was silenced in RKO and HCT116. (F) Representative images of resected subcutaneous tumors. (G) Subcutaneous tumor dimensions were recorded using calipers at every 4 days. And tumor volume was calculated by formula: Length x Width2/2 (mean ± SD, n = 5 for each group, one-way ANOVA, ***, p < 0.001). (H) Tumor weight was recorded at time of harvest and plotted according to treatment group (Mean ± SD, two-tailed t-test, *, p < 0.05).

Similar articles

References

    1. Bray F, Laversanne M, Sung H, Ferlay J, Siegel RL, Soerjomataram I, et al. Global cancer statistics 2022: GLOBOCAN estimates of incidence and mortality worldwide for 36 cancers in 185 countries. CA Cancer J Clin. (2024) 74:229–63. doi: 10.3322/caac.21834, PMID: - DOI - PubMed
    1. Arnold M, Sierra MS, Laversanne M, Soerjomataram I, Jemal A, Bray F. Global patterns and trends in colorectal cancer incidence and mortality. Gut. (2017) 66:683–91. doi: 10.1136/gutjnl-2015-310912, PMID: - DOI - PubMed
    1. Biller LH, Schrag D. Diagnosis and treatment of metastatic colorectal Cancer: A review. JAMA. (2021) 325:669–85. doi: 10.1001/jama.2021.0106, PMID: - DOI - PubMed
    1. Martinez-Outschoorn UE, Peiris-Pagés M, Pestell RG, Sotgia F, Lisanti MP. Cancer metabolism: a therapeutic perspective. Nat Rev Clin Oncol. (2017) 14:11–31. doi: 10.1038/nrclinonc.2016.60, PMID: - DOI - PubMed
    1. Galluzzi L, Kepp O, Heiden MGV, Kroemer G. Metabolic targets for cancer therapy. Nat Rev Drug Discov. (2013) 12:829–46. doi: 10.1038/nrd4145, PMID: - DOI - PubMed

LinkOut - more resources