. 2025 Jul 10:48:101059.
doi: 10.1016/j.bbih.2025.101059. eCollection 2025 Oct.

Hypertension promotes neuroinflammation, brain injury and cognitive impairment

Affiliations

Hypertension promotes neuroinflammation, brain injury and cognitive impairment

Quynh Nhu Dinh et al. Brain Behav Immun Health. .

Abstract

Background: Hypertension increases the risk for cognitive impairment and promotes vascular and renal inflammation. We tested if immune cell infiltration occurs in the brain during hypertension and if it is associated with cognitive impairment.

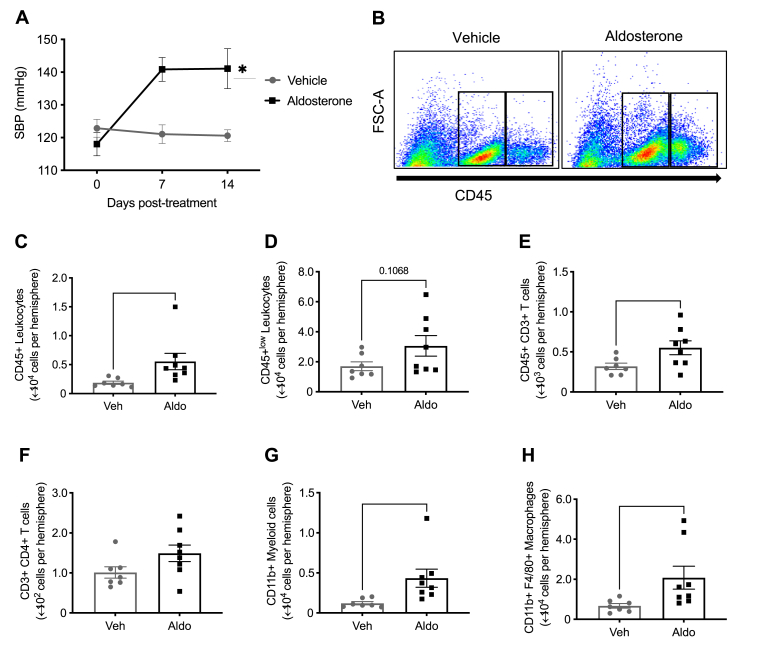
Methods: Male C57Bl/6 mice were administered vehicle, angiotensin II (0.7 mg/kg/d S.C.) or aldosterone (0.72 mg/kg/d S.C.) via osmotic minipumps. A subset of mice also received hydralazine (50 mg/kg) in their drinking water after minipump implantation. We measured systolic blood pressure, markers of inflammation, working memory and transcriptomic changes in the brain.

Results: Administration of angiotensin II or aldosterone increased blood pressure and promoted blood-brain barrier dysfunction, leukocyte accumulation and impairment of working memory in mice. When co-administered with angiotensin II, hydralazine prevented the development of these changes. In a separate cohort of mice in which angiotensin II-induced changes were first established, intervention with hydralazine lowered blood pressure but did not reverse brain inflammation or cognitive impairment. Finally, angiotensin II infusion altered the transcriptomic profile of the whole brain, as well as specifically within the hippocampus, and co-treatment with hydralazine modulated these changes.

Conclusions: Experimental hypertension leads to brain inflammation and was associated with impaired working memory. Cognitive impairment that develops during hypertension can be inhibited, but not readily reversed, by anti-hypertensive therapy.

Keywords: Blood-brain barrier; Brain; Cognition; Hypertension; Inflammation.


Conflict of interest statement

The authors declare the following financial interests/personal relationships which may be considered as potential competing interests:Christopher G. Sobey reports financial support was provided by the 10.13039/501100000925National Health and Medical Research Council, Australia. If there are other authors, they declare that they have no known competing financial interests or personal relationships that could have appeared to influence the work reported in this paper.

Figures

Fig. 1
Fig. 1
Angiotensin II infusion promotes immune cell infiltration in the brain. A: Angiotensin II-induced hypertension (n = 6–8). All data are mean ± S.E.M. ∗P < 0.05. Two-way ANOVA with Tukey's test. B: Representative flow cytometry dot plots showing gating strategy for microglia (CD45+ low) and total leukocytes (CD45+ high) from the brains of mice infused with vehicle or angiotensin II. The effect of angiotensin II infusion on C: CD45+ leukocytes, D: CD45+low microglia, E: CD3+ T cells, F: CD4+ T cells, G: CD11b + myeloid cells, H: Ly6G + neutrophils, I: Ly6C + low monocytes, J: Ly6C + high monocytes, K: F4/80+ macrophages and L: CD19+ B cells in the brain (n = 6–8). All data are mean ± S.E.M. ∗P < 0.05. Student's unpaired t-test.
Fig. 2
Fig. 2
Aldosterone infusion promotes immune cell infiltration in the brain. A: Aldosterone-induced hypertension (n = 8). All data are mean ± S.E.M. ∗P < 0.05. Two-way ANOVA with Tukey's test. B: Representative flow cytometry dot plots showing gating strategy for microglia (CD45+ low) and total leukocytes (CD45+ high) from the brains of mice infused with vehicle or aldosterone. The effect of aldosterone infusion on C: CD45+ leukocytes, D: CD45+low microglia, E: CD3+ T cells, F: CD4+ T cells, G: CD11b + myeloid cells and H: F4/80+ macrophages in the brain (n = 8). All data are mean ± S.E.M. ∗P < 0.05. Student's unpaired t-test.
Fig. 3
Fig. 3
Angiotensin II infusion promotes cognitive impairment and blood-brain barrier breakdown which is prevented by co-treatment with hydralazine. A: The effect of hydralazine on blood pressure in mice infused with vehicle or angiotensin II (n = 7–8). All data are mean ± S.E.M. ∗P < 0.05 vs vehicle. Two-way ANOVA with Tukey's test. B: Representative heatmap plots showing interaction between familiar and novel objects in mice infused with vehicle, angiotensin II, vehicle + hydralazine and angiotensin II + hydralazine. C: Effect of angiotensin II infusion and co-treatment of hydralazine on recognition memory (n = 9–12). All data are mean ± S.E.M. ∗P < 0.05. One-sample t-test vs. 50 %. D: Representative images showing IgG deposition (Alexa Flour 555, red) in hippocampus of mice infused with vehicle, angiotensin II, vehicle + hydralazine and angiotensin II + hydralazine. Nuclei are identified by DAPI counter-stain (blue). Scale bar = 200 μm. E: Effect of angiotensin II infusion and co-treatment of hydralazine on IgG deposition in the hippocampus (n = 7–8). All data are mean ± S.E.M. ∗P < 0.05. Two-way ANOVA with Sidak's test. F: Correlation between IgG deposition in hippocampus and systolic blood pressure (R2 = 0.13, P = 0.05). G: Representative images showing IgG deposition (Alexa Flour 555, red) in cortex of mice infused with vehicle, angiotensin II, vehicle + hydralazine and angiotensin II + hydralazine. Nuclei are identified by DAPI counter-stain (blue). Scale bar = 200 μm. H: Effect of angiotensin II infusion and co-treatment of hydralazine on IgG deposition in the cortex (n = 7–8). All data are mean ± S.E.M. ∗P < 0.05. Two-way ANOVA with Sidak's test. I: Correlation between IgG deposition in cortex and systolic blood pressure (R2 = 0.26, P < 0.05). (For interpretation of the references to colour in this figure legend, the reader is referred to the Web version of this article.)
Fig. 4
Fig. 4
Angiotensin II-induced increase in brain immune cell infiltration is blood pressure-dependent. A: Representative flow cytometry dot plots showing gating strategy for total leukocytes (CD45+ high) from the brains of mice infused with vehicle, angiotensin II, vehicle + hydralazine and angiotensin II + hydralazine. The effect of angiotensin infusion and co-treatment with hydralazine on B: CD45+ leukocytes, C: CD3+ T cells, D: CD4+ T cells, E: CD11b + myeloid cells, F: Ly6G + neutrophils, G: Ly6C + low monocytes, H: Ly6C + high monocytes, I: F4/80+ macrophages and J: CD19+ B cells in the brain (n = 7–8). All data are mean ± S.E.M. ∗P < 0.05. Two-way ANOVA with Tukey's test.
Fig. 5
Fig. 5
Angiotensin II-induced increase in neuroinflammation is blood pressure-dependent. The effect of angiotensin infusion and co-treatment with hydralazine on mRNA expression of A: chemokine (C-C motif) receptor 2 (CCR2), B: chemokine (C-C motif) ligand (CCL) 2, C: CCL7, D: CCL8, E: tumour necrosis factor-α, and F: interleukin-1β in the brain (n = 7–8). All data are mean ± S.E.M. ∗P < 0.05. Two-way ANOVA with Tukey's test.
Fig. 6
Fig. 6
Angiotensin II infusion promotes transcriptomic changes in the brain which is modulated by treatment with hydralazine. Volcano plot of differentially expressed genes in the brains of mice infused with A: vehicle vs angiotensin II or B: angiotensin II vs angiotensin II + hydralazine. The threshold of differential expression is p-value <0.05. The horizontal axis is the log2 fold change of genes. The vertical axis is statistical significance scaled as -log 10 p-value. Each dot represents an individual gene (blue: no significant difference; red: upregulated expression; green: downregulated expression). The top upregulated and downregulated genes in brains of mice infused with C: vehicle vs angiotensin II or D: angiotensin II vs angiotensin II + hydralazine. Upregulated genes in red and downregulated genes in blue. The colour scale represents the log10 (average FPKM + 1) value. (For interpretation of the references to colour in this figure legend, the reader is referred to the Web version of this article.)
Fig. 7
Fig. 7
Angiotensin II infusion promotes transcriptomic changes in the hippocampus which is modulated by treatment with hydralazine. Volcano plot of differentially expressed genes in the hippocampus of mice infused with A: vehicle vs angiotensin II or B: angiotensin II vs angiotensin II + hydralazine. The threshold of differential expression is p-value <0.05. The horizontal axis is the log2 fold change of genes. The vertical axis is statistical significance scaled as -log 10 p-value. Each dot represents an individual gene (blue: no significant difference; red: upregulated expression; green: downregulated expression). The top upregulated and downregulated genes in hippocampus of mice infused with C: vehicle vs angiotensin II or D: angiotensin II vs angiotensin II + hydralazine. Upregulated genes in red and downregulated genes in blue. The colour scale represents the log10 (average FPKM + 1) value. (For interpretation of the references to colour in this figure legend, the reader is referred to the Web version of this article.)
Fig. 8
Fig. 8
Intervention with hydralazine does not reverse angiotensin II-induced immune cell infiltration in the brain and cognitive impairment. A: Angiotensin II-induced hypertension and effect of intervention with hydralazine (n = 7–8). All data are mean ± S.E.M. ∗P < 0.05. Two-way ANOVA with Tukey's test. B: Representative flow cytometry dot plots showing gating strategy for total leukocytes (CD45+ high) from the brains of mice infused with angiotensin II and angiotensin II + hydralazine. C: The effect of intervention with hydralazine on angiotensin II-induced leukocyte infiltration in the brain (n = 7–8). All data are mean ± S.E.M. D: Representative heatmaps showing interaction between familiar and novel objects in mice infused with angiotensin II and angiotensin II + hydralazine. E: The effect of intervention with hydralazine on angiotensin II-induced cognitive impairment (n = 7–8). All data are mean ± S.E.M.

Similar articles

  • The Black Book of Psychotropic Dosing and Monitoring.
    DeBattista C, Schatzberg AF. DeBattista C, et al. Psychopharmacol Bull. 2024 Jul 8;54(3):8-59. Psychopharmacol Bull. 2024. PMID: 38993656 Free PMC article. Review.
  • Short-Term Memory Impairment.
    Cascella M, Al Khalili Y. Cascella M, et al. 2024 Jun 8. In: StatPearls [Internet]. Treasure Island (FL): StatPearls Publishing; 2025 Jan–. 2024 Jun 8. In: StatPearls [Internet]. Treasure Island (FL): StatPearls Publishing; 2025 Jan–. PMID: 31424720 Free Books & Documents.
  • Neurocognition in youth with versus without prediabetes.
    Quillian J, Attuquayefio T, Sung J, Canna A, Ko T, Davis X, Maciejewski K, Li F, Santoro N, Pierpont B, Kullmann S, Preissl H, Morys F, Dagher A, Caprio S, Small DM. Quillian J, et al. medRxiv [Preprint]. 2025 Jun 23:2025.06.23.25330130. doi: 10.1101/2025.06.23.25330130. medRxiv. 2025. PMID: 40666321 Free PMC article. Preprint.
  • Interventions for eye movement disorders due to acquired brain injury.
    Rowe FJ, Hanna K, Evans JR, Noonan CP, Garcia-Finana M, Dodridge CS, Howard C, Jarvis KA, MacDiarmid SL, Maan T, North L, Rodgers H. Rowe FJ, et al. Cochrane Database Syst Rev. 2018 Mar 5;3(3):CD011290. doi: 10.1002/14651858.CD011290.pub2. Cochrane Database Syst Rev. 2018. PMID: 29505103 Free PMC article.
  • Eplerenone for hypertension.
    Tam TS, Wu MH, Masson SC, Tsang MP, Stabler SN, Kinkade A, Tung A, Tejani AM. Tam TS, et al. Cochrane Database Syst Rev. 2017 Feb 28;2(2):CD008996. doi: 10.1002/14651858.CD008996.pub2. Cochrane Database Syst Rev. 2017. PMID: 28245343 Free PMC article.

References

    1. Aldrich A., Kielian T. Central nervous system fibrosis is associated with fibrocyte-like infiltrates. Am. J. Pathol. 2011;179:2952–2962. doi: 10.1016/j.ajpath.2011.08.036. - DOI - PMC - PubMed
    1. Baik S.H., Selvaraji S., Fann D.Y., Poh L., Jo D.G., Herr D.R., Zhang S.R., Kim H.A., Silva M., Lai M.K.P., et al. Hippocampal transcriptome profiling reveals common disease pathways in chronic hypoperfusion and aging. Aging (Albany NY) 2021;13:14651–14674. doi: 10.18632/aging.203123. - DOI - PMC - PubMed
    1. Batterman K.V., Cabrera P.E., Moore T.L., Rosene D.L. T cells actively infiltrate the white matter of the aging monkey brain in relation to increased microglial reactivity and cognitive decline. Front. Immunol. 2021;12 doi: 10.3389/fimmu.2021.607691. - DOI - PMC - PubMed
    1. Bowman G.L., Dayon L., Kirkland R., Wojcik J., Peyratout G., Severin I.C., Henry H., Oikonomidi A., Migliavacca E., Bacher M., et al. Blood-brain barrier breakdown, neuroinflammation, and cognitive decline in older adults. Alzheimer's Dement. 2018;14:1640–1650. doi: 10.1016/j.jalz.2018.06.2857. - DOI - PubMed
    1. Bozoki A., Giordani B., Heidebrink J.L., Berent S., Foster N.L. Mild cognitive impairments predict dementia in nondemented elderly patients with memory loss. Arch. Neurol. 2001;58:411–416. - PubMed

LinkOut - more resources