. 2025 May 10:52:360-375.
doi: 10.1016/j.jot.2025.04.014. eCollection 2025 May.

Chk2 deletion rescues bone loss and cellular senescence induced by Bmi1 deficiency via regulation of Cyp1a1

Affiliations

Chk2 deletion rescues bone loss and cellular senescence induced by Bmi1 deficiency via regulation of Cyp1a1

Yining Liu et al. J Orthop Translat. .

Abstract

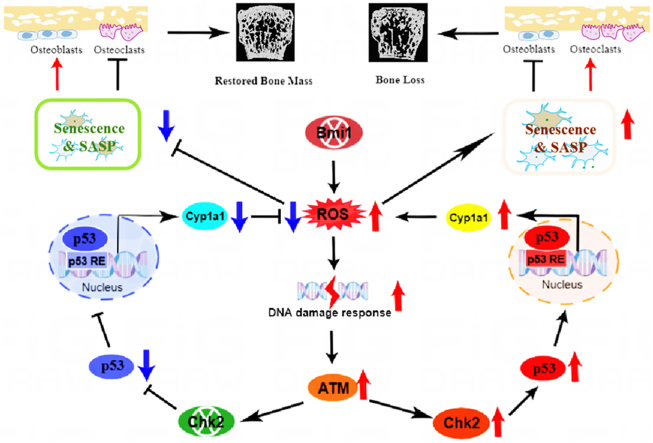
Background/objective: Bone homeostasis, maintained by a balance between osteoblastic bone formation and osteoclastic bone resorption, is disrupted in osteoporosis, leading to reduced bone mass and increased fracture risk. Bmi1, a polycomb group protein, is crucial for stem cell self-renewal and senescence regulation. Bmi1 deficiency has been linked to oxidative stress, DNA damage, and premature osteoporosis. Checkpoint kinase 2 (Chk2) is a key mediator of the DNA damage response (DDR) pathway, which can exacerbate bone aging through oxidative stress and senescence. This study investigated the role of Chk2 deletion in mitigating bone loss and cellular senescence caused by Bmi1 deficiency and explored the underlying molecular mechanisms, focusing on the regulation of oxidative stress via Cyp1a1.

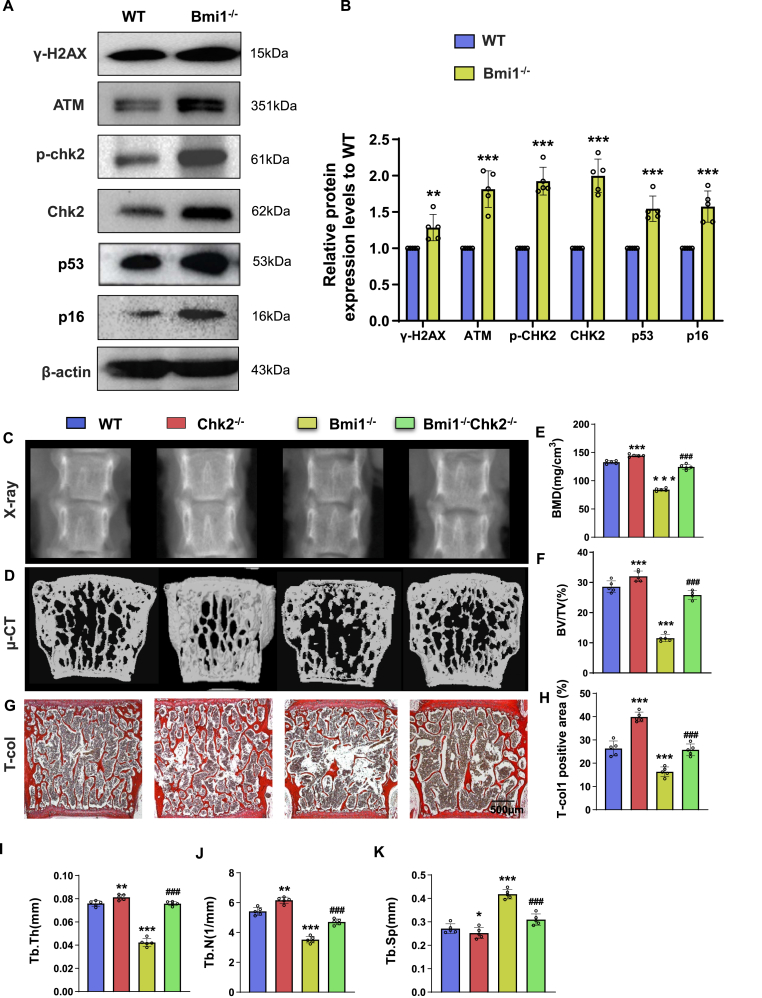
Methods: We utilized Bmi1-deficient (Bmi1-/-), Chk2-deficient (Chk2-/-), and double knockout (Bmi1-/-Chk2-/-) mice to assess bone homeostasis. Bone mineral density (BMD), trabecular architecture, and bone turnover markers were evaluated using X-ray imaging, micro-CT, histological staining, and bone histomorphometry. Oxidative stress markers, DDR pathway activation, and senescence-associated secretory phenotype (SASP) were analyzed using Western blotting, immunohistochemistry, and real-time PCR. Transcriptome sequencing identified differentially expressed genes, including Cyp1a1, which was further validated through chromatin immunoprecipitation (ChIP), luciferase assays, and knockdown experiments in bone marrow mesenchymal stem cells (BMSCs).

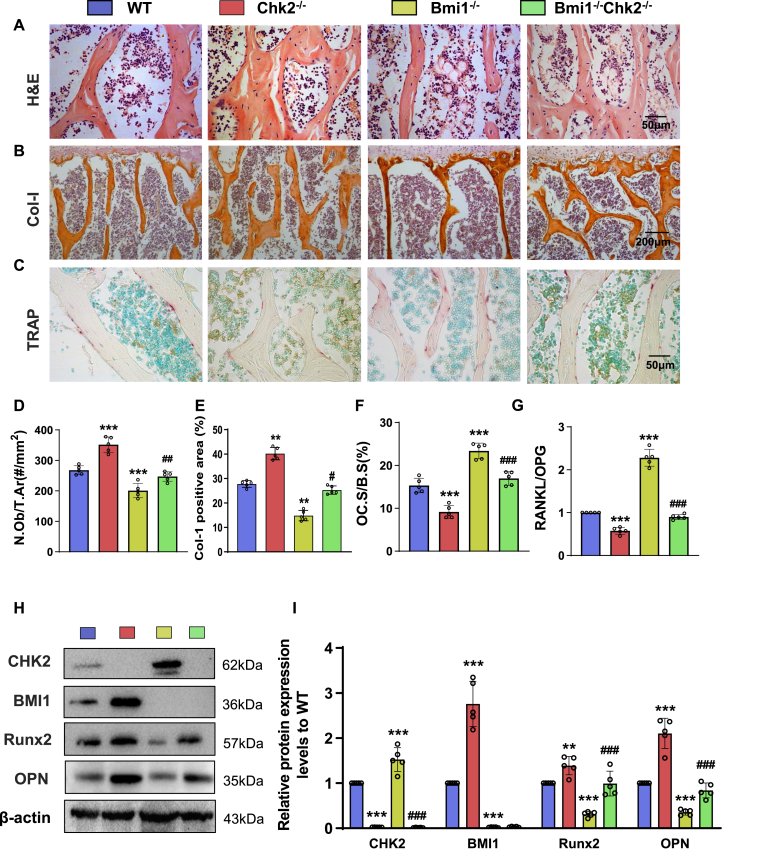
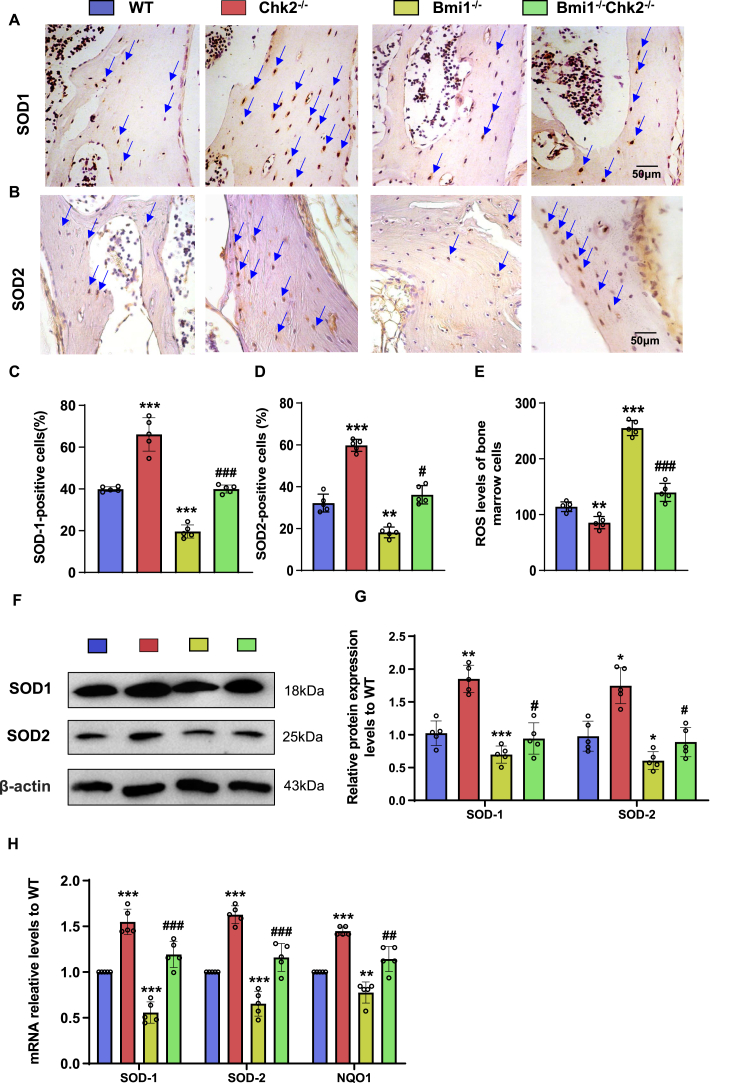
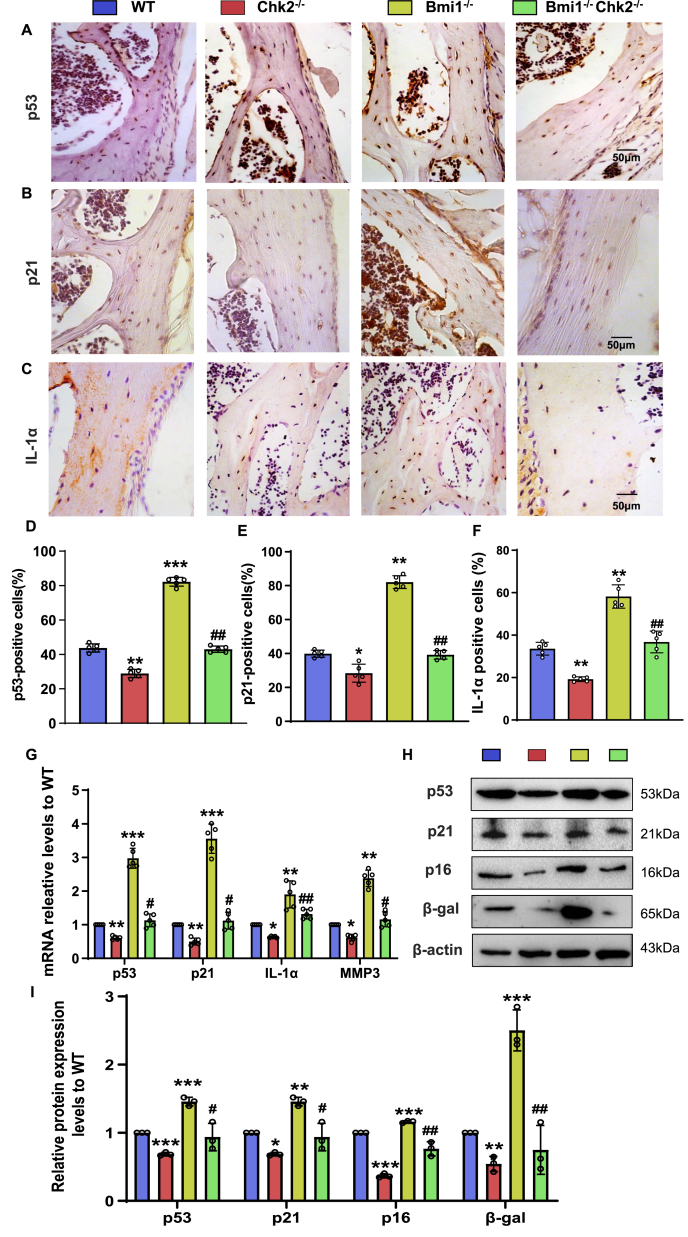
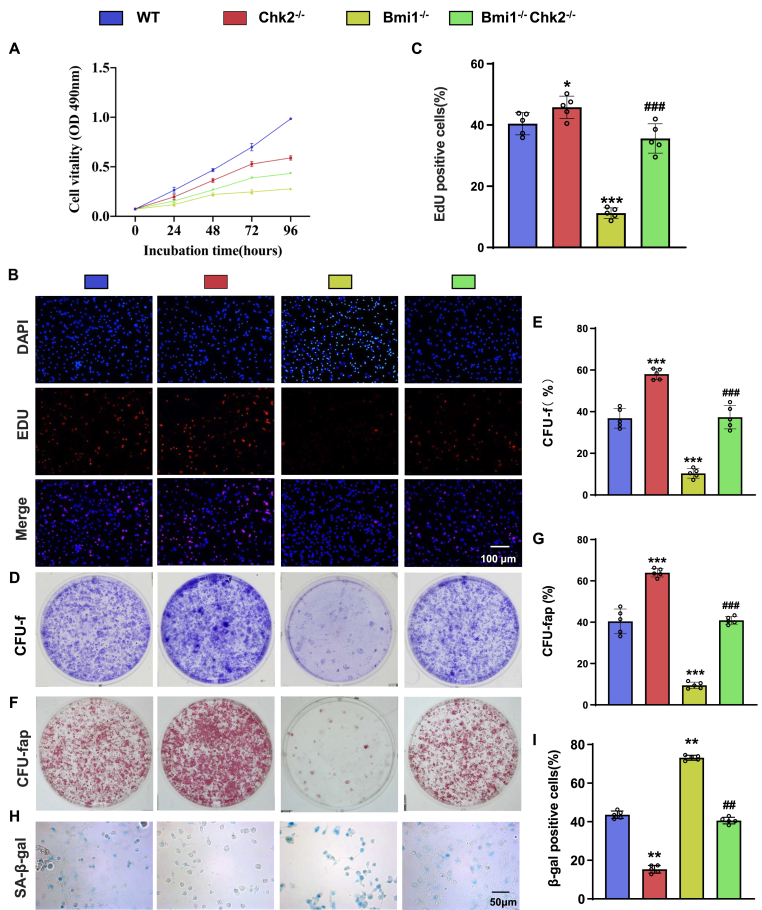
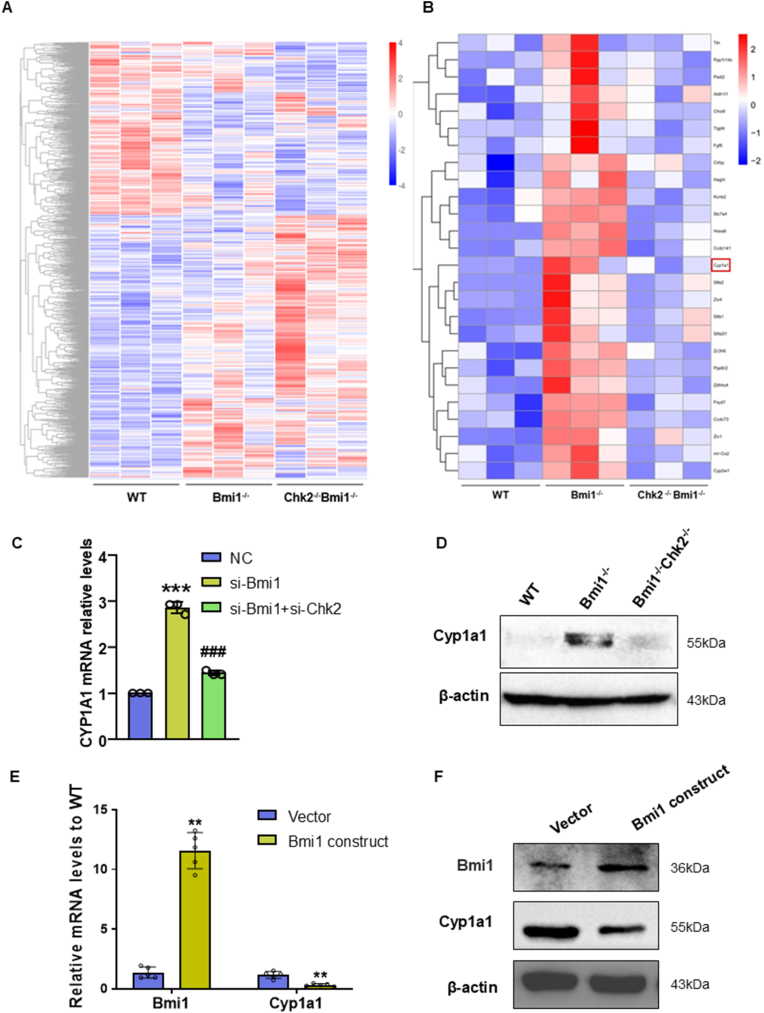
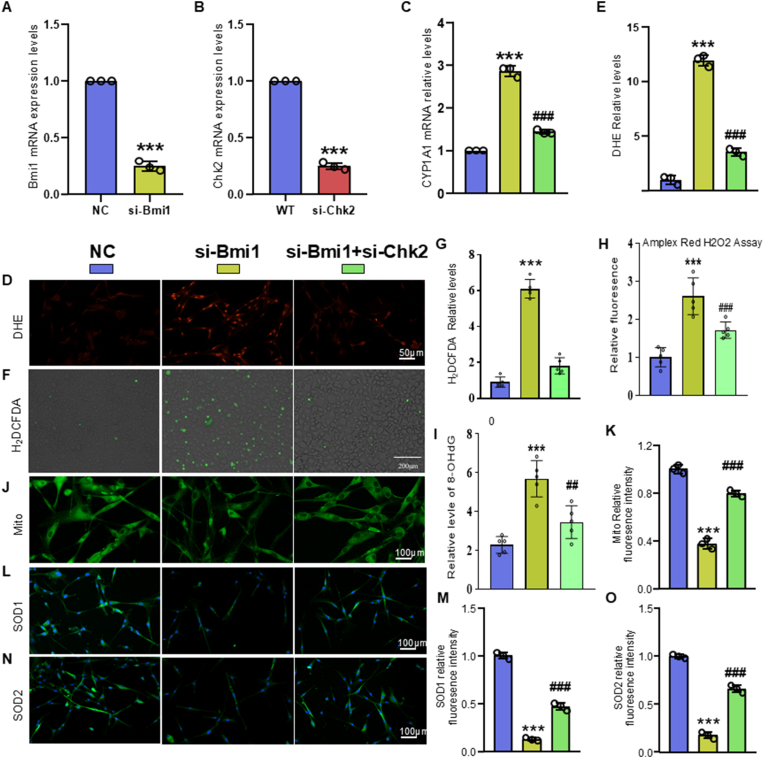
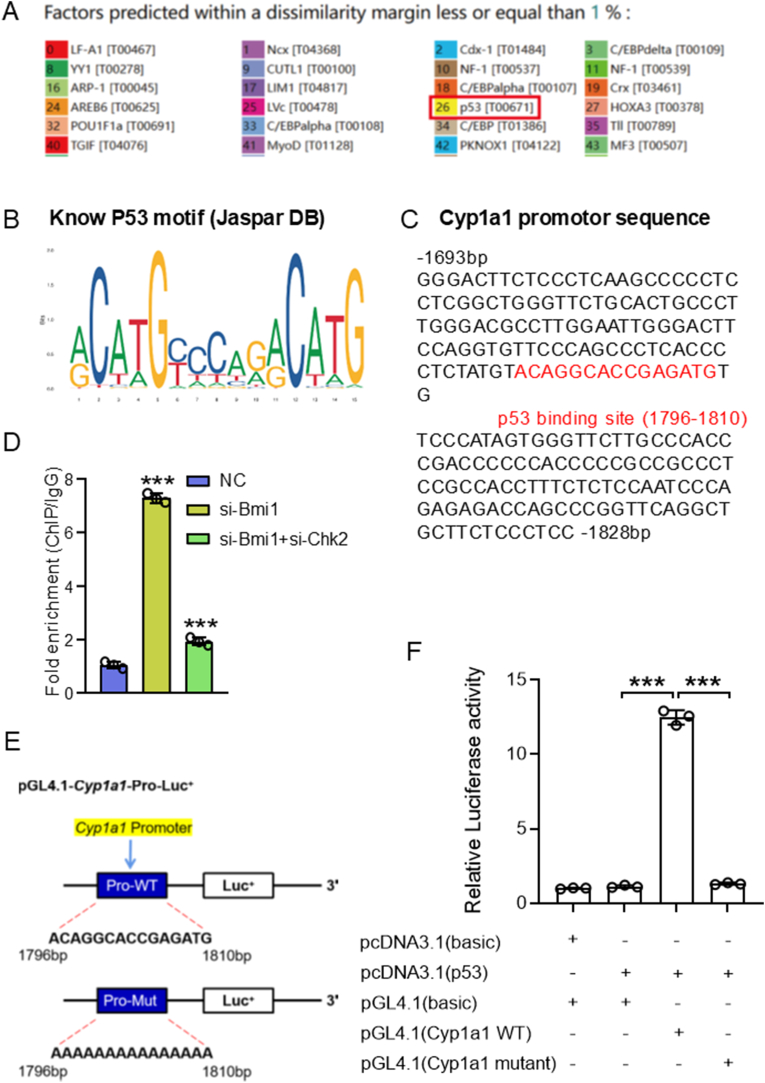
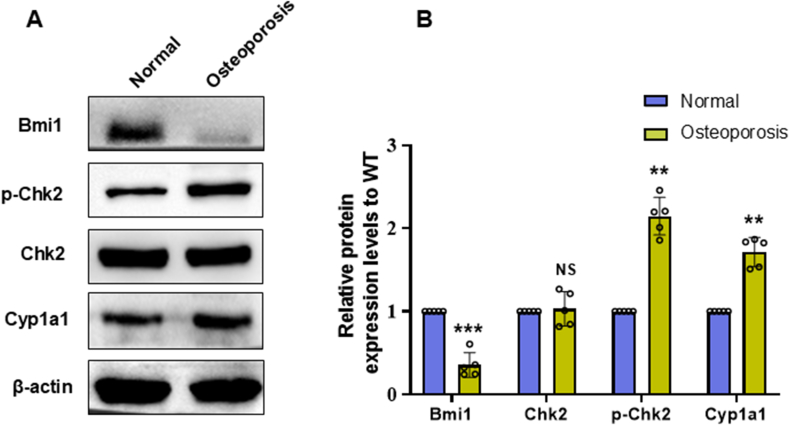
Results: Bmi1 deficiency activated the ATM-Chk2-p53 DDR pathway, increased oxidative stress, and induced osteocyte senescence and senescence-associated secretory phenotype (SASP), leading to reduced osteoblastic bone formation, increased osteoclastic bone resorption, and significant bone loss. Chk2 knockout rescued these defects by reducing oxidative stress and senescence. In Bmi1-/-Chk2-/- mice, BMD, trabecular bone volume, collagen deposition, and osteoblast markers (Runx2 and OPN) were significantly improved, while osteoclast markers (TRAP and RANKL/OPG ratio) were reduced compared to Bmi1-/- mice. Oxidative stress markers, including SOD1 and SOD2, were restored, and senescence markers such as p16, p21, and β-gal activity were significantly decreased. Transcriptome analysis identified Cyp1a1 as a key regulator of oxidative stress downstream of Bmi1 and Chk2. Bmi1 deficiency upregulated Cyp1a1, increasing ROS levels, while Chk2 knockout downregulated Cyp1a1 and mitigated oxidative stress. Mechanistically, p53 was shown to directly bind the Cyp1a1 promoter and activate its transcription, with Chk2 knockout reducing p53-mediated Cyp1a1 expression. These findings highlight the critical role of the Bmi1-Chk2-p53-Cyp1a1 axis in regulating bone homeostasis.

Conclusion: Chk2 knockout rescues bone loss and cellular senescence induced by Bmi1 deficiency by reducing oxidative stress through downregulation of Cyp1a1. These findings provide novel insights into the molecular mechanisms underlying bone aging and identify Chk2 and Cyp1a1 as potential therapeutic targets for osteoporosis and age-related bone disorders.

The translational potential of this article: This study identifies Chk2 and Cyp1a1 as potential therapeutic targets for osteoporosis and age-related bone loss. Targeting Chk2 or Cyp1a1 could mitigate oxidative stress and cellular senescence, offering a novel approach to preserving bone mass and preventing fractures in aging populations.

Keywords: Bmi1; Cellular senescence; Chk2; Cyp1a1; Osteoporosis; Oxidative stress.


Conflict of interest statement

The authors declare no conflicts of interest.

Figures

Image 1
Graphical abstract
Fig. 1
Fig. 1
Effects of Bmi1 knockout on the activation of the DDR pathway in bone tissue and Chk2 knockout corrects bone loss caused by Bmi1 deficiency (A) Western blot detection showing changes in the expression levels of γ-H2AX, ATM, p-Chk2, Chk2, p53, and p16 proteins in vertebral bone tissue of 8-week-old WT and Bmi1−/− mice. The legend indicates the different levels of each protein. (B) Statistical analysis of protein expression levels. Data represent the mean ± SEM from three independent biological replicates. ∗: P < 0.05, ∗∗: P < 0.01, ∗∗∗: P < 0.001, compared with WT mice. (C) X-ray images of lumbar vertebral bodies in 8-week-old WT, Bmi1−/−, Chk2−/−, and Bmi1−/−Chk2−/− mice; (D) Micro-CT 3D reconstruction of lumbar vertebral bodies; (E) Bone mineral density (BMD, mg/cm3); (F) Bone volume/total volume (BV/TV, %); (G) Microscopic images of total collagen staining of paraffin sections; (H) Total collagen positive area; (I) Trabecular thickness (Tb.Th, mm); (J) Trabecular number (Tb.N, #/mm); (K) Trabecular separation (Tb.Sp, mm). Values are mean ± SEM of 5 determinations per group. ∗: p < 0.05, ∗∗: P < 0.01, ∗∗∗: p < 0.001,compared to WT mice. ###: P < 0.001, compared to Bmi1−/− mice.
Fig. 2
Fig. 2
Chk2 knockout corrects decreased osteoblastic bone formation and increased osteoclastic bone resorption caused by Bmi1 deficiency (A) HE staining microscopic images of lumbar vertebral body paraffin sections from 8-week-old WT, Bmi1−/−, Chk2−/−, and Bmi1−/−Chk2−/− mice; (B) Type I collagen (Col-I) immunohistochemical staining microscopic images; (C) TRAP histochemical staining microscopic images; (D) Number of osteoblasts/bone surface (N.Ob/B.S., #/mm2); (E) Col-I positive area percentage (%); (F) Osteoclast surface/bone surface (Oc.S/B.S, %); (G) RANKL/OPG. (H) Western blot detection of Chk2, Bmi1, Runx2, and OPN protein expression levels and (I) statistical results; Values are mean ± SEM of 5 determinations per group. ∗: p < 0.05, ∗∗: p < 0.01, ∗∗∗: p < 0.001,compared to WT mice. #: P < 0.05; ##: P < 0.01; ###: P < 0.001, compared to Bmi1−/− mice.
Fig. 3
Fig. 3
Chk2 knockout restores the decreased expression of antioxidant enzymes caused by Bmi1 deficiency (A) SOD1 and (B) SOD2 immunohistochemical staining microscopic images of lumbar vertebral body paraffin sections from 8-week-old WT, Bmi1−/−, Chk2−/−, and Bmi1−/−Chk2−/− mice; (C & D) Percentage of SOD1 and SOD2 positive osteocytes; (E) ROS levels of bone marrow cells. (F) Western blot detection of changes in SOD1 and SOD2 protein expression levels in vertebral bone tissue and (G) statistical results; (H) qRT-PCR detection of changes in SOD1, SOD2, and NQO1 mRNA expression levels in lumbar vertebral bone tissue. Values are mean ± SEM of 5 determinations per group. ∗: p < 0.05, ∗∗: p < 0.01, ∗∗∗: p < 0.001,compared to WT mice. #: P < 0.05; ##: P < 0.01, compared to Bmi1−/− mice.
Fig. 4
Fig. 4
Chk2 knockout inhibits osteocyte senescence and SASP caused by Bmi1 deficiency (A) p16 immunohistochemical staining microscopic images and (D) percentage of p16 positive cells in lumbar vertebral body paraffin sections from 8-week-old WT, Bmi1−/−, Chk2−/−, and Bmi1−/−Chk2−/− mice; (B) p21 immunohistochemical staining microscopic images and (E) percentage of p21 positive cells; (C) IL-1α immunohistochemical staining microscopic images and (F) percentage of IL-1α positive cells; (G) qRT-PCR detection of changes in p53, P21, IL-1α, and Mmp8 mRNA expression levels in lumbar vertebral bone tissue; (H) Western blot detection of changes in p53, p21, p16, and β-gal protein expression levels in lumbar vertebral bone tissue and (I) statistical results. Values are mean ± SEM of 5 determinations per group. ∗: p < 0.05, ∗∗: p < 0.01, ∗∗∗: p < 0.001,compared to WT mice. #: P < 0.05; ##: P < 0.01; ###: P < 0.001, compared to Bmi1−/− mice.
Fig. 5
Fig. 5
Chk2 knockout improves the decreased proliferation and differentiation ability and increased senescence of BMSCs caused by Bmi1 deficiency (A) MTT assay detection of the growth viability of BMSCs derived from WT, Bmi1−/−, ChK2−/−, and Bmi1−/−ChK2−/− mice; (B) EdU immunofluorescence staining and (C) percentage of positive cells (red); (D) Representative images of CFU-f positive for methylene blue staining and (E) percentage of CFU-f positive area (%); (F) Representative images of ALP cytochemical staining positive CFU-f (CFU-fap) and (G) percentage of CFU-fap positive area (%); (H) SA-β-gal cytochemical staining microscopic images and (I) percentage of SA-β-gal positive cells. Values are mean ± SEM of 5 determinations per group. ∗: p < 0.05, ∗∗: p < 0.01, ∗∗∗: p < 0.001,compared to WT mice. ##: P < 0.01; ###: P < 0.001, compared to Bmi1−/− mice.
Fig. 6
Fig. 6
Identification of key regulatory molecules of oxidative stress increased by Bmi1 deficiency and inhibited by Chk2 knockout (A) Gene heatmap showing differentially expressed genes in bone tissue of WT, Bmi1−/−, and Bmi1−/−Chk2−/− mice. (B) Clustering heatmap of differentially expressed genes showing upregulated genes in Bmi1−/− mouse bone tissue and downregulated genes in Bmi1−/−Chk2−/− mouse bone tissue. (C) qRT-PCR detection showing differences in Cyp1a1 mRNA expression levels in bone tissue from the 3 groups of mice. (D) Western blot detection showing Cyp1a1 protein expression levels in bone tissue. (E) qRT-PCR detection of Bmi1 and Cyp1a1 mRNA expression levels in control and Bmi1 overexpressing mouse BMSCs. (F) Western blot detection showing Bmi1 and Cyp1a1 protein in control and Bmi1 overexpressing mouse BMSCs. Values are mean ± SEM of 3 or 5 determinations per group. ∗∗: p < 0.01; ∗∗∗: P < 0.001, compared with controls or WT mice; ###: P < 0.001, compared with Bmi1−/− mice.
Fig. 7
Fig. 7
Bmi1 knockdown increases while Chk2 knockdown inhibits oxidative stress in BMSCs by regulating Cyp1a1 expression (A & B) qRT-PCR detection of the knockdown efficiency of Bmi1 and Chk2 in human BMSCs. (C) qRT-PCR detection of Cyp1a1 mRNA expression levels in control, Bmi1 knockdown, and Bmi1 and Chk2 double knockdown human BMSCs. (D & E) Representative microscopic images of ROS fluorescent probe-DHE staining and statistical results of relative ROS levels. (F & G) Representative microscopic images of H2DCFDA dye staining and statistical results of relative H2DCFDA fluorescence levels. (H) Amplex Red assay showing that H2O2 levels in control, Bmi1 knockdown, and Bmi1 and Chk2 double knockdown human BMSCs. (I) Elisa detection 8-OHdG levels in control, Bmi1 knockdown, and Bmi1 and Chk2 double knockdown human BMSCs. (JK) Representative microscopic images of MitoTracker™ dye staining and statistical results of relative mitochondrial fluorescence intensity. (L&M) Representative microscopic images of SOD1 immunofluorescence staining and statistical results of relative fluorescence intensity. (N & O) Representative microscopic images of SOD2 immunofluorescence staining and statistical results of relative fluorescence intensity. Values are mean ± SEM of 3 or 5 determinations per group. ∗∗∗: P < 0.001, compared with control cells; ##: P < 0.01; ###: P < 0.001, compared with si-Bmi1 cells.
Fig. 8
Fig. 8
p53 transcriptionally regulates Cyp1a1 expression in human BMSCs (A) PROMO database (https://alggen.lsi.upc.es/cgi-bin/promo_v3/promo/promoinit.cgi?dirDB=TF_8.3) prediction results of upstream transcription factors of Cyp1a1; (B & C) Predicted presence of p53 binding sites in the Cyp1a1 promoter region (red areas); (D) ChIP-qPCR detection of the effects of Bmi1 knockdown and Bmi1/Chk2 double knockdown on the abundance of p53 binding to the Cyp1a1 gene promoter region. (E) Schematic diagram of the luciferase reporter gene plasmid containing the Cyp1a1 promoter region; (F) Luciferase reporter assays were performed in 293T cells transfected with the Cyp1a1 promoter-luciferase construct using Lipofectamine 3000 (Invitrogen). Cells were co-transfected with a Renilla luciferase plasmid for normalization. After 48 h, luciferase activity was measured using the Dual-Luciferase Reporter Assay System (Promega) and normalized to Renilla luminescence. Each experiment was performed with three biological replicates; ∗∗∗: P < 0.001, compared with control cells; ###: P < 0.001, compared with si-Bmi1 cells.
Supplementary Figure 1
The Bmi1–Chk2–CYP1A1 axis in BMSCs derived from patients with osteoporosis (A) Western blot detection showing Bmi1, Chk2, p-Chk2 and Cyp1a1 protein in normal and osteoporosis, and (B) statistical results. Values are mean ± SEM of 5 determinations per group. ∗∗: p<0.01, ∗∗∗: p<0.001, compared with normal. NS: no significance.

Similar articles

References

    1. Zaidi M. Skeletal remodeling in health and disease. Nat Med. 2007;13(7):791–801. - PubMed
    1. Rachner T.D., Khosla S., Hofbauer L.C. Osteoporosis: now and the future. Lancet. 2011;377(9773):1276–1287. - PMC - PubMed
    1. Park I.K., Qian D., Kiel M., Becker M.W., Pihalja M., Weissman I.L., et al. Bmi-1 is required for maintenance of adult self-renewing haematopoietic stem cells. Nature. 2003;423(6937):302–305. - PubMed
    1. Chen G., Zhang Y., Yu S., Sun W., Miao D. Bmi1 overexpression in mesenchymal stem cells exerts antiaging and antiosteoporosis effects by inactivating p16/p19 signaling and inhibiting oxidative stress. Stem Cell. 2019;37(9):1200–1211. - PMC - PubMed
    1. Zhang H.W., Ding J., Jin J.L., Guo J., Liu J.N., Karaplis A., et al. Defects in mesenchymal stem cell self-renewal and cell fate determination lead to an osteopenic phenotype in Bmi-1 null mice. J Bone Miner Res. 2010;25(3):640–652. - PubMed

LinkOut - more resources